Business
Infographic Timeline: 10 Years of Tinder


Infographic Timeline: Ten Years of Tinder
A decade of swiping and over half a billion downloads later, Tinder still leads the market share of online dating apps in the United States at 32%.
What started as a “hook-up” app 10 years ago for college students, is now a mainstream hit that is globally used in 190 countries and 45 languages.
The graphic above highlights key moments that have shaped the app’s success, using data from Match Group’s investor presentations and news reports.
From Hatch to Match: The Early Days of Tinder
The concept of the app emerged when the original founding partners, Sean Rad and Joe Munoz, won a hackathon in 2012. Their collaboration lead to the development of Tinder (originally named Matchbox).
Marketing the app to college students was a strategic decision that quickly gained the interest of millennials. This young demographic had been traditionally underserved in the online dating world, and with the global adoption of smartphones, a mobile-only dating app hit the right spot at the right time.
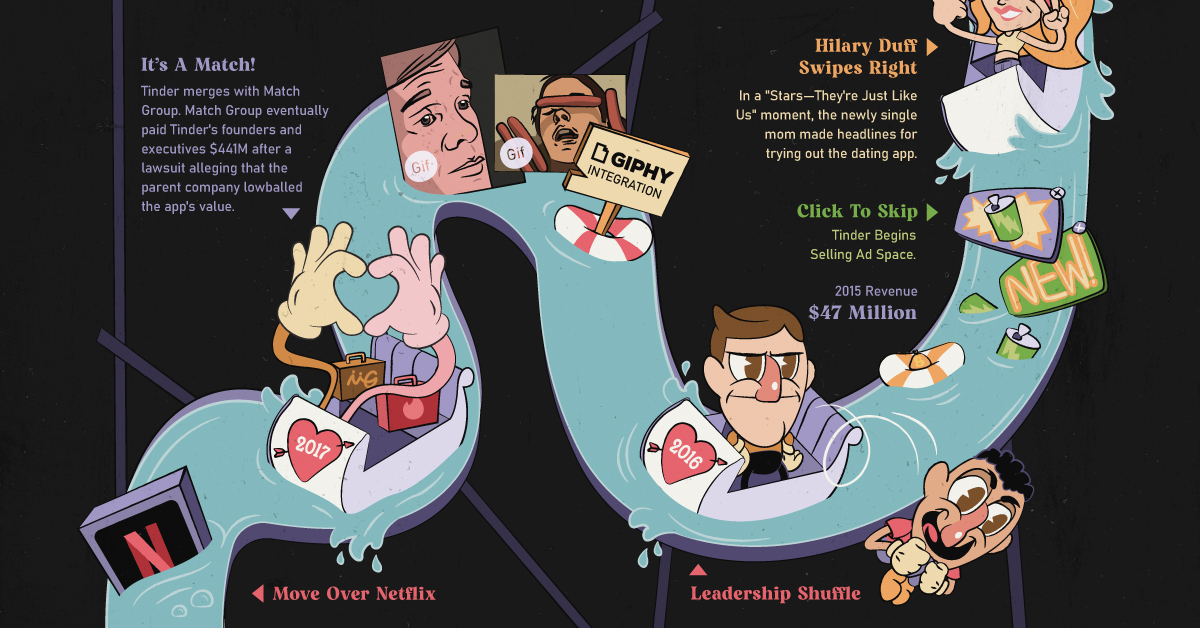
Monetization began in 2015 when premium features became exclusively available for paid users. Annual revenue that year was $47 million and by 2021 that grew to $1.7 billion.
Match Group acquired Tinder in 2017, with a $3 billion valuation. But at the time, very few could predict the stellar run Tinder would have, having risen to become the top dating app in the world and one of the most popular apps overall.
This surge in popularity is also reflected in the financials — Tinder is just one of the 30 dating apps that Match Group owns, but it represents over 50% of their overall revenues. In addition, Tinder is closing in on generating $2 billion per year.
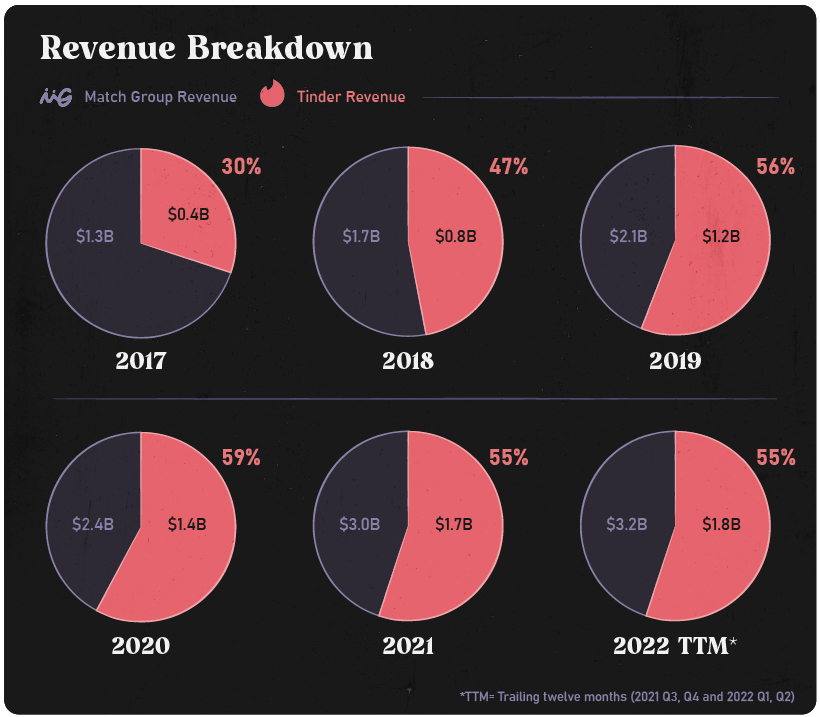
Today, Match Group is worth roughly $17 billion, and by some estimates Tinder is worth around $9 billion, over triple the price of the original acquisition.
Note: Tinder’s value is based on the valuation multiples for online dating companies as well as Tinder’s revenues as a portion of Match Group’s total.
Tinder and Technology
The swipe feature was an integral part of Tinder’s design, and it revolutionized the dating world. Gamifying dating was a novel concept when the feature was introduced back in 2012.
From the 1998 film “You’ve Got Mail” to today’s dopamine-inducing hit of “It’s a Match!,” it’s easy to see the influence technology has on the way we date and mate.
Below is a snapshot of app features that have been driven by technology and culture:
| Year | Technological Feature | Key Business Focus |
|---|---|---|
| 2012 | The “Swipe” | Gamification is the hook |
| 2014 | Tinder Plus | App monetization driven by user experience |
| 2015 | Instagram Integration & Facebook “Common Connections” | Network effects |
| 2017 | Tinder Gold | Power to the user - “Insight to who has liked me” |
| 2019 | Traveler Alert | Putting user safety first |
| 2020 | Panic Button / “Are You Sure?” | Putting user safety first |
| 2021 | Plus One | The pursuit of connections post-covid |
| 2023? | Virtual Exploration - It’s a “Swipe Party” | Understanding the changing demographic |
The Tinder Algorithm
Rating people’s attractiveness can be a controversial subject. Websites like Hot or Not and Mark Zuckerberg’s Facemash are cringe-worthy reminders of the internet’s past.
During the app’s early development, the discovery of a new match relied partially on the “Elo” rating system to score desirability. Attractiveness was evaluated by how often people swiped. The more selective you were with swiping, the higher your attractiveness was rated within the algorithm.
But now according to Tinder’s pressroom:
“Elo is old news at Tinder.”
Instead, Tinder’s algorithmic criteria for profile discovery depends on the users:
- Recent activity – members who are sending likes and nopes
- Profile elements such as the user’s interests
- Location
Tinder now says that proximity is a key factor in how people match on the app.
The Future of Tinder: A Changing Demographic
Today, as the company attempts to target Gen Z, the company’s revenue growth expectations are more lukewarm thanks to shifting cultural preferences,
And keeping the app relevant to a young demographic requires thoughtful consideration that goes beyond just adding new technological features. According to research organization YouthSight, more than 90% of Gen Z’ers report having frustrations with dating apps.
Only time will tell if technological incentives such as features for the metaverse, or virtual coins that further gamify the dating app, are attractive enough for Tinder to compete against the allures of meeting people IRL.


Finance
Ranked: The World’s 50 Largest Private Equity Firms
In this graphic, we show the largest private equity firms in the world—from titan Blackstone to China’s leading alternative funds.
The World’s 50 Largest Private Equity Firms
This was originally posted on our Voronoi app. Download the app for free on iOS or Android and discover incredible data-driven charts from a variety of trusted sources.
In 2023, private equity firms controlled $8.2 trillion in assets globally according to McKinsey & Company, a figure that has rapidly expanded since the industry first emerged 40 years ago.
As large investors such as pension funds and insurance companies increasingly look to private markets, these alternative asset managers have seen their assets grow by more than twofold in the last five years.
This graphic shows the top 50 private equity firms worldwide, based on data from Private Equity International (PEI).
The Top 50 Private Equity Firms
To determine the rankings, private equity firms were defined as those that raise capital with the purpose of directly investing in businesses, covering diversified private equity, venture capital, growth equity, buyouts, along with turnaround or control-oriented distressed investment capital.
The ranking does not include funds of funds, private investment in public equity (PIPE), or funds that follow a secondaries, real estate, infrastructure, hedge fund, debt or mezzanine strategies.
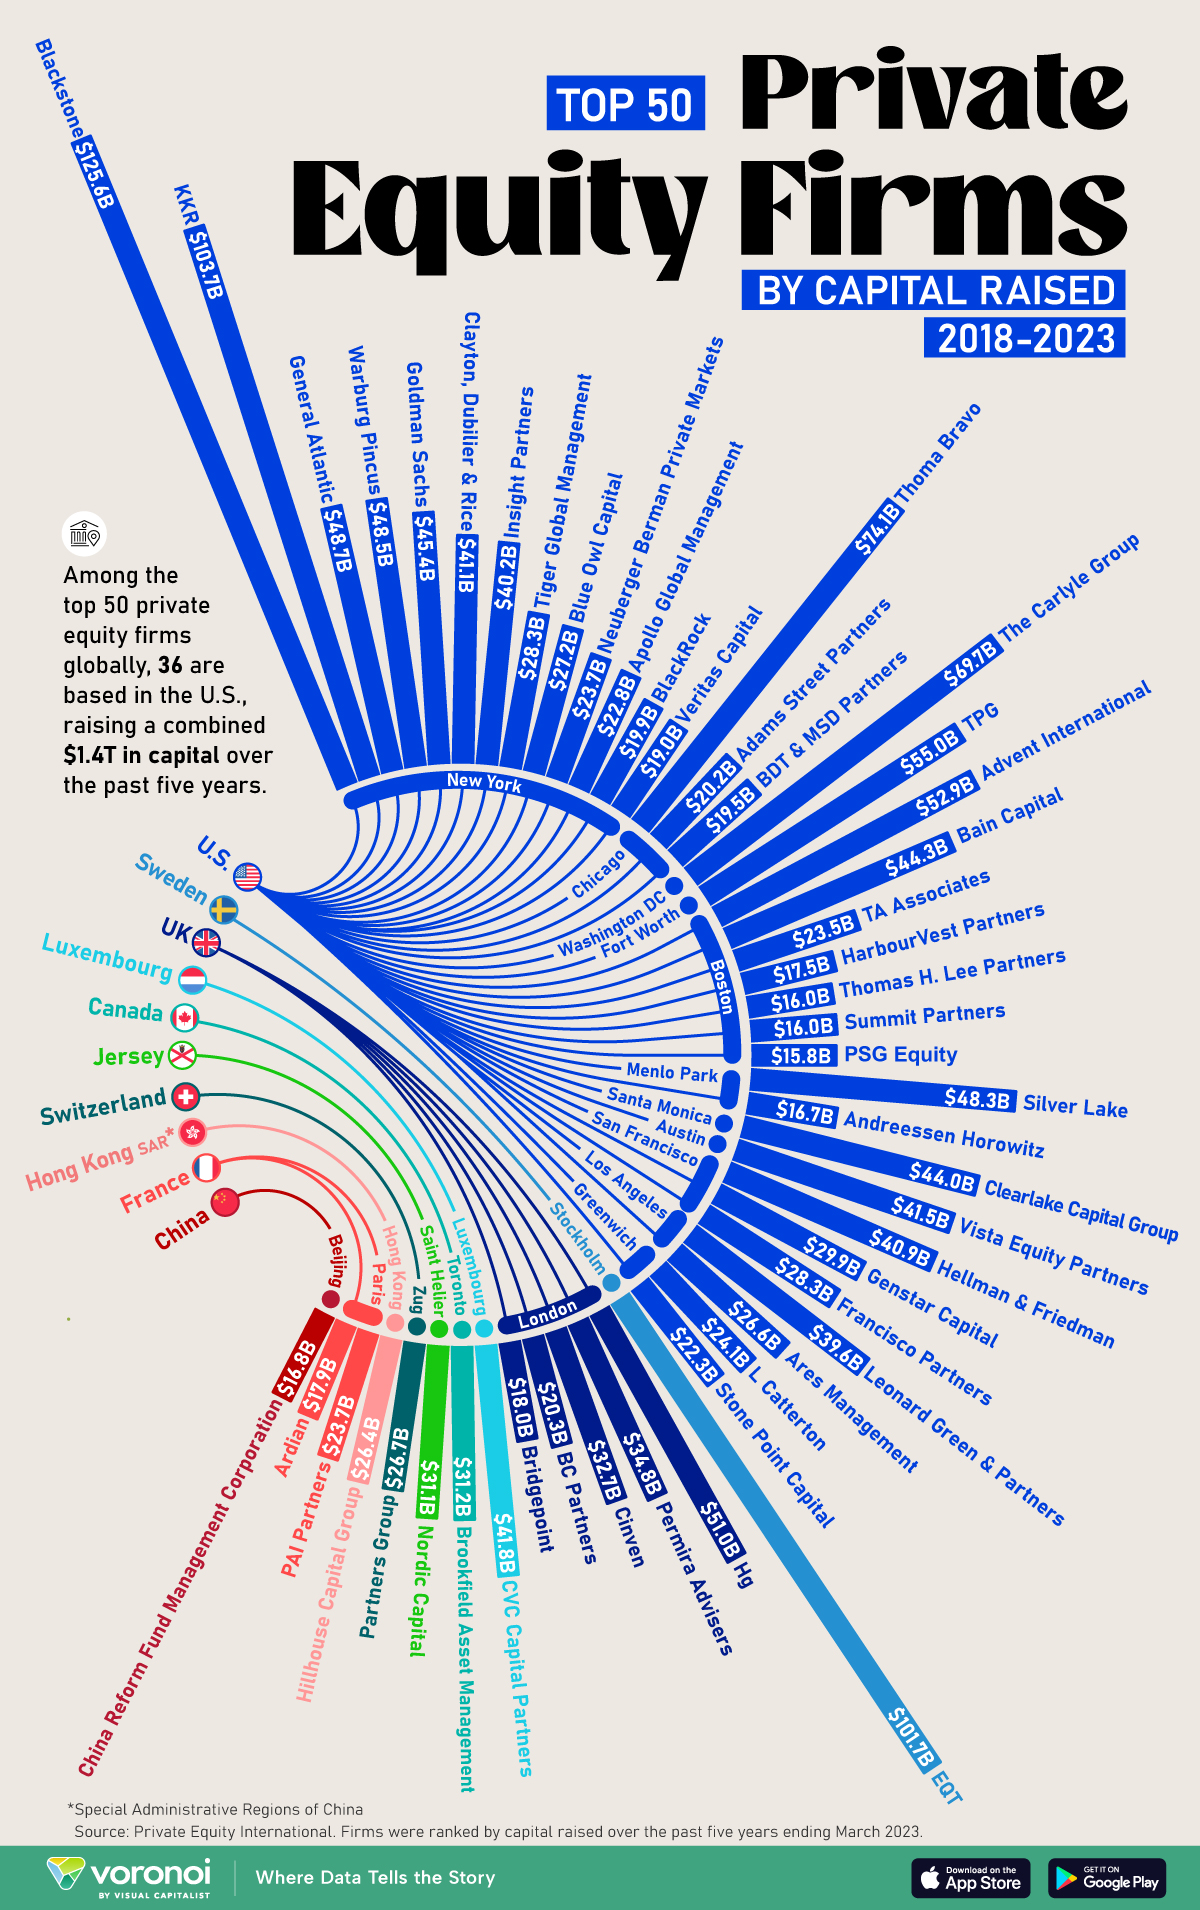
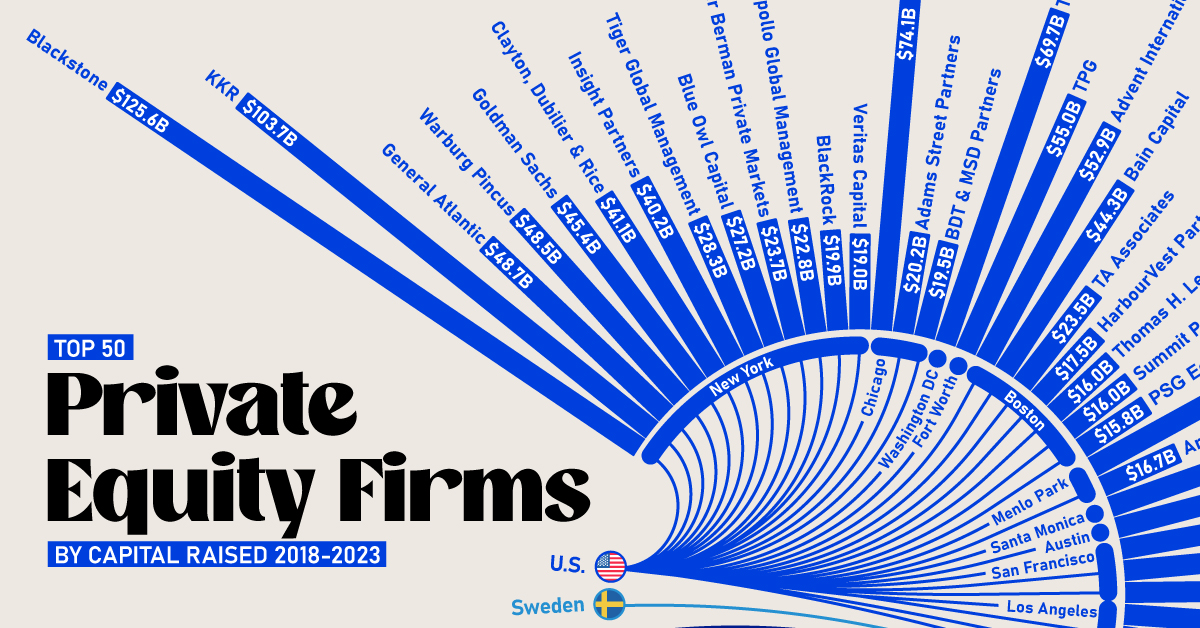
Below, we show the 50 biggest private equity companies around the world, measured by the scale of capital raised over the five-year period ending March 31, 2023:
| Ranking | Fund Manager | City | Capital Raised |
|---|---|---|---|
| 1 | Blackstone | New York | $125.6B |
| 2 | KKR | New York | $103.7B |
| 3 | EQT | Stockholm | $101.7B |
| 4 | Thoma Bravo | Chicago | $74.1B |
| 5 | The Carlyle Group | Washington DC | $69.7B |
| 6 | TPG | Fort Worth | $55.0B |
| 7 | Advent International | Boston | $52.9B |
| 8 | Hg | London | $51.0B |
| 9 | General Atlantic | New York | $48.7B |
| 10 | Warburg Pincus | New York | $48.5B |
| 11 | Silver Lake | Menlo Park | $48.3B |
| 12 | Goldman Sachs | New York | $45.4B |
| 13 | Bain Capital | Boston | $44.3B |
| 14 | Clearlake Capital Group | Santa Monica | $44.0B |
| 15 | CVC Capital Partners | Luxembourg | $41.8B |
| 16 | Vista Equity Partners | Austin | $41.5B |
| 17 | Clayton, Dubilier & Rice | New York | $41.1B |
| 18 | Hellman & Friedman | San Francisco | $40.9B |
| 19 | Insight Partners | New York | $40.2B |
| 20 | Leonard Green & Partners | Los Angeles | $39.6B |
| 21 | Permira Advisers | London | $34.8B |
| 22 | Cinven | London | $32.7B |
| 23 | Brookfield Asset Management | Toronto | $31.2B |
| 24 | Nordic Capital | Saint Helier | $31.1B |
| 25 | Genstar Capital | San Francisco | $29.9B |
| 26 | Francisco Partners | San Francisco | $28.3B |
| 27 | Tiger Global Management | New York | $28.3B |
| 28 | Blue Owl Capital | New York | $27.2B |
| 29 | Partners Group | Zug | $26.7B |
| 30 | Ares Management | Los Angeles | $26.6B |
| 31 | Hillhouse Capital Group | Singapore | $26.4B |
| 32 | L Catterton | Greenwich | $24.1B |
| 33 | Neuberger Berman Private Markets | New York | $23.7B |
| 34 | PAI Partners | Paris | $23.7B |
| 35 | TA Associates | Boston | $23.5B |
| 36 | Apollo Global Management | New York | $22.8B |
| 37 | Stone Point Capital | Greenwich | $22.3B |
| 38 | BC Partners | London | $20.3B |
| 39 | Adams Street Partners | Chicago | $20.2B |
| 40 | BlackRock | New York | $19.9B |
| 41 | BDT & MSD Partners | Chicago | $19.5B |
| 42 | Veritas Capital | New York | $19.0B |
| 43 | Bridgepoint | London | $18.0B |
| 44 | Ardian | Paris | $17.9B |
| 45 | HarbourVest Partners | Boston | $17.5B |
| 46 | China Reform Fund Management Corporation | Beijing | $16.8B |
| 47 | Andreessen Horowitz | Menlo Park | $16.7B |
| 48 | Thomas H. Lee Partners | Boston | $16.0B |
| 49 | Summit Partners | Boston | $16.0B |
| 50 | PSG Equity | Boston | $15.8B |
Private equity titan Blackstone is the top in the United States and the world, raising $125.6 billion in capital from 2018 to 2023.
Headquartered in New York, Blackstone’s total assets under management stood at $991 billion as of the first quarter of 2023, and have since surpassed $1 trillion this year. For perspective, this is comparable to the GDP of the Netherlands.
Following next in line are KKR and Sweden’s EQT, each raising over $100 billion. In fact, this was the first time three firms achieved this $100 billion equity-raise milestone in PEI’s ranking over a five-year period. This was particularly notable given a challenging fundraising landscape amid higher borrowing costs and lagging dealmaking activity.
North American Firms Dominate Private Equity
As we can see, the vast majority of the biggest private equity firms are based in America, accounting for 36 of the top 50 firms globally. North American PE firms made up $1.34 trillion (72%) of the $1.85 trillion raised by the top 50 firms in the ranking.
Falling in second by a wide margin is Europe, with nine firms making up $179 billion (9.7%) of the total funds raised. Many of Europe’s largest private equity firms are based in London, England, with the most prominent asset managers in the city being Hg and Permira Advisors.
Across Asia, the top alternative investment firm was Singapore-based Hillhouse Capital Group, which launched in 2005. The firm has backed several internet companies spanning from Tencent, the largest publicly-traded company in China, to Baidu, but has faced increasing setbacks amid regulatory crackdowns and a sluggish Chinese stock market.

-

 Mining1 week ago
Where the World’s Aluminum is Smelted, by Country
-

 Culture6 days ago
How Popular Snack Brand Logos Have Changed
-

 Mining7 days ago
Visualizing Copper Production by Country in 2023
-

 Politics1 week ago
Charted: How Americans Feel About Federal Government Agencies
-

 Healthcare1 week ago
Which Countries Have the Highest Infant Mortality Rates?
-

 Demographics1 week ago
Mapped: U.S. Immigrants by Region
-

 Economy1 week ago
Mapped: Southeast Asia’s GDP Per Capita, by Country
-

 Automotive1 week ago
How People Get Around in America, Europe, and Asia