Misc
Infographic: The Longest Lasting Cars, in Miles


Infographic: The Longest Lasting Cars, in Miles
When properly maintained, well-built cars can last an impressive amount of miles.
Consider this 2006 Honda Civic, which hit one million miles on its original engine and transmission. Amusingly, the car’s odometer maxes out at 999,999 miles.
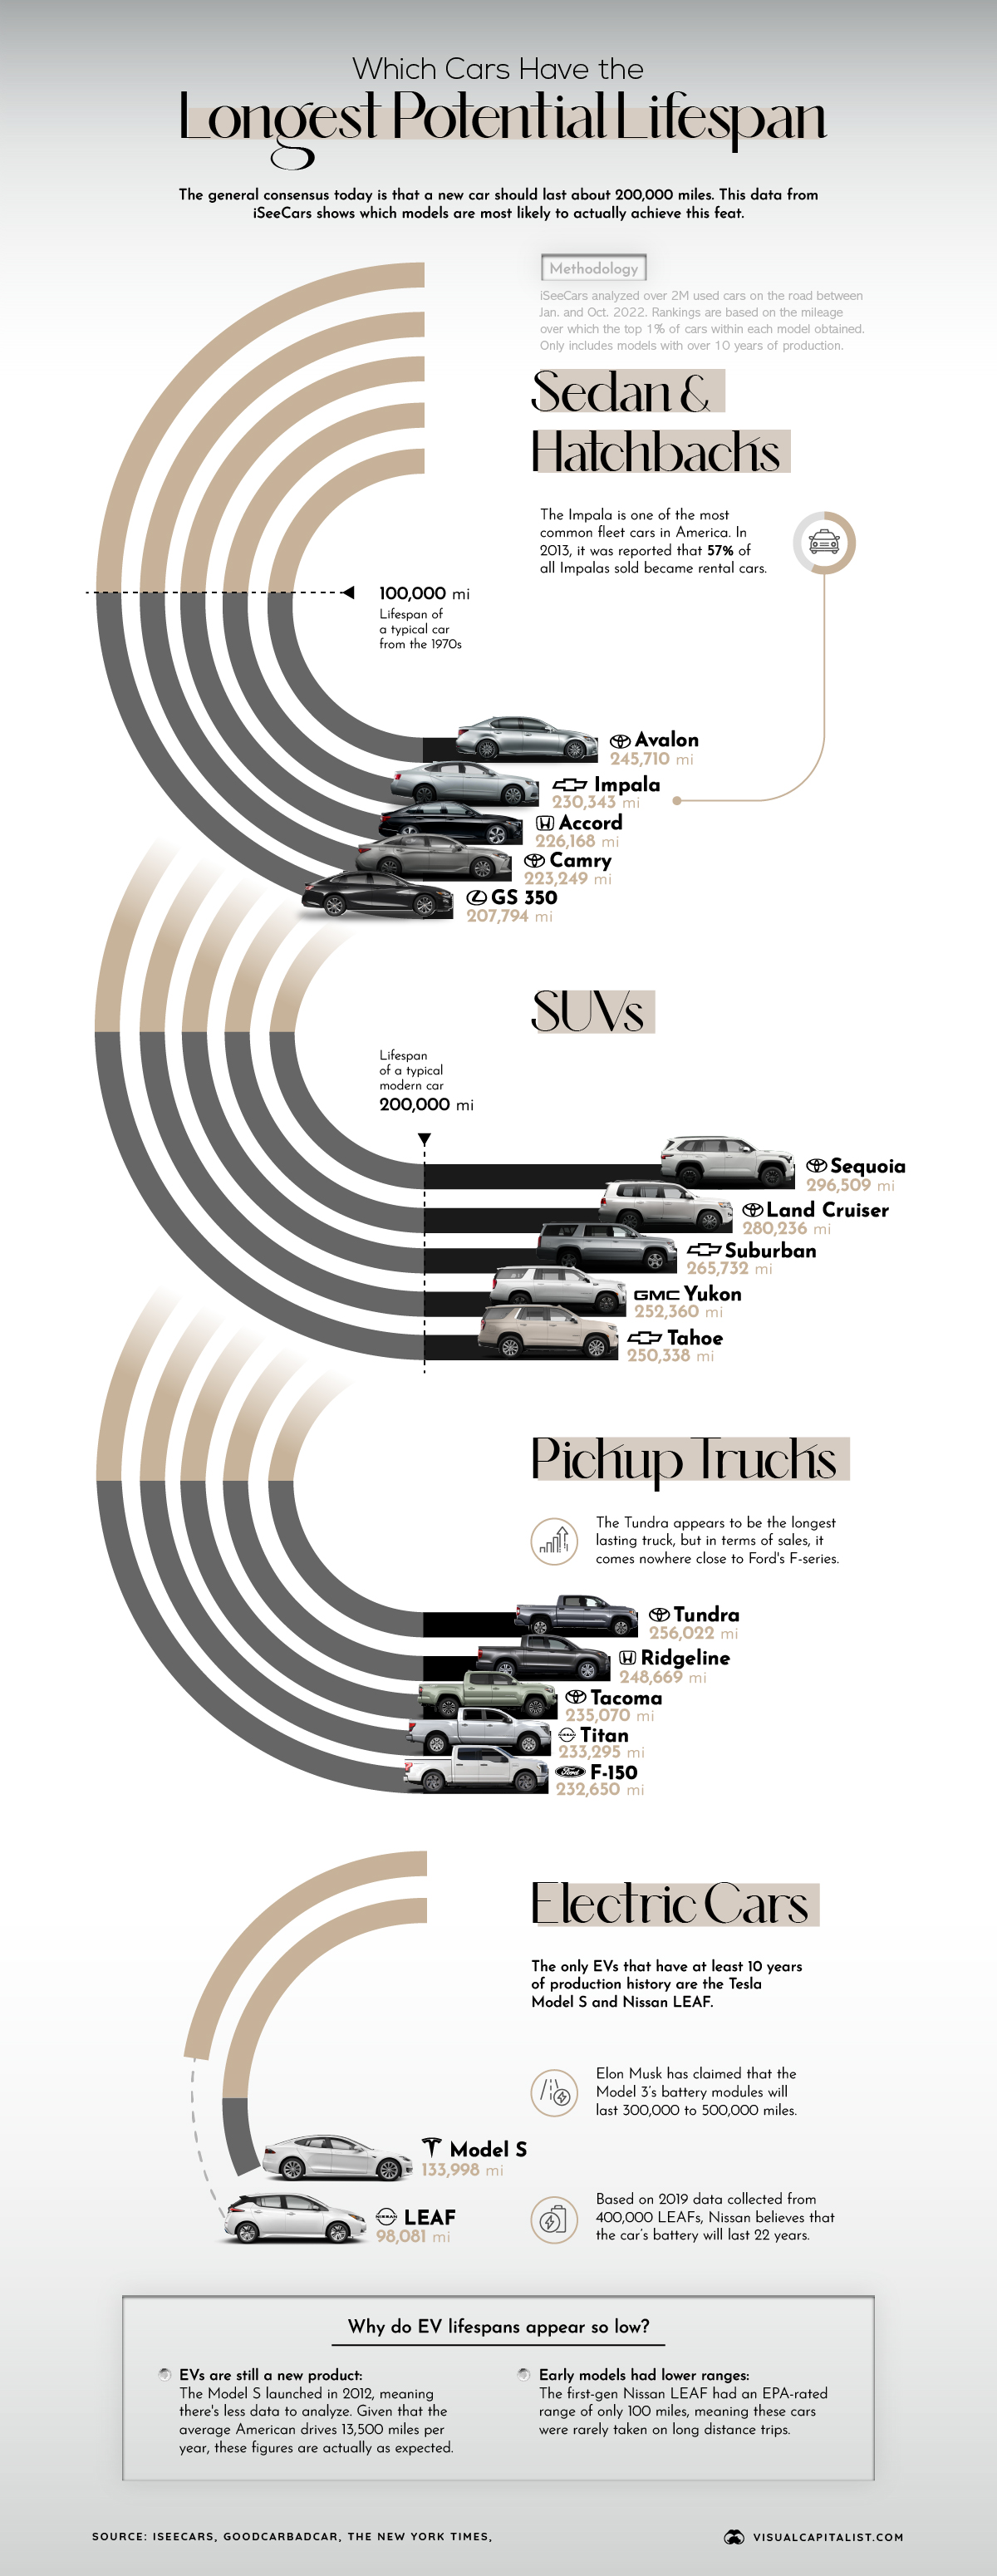
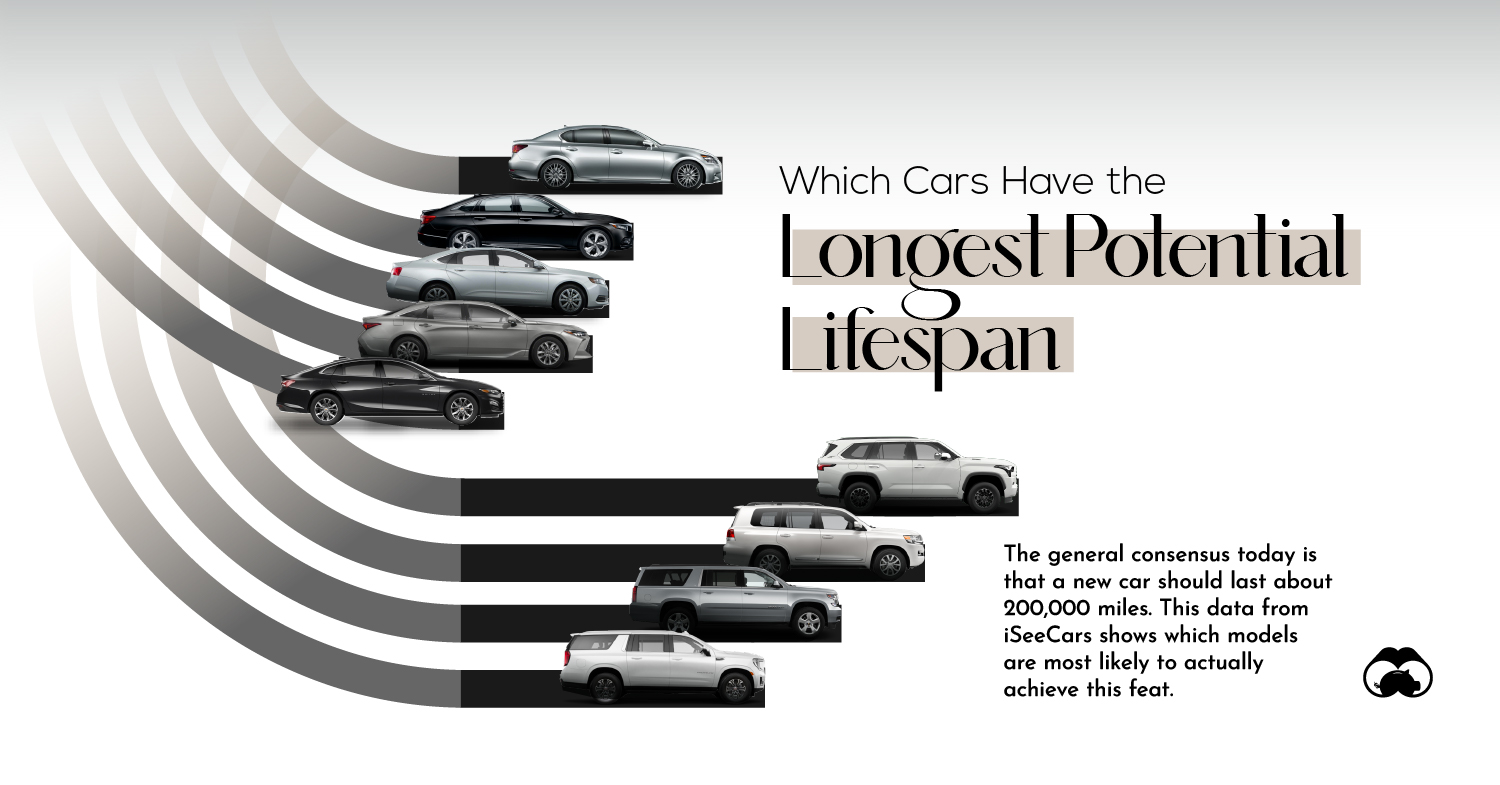
While that case may be an extreme outlier, most modern cars are expected to last 200,000 miles before experiencing some significant failure. That’s roughly double the lifespan of cars from the 1960s and 1970s, which typically lasted about 100,000 miles.
In this infographic, we used data from iSeeCars to determine which cars are the most likely to reach— or even surpass—the 200,000 mile benchmark.
Study Methodology & Data
To come up with their rankings, iSeeCars analyzed over 2 million used cars between January and October 2022. The rankings are based on the mileage that the top 1% of cars within each model obtained. Models with less than 10 years of production, such as the Tesla Model 3, were excluded.
The following tables show an expanded list of the longest lasting cars, by model category. Our infographic only includes the top five from each.
Sedans & Hatchbacks
The only non-Japanese model in the top 10 is the Chevrolet Impala, which is one of the most commonly found rental cars in the U.S.
| Rank | Vehicle | Potential Lifespan (miles) |
|---|---|---|
| 1 | 🇯🇵 Toyota Avalon | 245,710 |
| 2 | 🇺🇸 Chevrolet Impala | 230,343 |
| 3 | 🇯🇵 Honda Accord | 226,168 |
| 4 | 🇯🇵 Toyota Camry | 223,249 |
| 5 | 🇯🇵 Lexus GS 350 | 207,794 |
| 6 | 🇯🇵 Honda Fit | 207,231 |
| 7 | 🇯🇵 Honda Civic | 205,335 |
| 8 | 🇯🇵 Lexus ES 350 | 204,642 |
| 9 | 🇯🇵 Toyota Corolla | 204,266 |
| 10 | 🇯🇵 Mazda 6 | 203,154 |
Another interesting takeaway is that Lexus is the only luxury brand in this list. This is likely due to the fact that Lexus and Toyota often share drivetrain components.
SUVs
iSeeCars has a larger top 20 list for the SUV category.
| Rank | Vehicle | Potential Lifespan |
|---|---|---|
| 1 | 🇯🇵 Toyota Sequoia | 296,509 |
| 2 | 🇯🇵 Toyota Land Cruiser | 280,236 |
| 3 | 🇺🇸 Chevrolet Suburban | 265,732 |
| 4 | 🇺🇸 GMC Yukon XL | 252,360 |
| 5 | 🇺🇸 Chevrolet Tahoe | 250,338 |
| 6 | 🇯🇵 Toyota Highlander Hybrid | 244,994 |
| 7 | 🇺🇸 Ford Expedition | 244,682 |
| 8 | 🇯🇵 Toyota 4Runner | 244,665 |
| 9 | 🇺🇸 GMC Yukon | 238,956 |
| 10 | 🇯🇵 Honda Pilot | 236,807 |
| 11 | 🇯🇵 Acura MDX | 228,472 |
| 12 | 🇺🇸 Cadillac Escalade ESV | 228,449 |
| 13 | 🇺🇸 Cadillac Escalade | 224,782 |
| 14 | 🇺🇸 Lincoln Navigator | 220,319 |
| 15 | 🇯🇵 Nissan Armada | 220,172 |
| 16 | 🇯🇵 Toyota Highlander | 218,075 |
| 17 | 🇯🇵 Honda CR-V | 215,930 |
| 18 | 🇺🇸 Lincoln Navigator L | 214,341 |
| 19 | 🇯🇵 Subaru Outback | 208,298 |
| 20 | 🇰🇷 Hyundai Santa Fe | 206,398 |
This is a more diverse list, with American and Japanese models seemingly on par. The GM family of SUVs (Tahoe, Suburban, Yukon, and Yukon XL) are narrowly edged out by Toyota’s full size options (Sequoia and Land Cruiser).
The Land Cruiser was discontinued in the U.S. for 2021, but it remains a very popular model in Middle Eastern countries like Bahrain, Qatar, and the UAE.
Pickup Trucks
Once again, Japanese manufacturers hold the top spots. According to Toyota, the Tundra is the only full-size pickup that is currently being built in Texas.
| Rank | Vehicle | Potential Lifespan |
|---|---|---|
| 1 | 🇯🇵 Toyota Tundra | 256,022 |
| 2 | 🇯🇵 Honda Ridgeline | 248,669 |
| 3 | 🇯🇵 Toyota Tacoma | 235,070 |
| 4 | 🇯🇵 Nissan Titan | 233,295 |
| 5 | 🇺🇸 Ford F-150 | 232,650 |
| 6 | 🇺🇸 Chevrolet Silverado 1500 | 230,515 |
| 7 | 🇺🇸 GMC Sierra 1500 | 222,691 |
| 8 | 🇺🇸 Ford Ranger | 220,980 |
| 9 | 🇯🇵 Nissan Frontier | 215,775 |
| 10 | 🇺🇸 Ram 1500 | 215,521 |
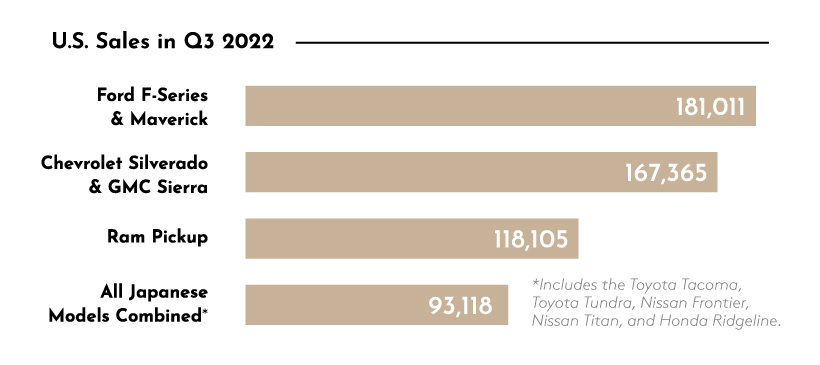
Despite their marginally higher potential lifespans, sales of Japanese trucks come nowhere close to their American counterparts.
Electric Cars
The last category is EVs, which due to the 10 years of production requirement, only includes the Tesla Model S (133,998 miles) and Nissan LEAF (98,081).
These figures are much lower than the gasoline cars discussed above, but it’s not exactly a fair comparison. We probably won’t be able to judge the long-term reliability of EVs until they’ve been around for at least another decade.
In addition to needing more time, another reason is scale—the Model S and LEAF have been sold in relatively limited numbers. The Tesla Model 3, which is the first EV to sell over one million units, will likely become the first reliable benchmark.


Misc
How Hard Is It to Get Into an Ivy League School?
We detail the admission rates and average annual cost for Ivy League schools, as well as the median SAT scores required to be accepted.


How Hard Is It to Get Into an Ivy League School?
This was originally posted on our Voronoi app. Download the app for free on iOS or Android and discover incredible data-driven charts from a variety of trusted sources.
Ivy League institutions are renowned worldwide for their academic excellence and long-standing traditions. But how hard is it to get into one of the top universities in the U.S.?
In this graphic, we detail the admission rates and average annual cost for Ivy League schools, as well as the median SAT scores required to be accepted. The data comes from the National Center for Education Statistics and was compiled by 24/7 Wall St.
Note that “average annual cost” represents the net price a student pays after subtracting the average value of grants and/or scholarships received.
Harvard is the Most Selective
The SAT is a standardized test commonly used for college admissions in the United States. It’s taken by high school juniors and seniors to assess their readiness for college-level academic work.
When comparing SAT scores, Harvard and Dartmouth are among the most challenging universities to gain admission to. The median SAT scores for their students are 760 for reading and writing and 790 for math. Still, Harvard has half the admission rate (3.2%) compared to Dartmouth (6.4%).
| School | Admission rate (%) | SAT Score: Reading & Writing | SAT Score: Math | Avg Annual Cost* |
|---|---|---|---|---|
| Harvard University | 3.2 | 760 | 790 | $13,259 |
| Columbia University | 3.9 | 750 | 780 | $12,836 |
| Yale University | 4.6 | 760 | 780 | $16,341 |
| Brown University | 5.1 | 760 | 780 | $26,308 |
| Princeton University | 5.7 | 760 | 780 | $11,080 |
| Dartmouth College | 6.4 | 760 | 790 | $33,023 |
| University of Pennsylvania | 6.5 | 750 | 790 | $14,851 |
| Cornell University | 7.5 | 750 | 780 | $29,011 |
*Costs after receiving federal financial aid.
Additionally, Dartmouth has the highest average annual cost at $33,000. Princeton has the lowest at $11,100.
While student debt has surged in the United States in recent years, hitting $1.73 trillion in 2023, the worth of obtaining a degree from any of the schools listed surpasses mere academics. This is evidenced by the substantial incomes earned by former students.
Harvard grads, for example, have the highest average starting salary in the country, at $91,700.

-

 Markets2 weeks ago
Visualizing America’s Shortage of Affordable Homes
-

 Technology1 week ago
Ranked: Semiconductor Companies by Industry Revenue Share
-

 Money1 week ago
Which States Have the Highest Minimum Wage in America?
-

 Real Estate1 week ago
Ranked: The Most Valuable Housing Markets in America
-

 Business2 weeks ago
Charted: Big Four Market Share by S&P 500 Audits
-

 AI2 weeks ago
The Stock Performance of U.S. Chipmakers So Far in 2024
-

 Automotive2 weeks ago
Almost Every EV Stock is Down After Q1 2024
-

 Money2 weeks ago
Where Does One U.S. Tax Dollar Go?