Environment
Visualizing the Human Impact on the Ocean Economy


Visualizing the Human Impact on our Ocean Economy
When you think of economic output, it’s likely the ocean isn’t the first entity that comes to mind. But from facilitating international trade to regulating the climate, the “blue economy” contributes significant value in both tangible and intangible ways.
The sustainable use of the ocean and its resources for economic development and livelihoods have such far-reaching effects, that its protection is a significant goal of the United Nations, as well as for many other countries and organizations throughout the world.
However, these vital ocean assets are in danger of sinking quickly. Ahead of World Oceans Day on June 8, 2020, we look at the total value of assets that come from our ocean, and how various human activities are affecting these resources.
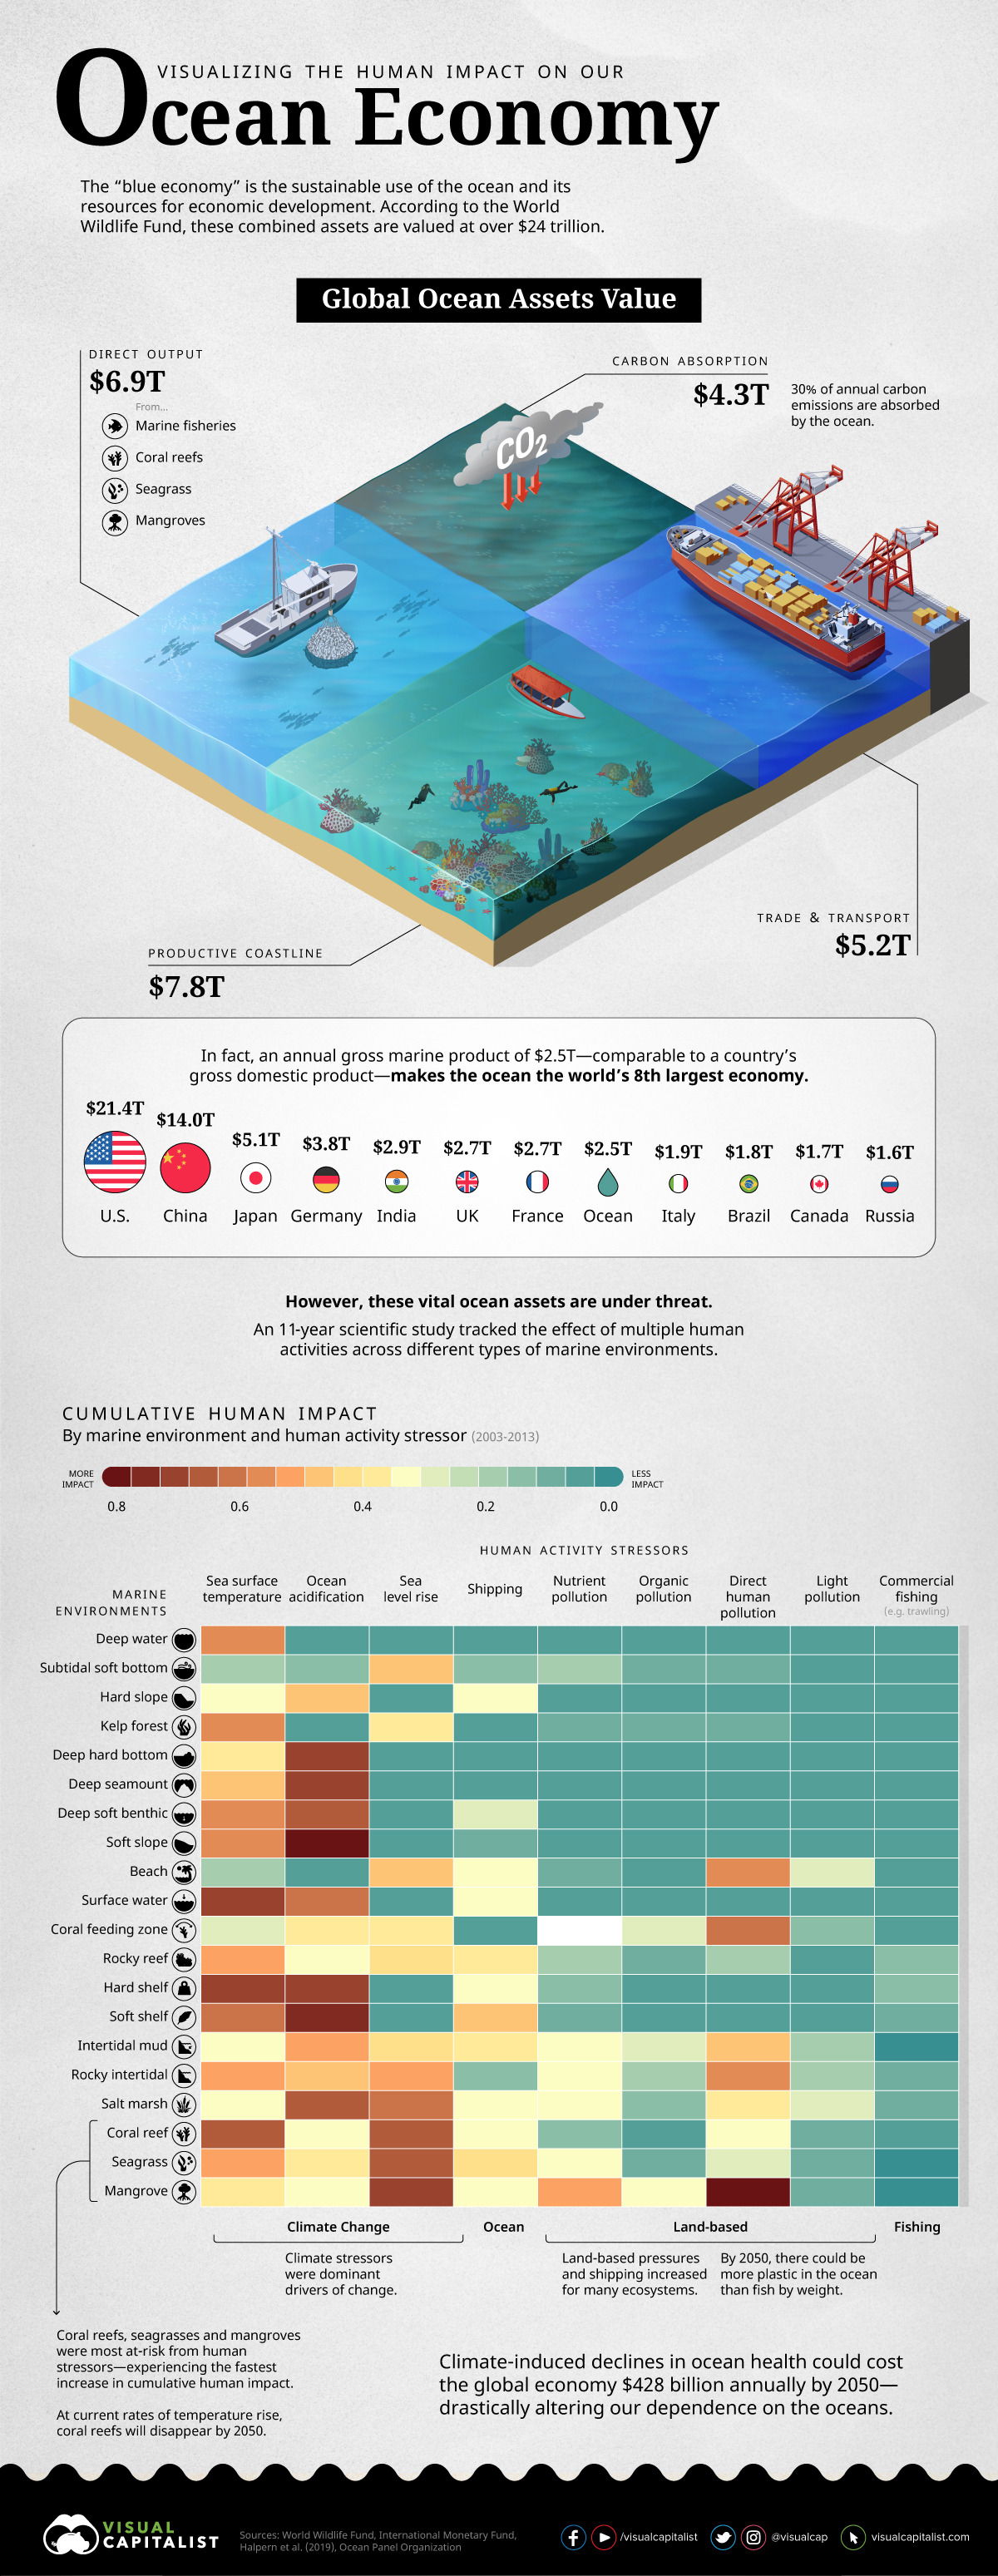
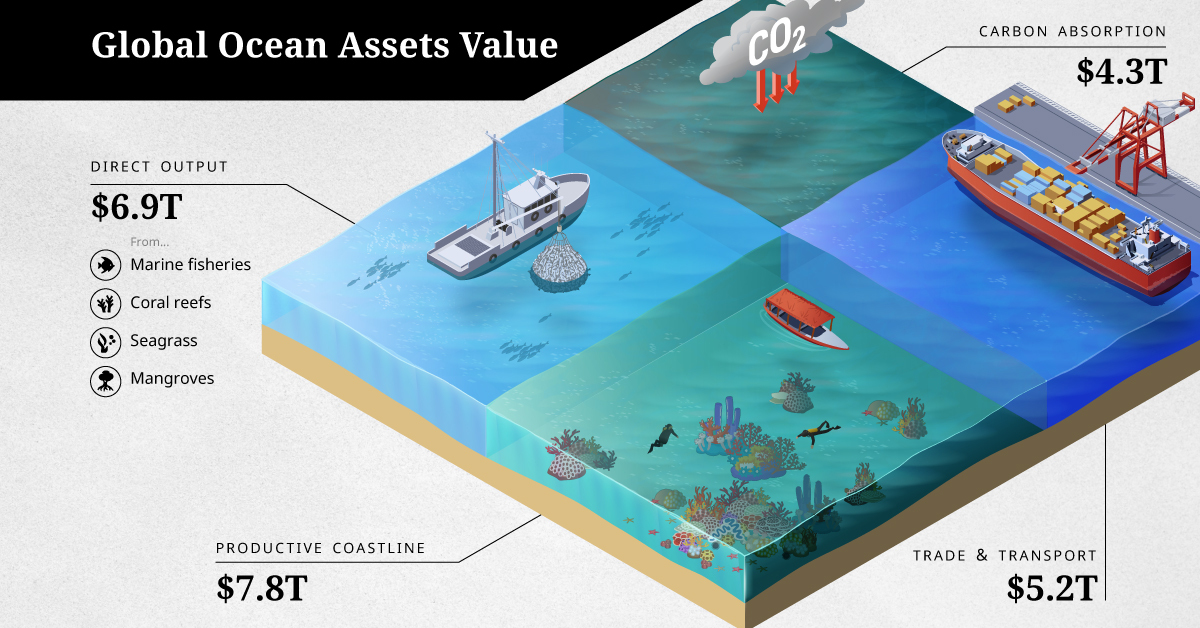
Global Ocean Asset Value
Economic value from all the oceans is measured both by their direct output, as well as any indirect impacts they produce.
According to the World Wildlife Fund, these combined assets are valued at over $24 trillion. Here’s how they break down:
- Direct Output: Marine fisheries, coral reefs, seagrass, and mangroves
Total value: $6.9T
Examples of direct output: Fishing, agriculture - Trade and Transport: Shipping lanes
Total value: $5.2T - Adjacent Assets: Productive coastline, carbon absorption
Total value: $7.8T, and $4.3T respectively
Examples of services enabled: Tourism, education/conservation (such as jobs created)
In fact, the annual gross marine product of the oceans is comparable to the Gross Domestic Product (GDP) of countries, coming in at $2.5 trillion per year—making it the world’s eighth largest economy in country terms.
Unfortunately, experts warn that various human activities are endangering these ocean assets and their reliant ecosystems.
The Cumulative Human Impact on Oceans
An 11-year long scientific study tracked the global effect of multiple human activities across diverse marine environments. The researchers identified four main categories of stressors between 2003-2013.
- Climate change: Sea surface temperature, ocean acidification, and sea level rise
- Ocean: Shipping
- Land-based: Nutrient pollution, organic chemical pollution, direct human pollution, light pollution
- Fishing: Commercial and artisanal fishing, including trawling methods
Across the board, climate stressors were the most dominant drivers of change in a majority of marine environments. Similarly, pollution levels have also increased for many ecosystems.
Plastic pollution is especially damaging, as it continues to grow at unprecedented rates, with a significant amount ending up in the oceans. The World Economic Forum estimates that by 2050, there could be more plastic in the ocean than fish by weight.
Among the various marine environments, coral reefs, seagrasses, and mangroves proved to be most at-risk, experiencing the fastest increase in cumulative human impact. However, these are also the same ecosystems that we rely on for their direct economic output.
Overall, climate-induced declines in ocean health could cost the global economy $428 billion annually by 2050.
The Ocean Economy is in Hot Water
It can be difficult to truly understand the scale at which we rely on the ocean for climate regulation. The ocean is a major “carbon sink”, absorbing nearly 30% of the carbon emitted by human activity. But acidity levels and rising sea surface temperatures are changing its chemistry, and reducing its ability to dissolve CO₂.
According to the UN, ocean acidification has grown by 26% since pre-industrial times. At our current rates, it could rise to 100-150% by the end of the century. Overfishing is another urgent threat that shows no signs of slowing down, with sustainable fish stocks declining from 90% to 66.9% in just over 40 years.
To try and counteract these issues, this year’s virtual World Oceans Day is focused on “Innovation for a Sustainable Oceans” to discuss various solutions, including how the private sector can work with communities to maintain the blue economy. In addition, there’s a petition in place to urge world leaders to help protect 30% of the natural world by 2030.
Will our human activities continue to stress the ocean economy, or will we be able to positively reverse these trends in the years to come?


Green
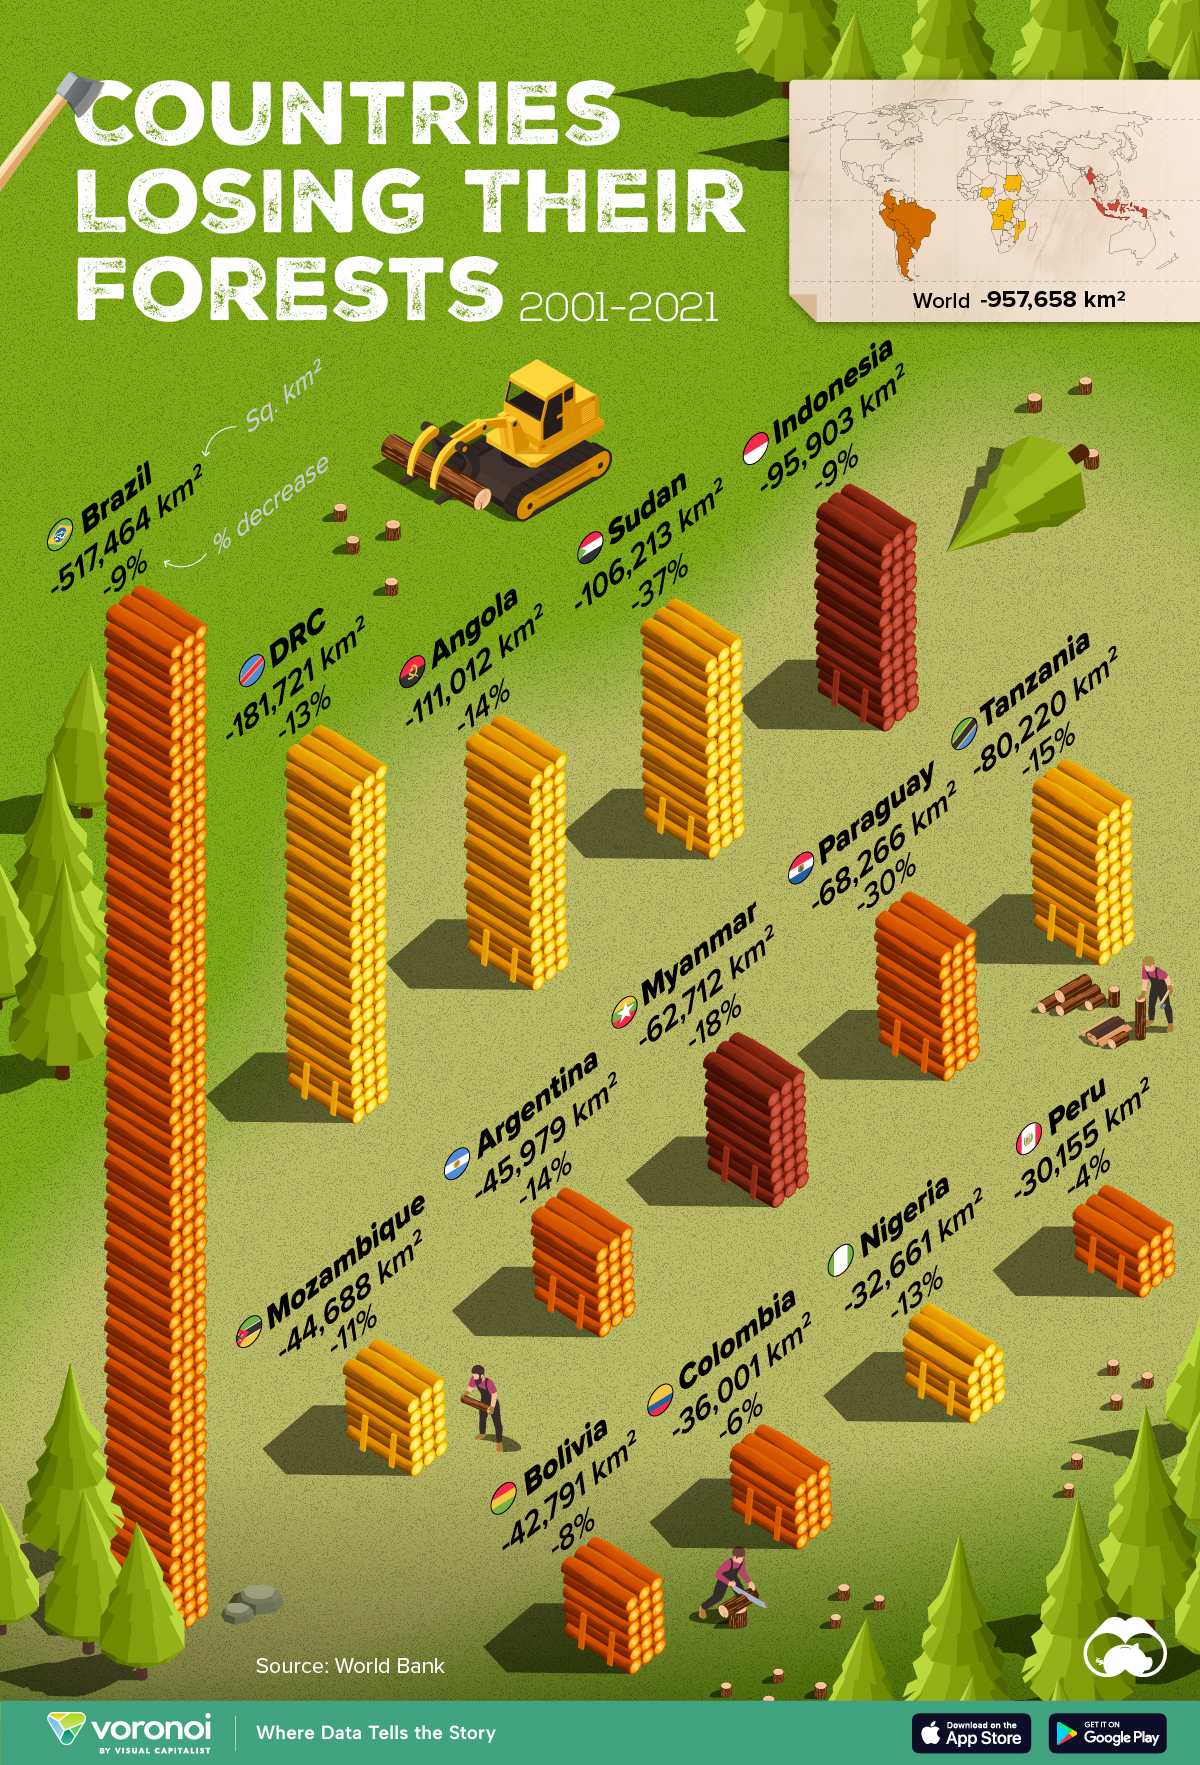
Ranked: Top Countries by Total Forest Loss Since 2001
The country with the most forest loss since 2001 lost as much forest cover as the next four countries combined.
Ranked: Top Countries By Total Forest Loss Since 2001
This was originally posted on our Voronoi app. Download the app for free on iOS or Android and discover incredible data-driven charts from a variety of trusted sources.
Forests are critical natural resources, often caught in the crosshairs of economic development. Thanks to expanding human settlement, agriculture, and industry, the world lost nearly 1 million square kilometers (km²) of forest cover since 2001.
But where has most of this deforestation occurred?
We rank the countries by the total decrease in their forest area between 2001 and 2021, measured in square kilometers along with their percentage decrease for context. All of this data was sourced from the World Bank.
A caveat to this data: countries are ranked by total forest loss, so countries with the largest forests feature predominantly on this list.
Which Country Has Lost the Most Forests (2001-2021)?
Brazil has lost more than half a million square kilometers of forest in the last two decades. Agricultural expansion for beef and soy production alongside mining and infrastructure growth are the primary drivers behind this large scale deforestation.
This has also caused periodic fires in the Amazon rainforest, drawing repeated alarm from around the world. In fact, Brazil has lost as much forest cover as the next four countries combined.
The table below lists the countries included in this graphic, as well as several others further down the ranking.
| Rank | Country | Region | 2001–21 Change (in km2) | % of Forest Loss |
|---|---|---|---|---|
| 1 | 🇧🇷 Brazil | South America | -517,464 | -9% |
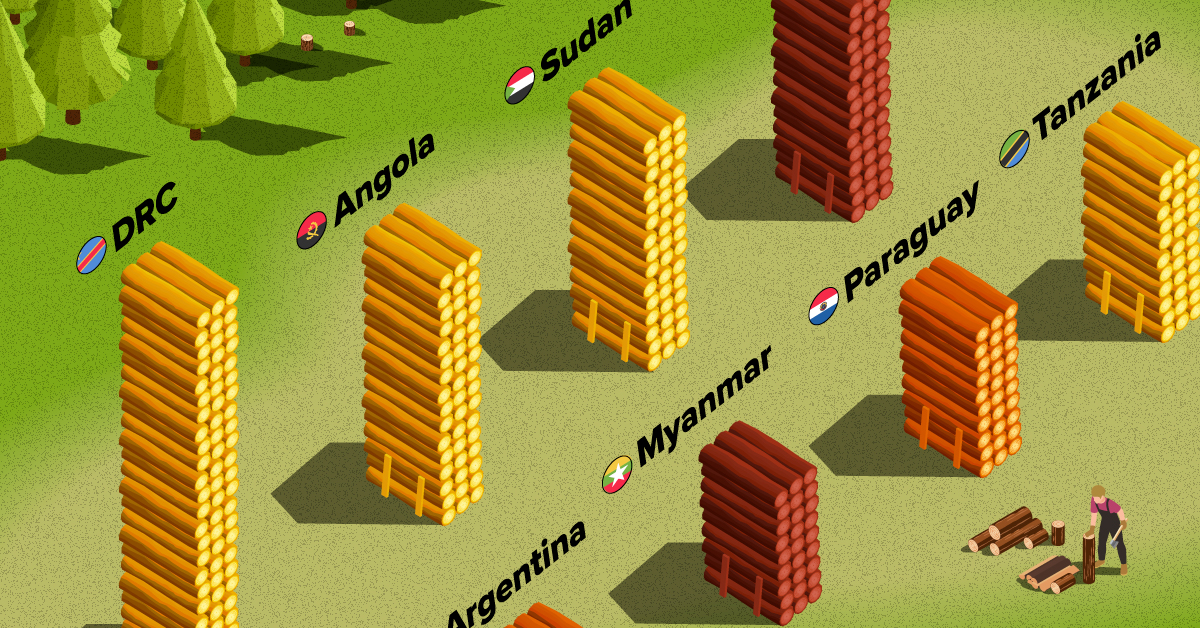
| 2 | 🇨🇩 DRC | Africa | -181,721 | -13% |
| 3 | 🇦🇴 Angola | Africa | -111,012 | -14% |
| 4 | 🇸🇩 Sudan | Africa | -106,213 | -37% |
| 5 | 🇮🇩 Indonesia | Asia | -95,903 | -9% |
| 6 | 🇹🇿 Tanzania | Africa | -80,220 | -15% |
| 7 | 🇵🇾 Paraguay | South America | -68,266 | -30% |
| 8 | 🇲🇲 Myanmar | Asia | -62,712 | -18% |
| 9 | 🇦🇷 Argentina | South America | -45,979 | -14% |
| 10 | 🇲🇿 Mozambique | Africa | -44,688 | -11% |
| 11 | 🇧🇴 Bolivia | South America | -42,791 | -8% |
| 12 | 🇨🇴 Colombia | South America | -36,001 | -6% |
| 13 | 🇳🇬 Nigeria | Africa | -32,661 | -13% |
| 14 | 🇵🇪 Peru | South America | -30,155 | -4% |
| 15 | 🇰🇭 Cambodia | Asia | -28,491 | -26% |
| 16 | 🇻🇪 Venezuela | South America | -28,130 | -6% |
| 17 | 🇲🇽 Mexico | North America | -26,732 | -4% |
| 18 | 🇿🇲 Zambia | Africa | -23,924 | -5% |
| 19 | 🇧🇼 Botswana | Africa | -23,660 | -14% |
| 20 | 🇨🇮 Cote d'Ivoire | Africa | -22,577 | -45% |
What is quickly apparent is how most of the countries on this list are from Africa and South America. A study found a correlation where developing economies tend to have higher deforestation rates than advanced economies. Former colonies have also experienced more forest loss than those that were not colonized.
In Asia, Indonesia’s burgeoning palm oil industry is a key driver to deforestation, though efforts are now being made to reverse its impact. Meanwhile, Cambodia experienced rapid clear-cutting for its growing rubber plantations and timber industry.
Finally, Myanmar has long contended with illegal logging, but the country’s ongoing civil war is styming conversation efforts.

-

 Green2 weeks ago
Ranked: Top Countries by Total Forest Loss Since 2001
-

 Travel1 week ago
Ranked: The World’s Top Flight Routes, by Revenue
-

 Technology1 week ago
Ranked: Semiconductor Companies by Industry Revenue Share
-

 Money2 weeks ago
Which States Have the Highest Minimum Wage in America?
-

 Real Estate2 weeks ago
Ranked: The Most Valuable Housing Markets in America
-

 Markets2 weeks ago
Charted: Big Four Market Share by S&P 500 Audits
-

 AI2 weeks ago
The Stock Performance of U.S. Chipmakers So Far in 2024
-

 Automotive2 weeks ago
Almost Every EV Stock is Down After Q1 2024