Energy
How Much Solar Energy is Consumed Per Capita? (1965-2019)
Press play above to watch how per capita solar energy consumption increases over 54 years.
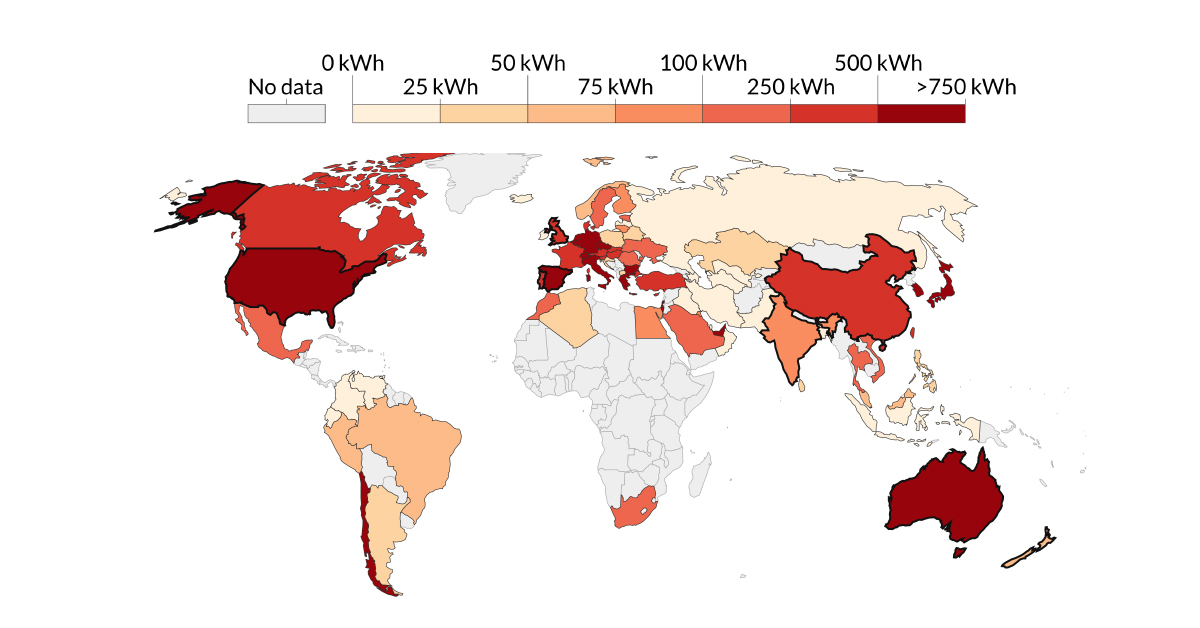
How Much Solar Energy is Consumed Per Capita?
The long history of solar energy use dates as far back as 4,000 B.C.—when ancient civilizations would use solar architecture to design dwellings that would use more of the sun’s warmth in the winter, while reducing excess heat in the summer.
But despite its long history, we’ve only recently started to rely on solar energy as a renewable power source. This Our World in Data visualization pulls data from BP’s Statistical Review of World Energy to highlight how solar energy consumption per capita has grown in countries around the world over 54 years.
Solar Success: The Top Consumers Per Capita
Solar energy consumption is measured in kilowatt hours (kWh)—and as of the latest estimates, Australia leads the world in terms of highest solar energy consumption per capita at 1,764 kWh in 2019. A combination of factors help achieve this:
- Optimal weather conditions
- High gross domestic product (GDP) per capita
- Tariffs incentivizing the shift to solar
In fact, government subsidies such as financial assistance with installation and feed-in tariffs help bring down the costs of residential solar systems to a mere AUD$1 (US$0.70) per watt.
| Rank | Country | Solar consumption per capita (kWh, 2019) | Solar’s share of total (per capita consumption) |
|---|---|---|---|
| #1 | 🇦🇺 Australia | 1,764 | 2.50% |
| #2 | 🇯🇵 Japan | 1,469 | 3.59% |
| #3 | 🇩🇪 Germany | 1,409 | 3.22% |
| #4 | 🇦🇪 UAE | 1,056 | 0.77% |
| #5 | 🇮🇹 Italy | 995 | 3.40% |
| #6 | 🇬🇷 Greece | 936 | 3.08% |
| #7 | 🇧🇪 Belgium | 847 | 1.30% |
| #8 | 🇨🇱 Chile | 823 | 3.39% |
| #9 | 🇺🇸 U.S. | 815 | 1.02% |
| #10 | 🇪🇸 Spain | 797 | 2.34% |
Source: Our World in Data, BP Statistical Review of World Energy 2020
Note that some conversions have been made for primary energy consumption values from Gigajoules (GJ) to kWh.
Coming in second place, Japan has the highest share of solar (3.59%) compared to its total primary energy consumption per capita. After the Fukushima nuclear disaster in 2011, the nation made plans to double its renewable energy use by 2030.
Japan has achieved its present high rates of solar energy use through creative means, from repurposing abandoned golf courses to building floating “solar islands”.
Solar Laggards: The Bottom Consumers Per Capita
On the flip side, several countries that lag behind on solar use are heavily reliant on fossil fuels. These include several members of OPEC—Iraq, Iran, and Venezuela—and former member state Indonesia.
This reliance may also explain why, despite being located in regions that receive the most annual “sunshine hours” in the world, this significant solar potential is yet unrealized.
| Rank | Country | Solar consumption per capita (kWh, 2019) | Primary energy consumption per capita (kWh, 2019) |
|---|---|---|---|
| #1 | 🇮🇸 Iceland | 0 | No data available |
| #2 | 🇱🇻 Latvia | 0 | No data available |
| #3 | 🇮🇩 Indonesia | <1 | 9,140 |
| #4 | 🇺🇿 Uzbekistan | <1 | 15,029 |
| #5 | 🇭🇰 Hong Kong | <1 | 46,365 |
| #6 | 🇻🇪 Venezuela | 1 | 21,696 |
| #7 | 🇴🇲 Oman | 2 | 84,535 |
| #8 | 🇹🇲 Turkmenistan | 3 | 67,672 |
| #9 | 🇮🇶 Iraq | 4 | 15,723 |
| #10 | 🇮🇷 Iran | 5 | 41,364 |
Source: Our World in Data, BP Statistical Review of World Energy 2020
Note that some conversions have been made for primary energy consumption values from Gigajoules (GJ) to kWh.
Interestingly, Iceland is on this list for a different reason. Although the country still relies on renewable energy, it gets this from different sources than solar—a significant share comes from hydropower as well as geothermal power.
The Future of Solar
One thing the visualization above makes clear is that solar’s impact on the global energy mix has only just begun. As the costs associated with producing solar power continue to fall, we’re on a steady track to transform solar energy into a more significant means of generating power.
All in all, with the world’s projected energy mix from total renewables set to increase over 300% by 2040, solar energy is on a rising trend upwards.


Lithium
Ranked: The Top 10 EV Battery Manufacturers in 2023
Asia dominates this ranking of the world’s largest EV battery manufacturers in 2023.


The Top 10 EV Battery Manufacturers in 2023
This was originally posted on our Voronoi app. Download the app for free on iOS or Android and discover incredible data-driven charts from a variety of trusted sources.
Despite efforts from the U.S. and EU to secure local domestic supply, all major EV battery manufacturers remain based in Asia.
In this graphic we rank the top 10 EV battery manufacturers by total battery deployment (measured in megawatt-hours) in 2023. The data is from EV Volumes.
Chinese Dominance
Contemporary Amperex Technology Co. Limited (CATL) has swiftly risen in less than a decade to claim the title of the largest global battery group.
The Chinese company now has a 34% share of the market and supplies batteries to a range of made-in-China vehicles, including the Tesla Model Y, SAIC’s MG4/Mulan, and various Li Auto models.
| Company | Country | 2023 Production (megawatt-hour) | Share of Total Production |
|---|---|---|---|
| CATL | 🇨🇳 China | 242,700 | 34% |
| BYD | 🇨🇳 China | 115,917 | 16% |
| LG Energy Solution | 🇰🇷 Korea | 108,487 | 15% |
| Panasonic | 🇯🇵 Japan | 56,560 | 8% |
| SK On | 🇰🇷 Korea | 40,711 | 6% |
| Samsung SDI | 🇰🇷 Korea | 35,703 | 5% |
| CALB | 🇨🇳 China | 23,493 | 3% |
| Farasis Energy | 🇨🇳 China | 16,527 | 2% |
| Envision AESC | 🇨🇳 China | 8,342 | 1% |
| Sunwoda | 🇨🇳 China | 6,979 | 1% |
| Other | - | 56,040 | 8% |
In 2023, BYD surpassed LG Energy Solution to claim second place. This was driven by demand from its own models and growth in third-party deals, including providing batteries for the made-in-Germany Tesla Model Y, Toyota bZ3, Changan UNI-V, Venucia V-Online, as well as several Haval and FAW models.
The top three battery makers (CATL, BYD, LG) collectively account for two-thirds (66%) of total battery deployment.
Once a leader in the EV battery business, Panasonic now holds the fourth position with an 8% market share, down from 9% last year. With its main client, Tesla, now sourcing batteries from multiple suppliers, the Japanese battery maker seems to be losing its competitive edge in the industry.
Overall, the global EV battery market size is projected to grow from $49 billion in 2022 to $98 billion by 2029, according to Fortune Business Insights.

-

 Travel1 week ago
Airline Incidents: How Do Boeing and Airbus Compare?
-

 Markets2 weeks ago
Visualizing America’s Shortage of Affordable Homes
-

 Green2 weeks ago
Ranked: Top Countries by Total Forest Loss Since 2001
-

 Money2 weeks ago
Where Does One U.S. Tax Dollar Go?
-

 Misc2 weeks ago
Almost Every EV Stock is Down After Q1 2024
-

 AI2 weeks ago
The Stock Performance of U.S. Chipmakers So Far in 2024
-

 Markets2 weeks ago
Charted: Big Four Market Share by S&P 500 Audits
-

 Real Estate2 weeks ago
Ranked: The Most Valuable Housing Markets in America