Markets
Ranked: Which NBA Team Takes Home the Most Revenue?
![]() See this visualization first on the Voronoi app.
See this visualization first on the Voronoi app.
Which NBA Team Takes Home the Most Revenues?
This was originally posted on our Voronoi app. Download the app for free on iOS or Android and discover incredible data-driven charts from a variety of trusted sources.
The NBA is projected to earn $13 billion in revenue this year before revenue sharing and debt payments, a 11% jump from last season, driving NBA team valuations even higher.
Since 2005, NBA team valuations have increased faster than any other major U.S. league by a wide margin. For perspective, the rise in their combined valuation has exceeded growth in the S&P 500 by more than threefold during this time period.
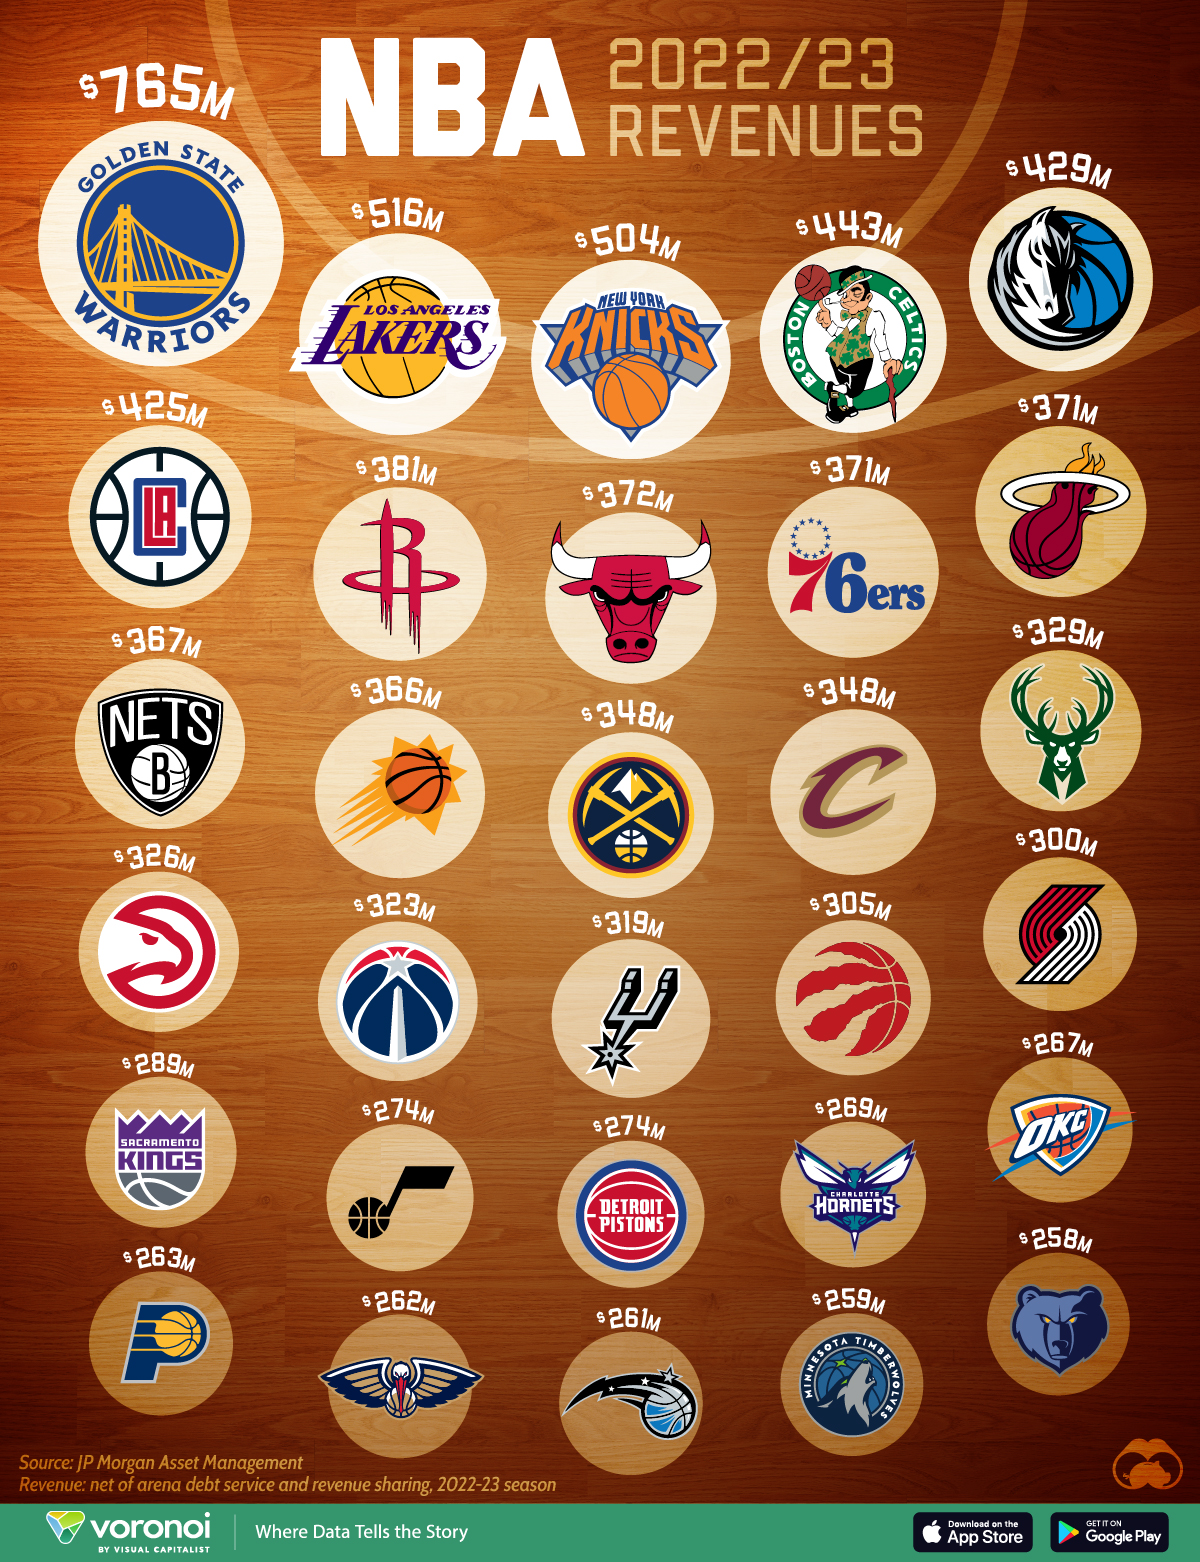
This graphic shows the top NBA teams by revenue, based on data from JP Morgan Asset Management.
Ranked: The Highest-Earning NBA Teams
Below, we show the revenue of all 30 NBA teams as of the 2022-2023 season:
| Ranking | Team | 2022-2023 Season Revenue | Valuation |
|---|---|---|---|
| 1 | Golden State Warriors | $765M | $7.7B |
| 2 | Los Angeles Lakers | $516M | $6.4B |
| 3 | New York Knicks | $504M | $6.6B |
| 4 | Boston Celtics | $443M | $4.7B |
| 5 | Dallas Mavericks | $429M | $4.5B |
| 6 | Los Angeles Clippers | $425M | $4.7B |
| 7 | Houston Rockets | $381M | $4.4B |
| 8 | Chicago Bulls | $372M | $4.6B |
| 9 | Philadelphia 76ers | $371M | $4.3B |
| 10 | Miami Heat | $371M | $3.9B |
| 11 | Brooklyn Nets | $367M | $3.9B |
| 12 | Phoenix Suns | $366M | $4.0B |
| 13 | Denver Nuggets | $348M | $3.4B |
| 14 | Cleveland Cavaliers | $348M | $3.4B |
| 15 | Milwaukee Bucks | $329M | $3.2B |
| 16 | Atlanta Hawks | $326M | $3.3B |
| 17 | Washington Wizards | $323M | $3.5B |
| 18 | San Antonio Spurs | $319M | $3.3B |
| 19 | Toronto Raptors | $305M | $4.1B |
| 20 | Portland Trail Blazers | $300M | $3.1B |
| 21 | Sacramento Kings | $289M | $3.3B |
| 22 | Utah Jazz | $274M | $3.1B |
| 23 | Detroit Pistons | $274M | $3.1B |
| 24 | Charlotte Hornets | $269M | $3.0B |
| 25 | Oklahoma City Thunder | $267M | $3.1B |
| 26 | Indiana Pacers | $263M | $2.9B |
| 27 | New Orleans Pelicans | $262M | $2.6B |
| 28 | Orlando Magic | $261M | $3.0B |
| 29 | Minnesota Timberwolves | $259M | $2.5B |
| 30 | Memphis Grizzlies | $258M | $2.4B |
Revenue figures are net of arena debt service and revenue sharing
With $765 million in revenue, the Golden State Warriors are the highest-earning team in the league, thanks to the stellar performances of all-star players Klay Thompson, Stephen Curry, and Draymond Green.
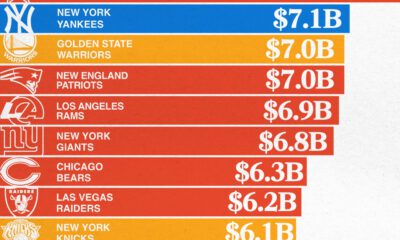
These players were instrumental in driving the valuation of the franchise, which grew from $1.5 billion in 2015 to a remarkable $7.7 billion in 2023. At this valuation, the Golden State Warriors are the second-most valuable sports team in America, following after the $9 billion Dallas Cowboys NFL franchise. Since 2010, the Warriors’ revenue has increased by sevenfold.
Not only did the team have the highest NBA TV ratings in seven of the last eight years as of last season, the Warriors have the largest social media following across U.S. sport franchises, including 32.4 million Instagram followers. By comparison, the Lakers have 24.6 million followers. Adding to this, the team’s jersey patch deal with Rakuten is worth approximately $45 million per season alone.
Ranking in second are the Los Angeles Lakers, earning $516 million in revenue. Over the last decade, revenues have increased by 76% fueled by the star power of LeBron James and the team’s world-renowned brand. In 2021, the team signed a five-year $100 million jersey patch deal with Korean food brand, Bibigo, making it one of the most valuable in the league.
The New York Knicks are third in revenue with $504 million, followed by the 2023-24 season champions, the Boston Celtics with $443 million in the 2022-23 season and the Dallas Mavericks in fifth at $429 million.
How Do NBA Teams Earn Revenue?
Below, we show the primary sources of revenue for the National Basketball Association (NBA):
| Revenue Stream | 2022-2023 Season Revenue | Share of Revenues |
|---|---|---|
| National Revenue (Media/broadcast deals, merchandise, shared ticket revenue, other sponsorships) | $4.5B | 41% |
| Seating/Suites | $2.9B | 26% |
| Local Media | $1.4B | 13% |
| Team Sponsorships | $1.3B | 12% |
| Concessions/Parking/Other | $0.9B | 8% |
As we can see, national revenue makes up the league’s largest share, driven by broadcasting and streaming agreements with national providers.
Going forward, these contract values are set to grow substantially. Today, the league is negotiating broadcasting deals with Amazon, ESPN, and NBC worth an estimated $76 billion over 11 years—making the annual contract value 2.6 times higher than its current contract. With NBA viewership up 16% across ESPN and ABC compared to the 2021-2022 season, strong demand is driving bigger media deals. During the 2022-2023 season, average viewership reached 1.7 million per game across these outlets.
Ticket and suite sales, another key source of revenue, topped $2.9 billion over the 2022-2023 season. In some cases, courtside tickets cost upwards of $3,000 per seat, with a host of celebrities from Jack Nicholson to Kendall Jenner and Bad Bunny sitting close to the action.
Following next in line were local media deals, worth $1.4 billion, and team sponsorship deals, valued at $1.3 billion.


Markets
Which Countries Have the Highest Corporate Tax Rates in the G20?
Interestingly, BRICS members cover the spectrum of corporate tax rates in the G20 from highest (India, Brazil) to lowest (Russia).
Which Countries Have the Highest Corporate Tax Rates in G20?
This was originally posted on our Voronoi app. Download the app for free on iOS or Android and discover incredible data-driven charts from a variety of trusted sources.
In the wake of the 1999 Asian financial crisis, government representatives from the 20 largest economies in the world decided to informally gather to coordinate policy on trade. Thus began the G20.
Together the bloc accounts for more than 85% of the world economy and has been credited with unified policy action in response to world events.
However, despite this shared affiliation, this group is still made of fundamentally different economies with varied policies towards their business entities.
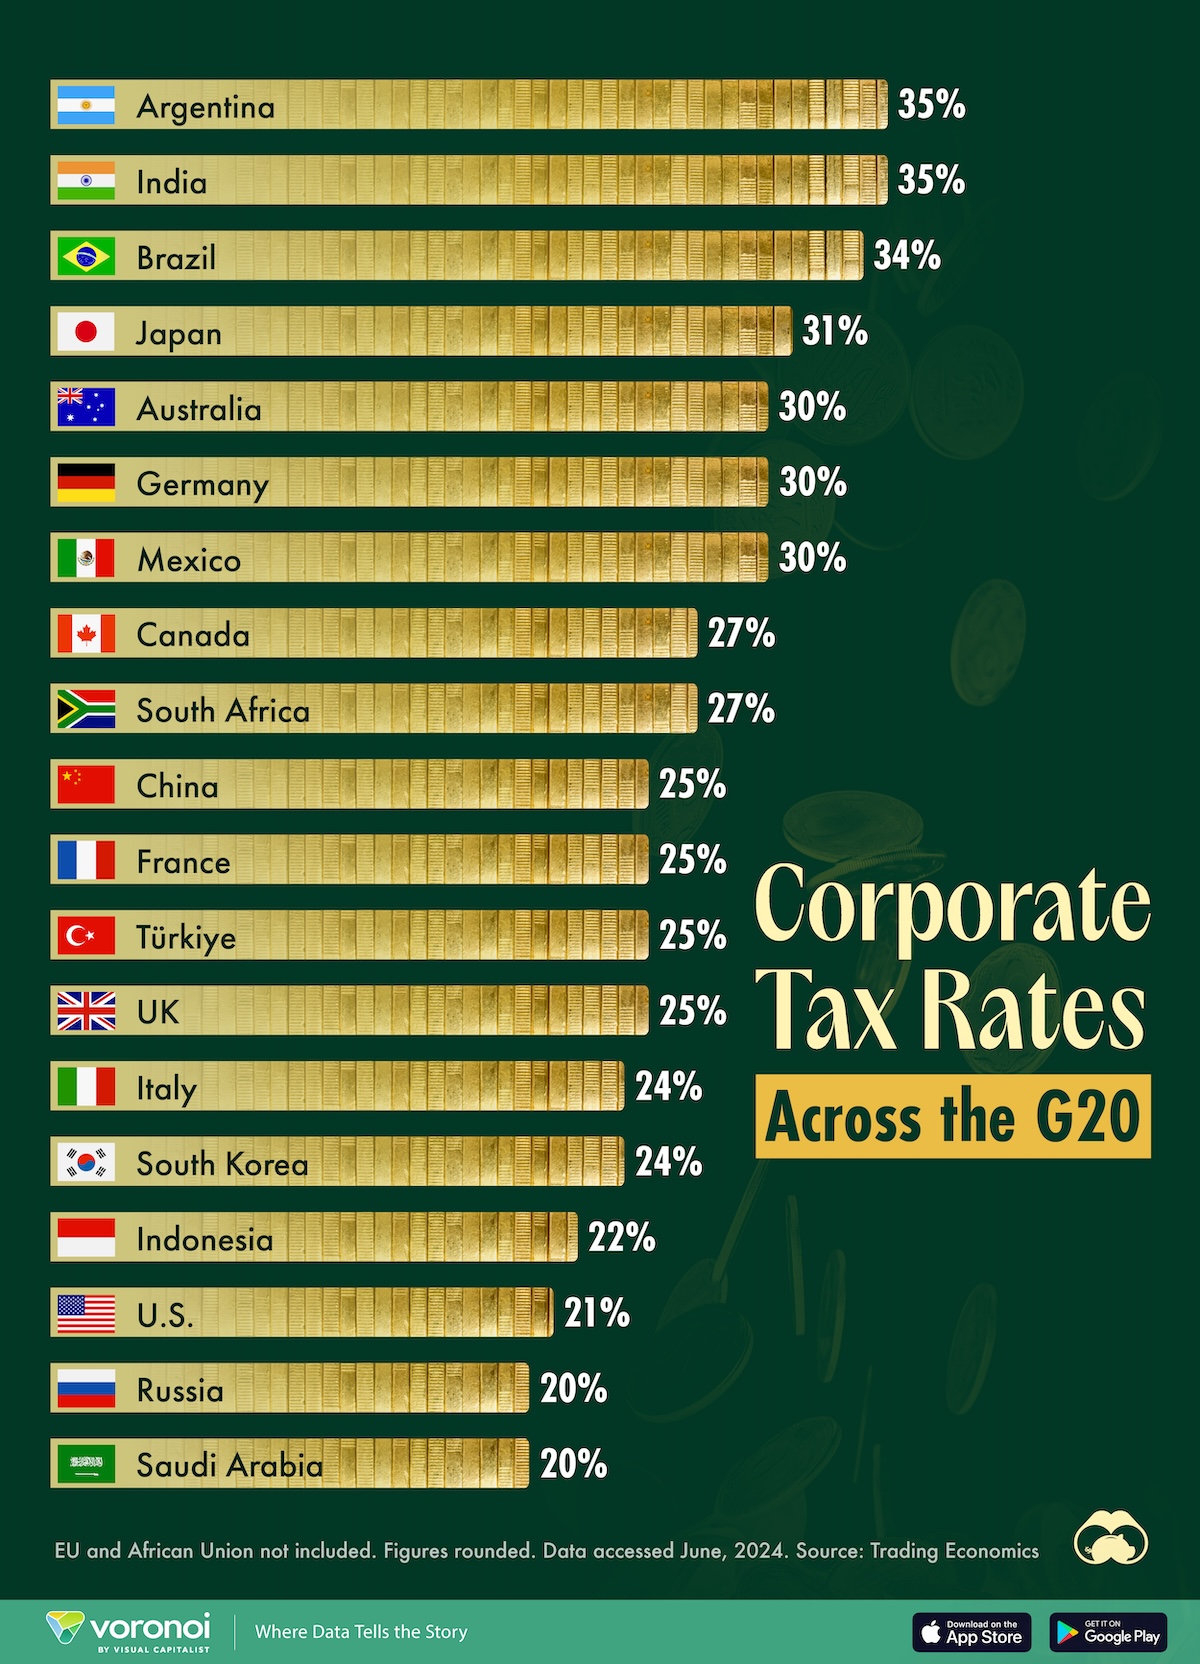
For a quick overview, we visualize and rank the G20 countries by their headline corporate tax rates. Data is sourced from Trading Economics, accessed June 2024. Data for the EU and the African Union (both G20 members) has not been included.
Ranked: G20 Members by Their Corporate Tax Rates
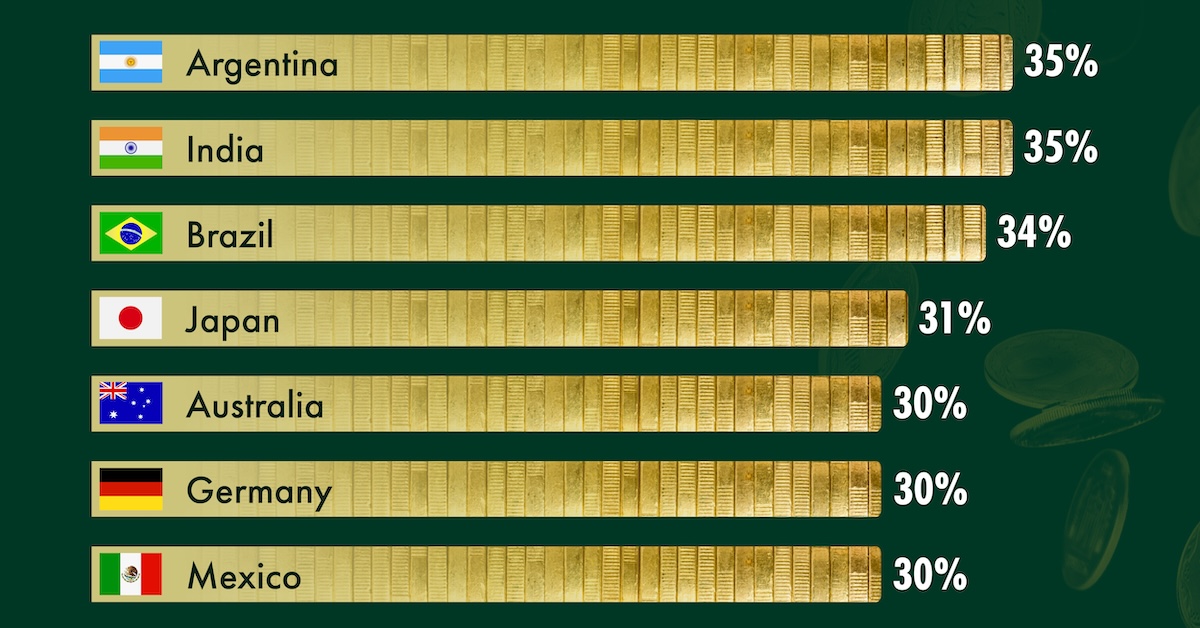
Argentina and India have the highest corporate income tax rates, at 35% in the G20.
However, both countries have a progressive ladder for taxation, so this headline number may only apply to a smaller subset of firms. For foreign companies with a “permanent entity” in India, the rate climbs past 40%.
| Rank | G20 Member | Corporate Tax Rate |
|---|---|---|
| 1 | 🇦🇷 Argentina | 35% |
| 2 | 🇮🇳 India | 35% |
| 3 | 🇧🇷 Brazil | 34% |
| 4 | 🇯🇵 Japan | 31% |
| 5 | 🇦🇺 Australia | 30% |
| 6 | 🇩🇪 Germany | 30% |
| 7 | 🇲🇽 Mexico | 30% |
| 8 | 🇨🇦 Canada | 27% |
| 9 | 🇿🇦 South Africa | 27% |
| 10 | 🇨🇳 China | 25% |
| 11 | 🇫🇷 France | 25% |
| 12 | 🇹🇷 Türkiye | 25% |
| 13 | 🇬🇧 UK | 25% |
| 14 | 🇮🇹 Italy | 24% |
| 15 | 🇰🇷 South Korea | 24% |
| 16 | 🇮🇩 Indonesia | 22% |
| 17 | 🇺🇸 U.S. | 21% |
| 18 | 🇷🇺 Russia | 20% |
| 19 | 🇸🇦 Saudi Arabia | 20% |
Note: EU and African Union not included. Figures rounded. Data accessed June 2024.
Interestingly, BRICS countries cover the spectrum of corporate tax rates. Starting from the highest (India, Brazil) to middle of the pack (South Africa, China) to lowest (Russia).
On the other hand, most of the G7 cluster in the mid-ranges (24–30%), with Japan the highest outlier (31%) and the U.S. the lowest exception (21%).
In fact, after Saudi Arabia and Russia (20%), the U.S. has the third-lowest corporate tax rate of all G20 economies.
This wasn’t always the case. The 2018 “Trump Tax” law was the largest overhaul of the tax code in three decades, part of which reduced the corporate tax rate from 35% to 21%.

-

 Technology1 week ago
Ranked: The 20 Biggest Tech Companies by Market Cap
-

 Money1 week ago
Ranked: The World’s Top 10 Billionaires in 2024
-

 Markets1 week ago
All of the World’s Trillion-Dollar Companies in One Chart
-
 Markets1 week ago
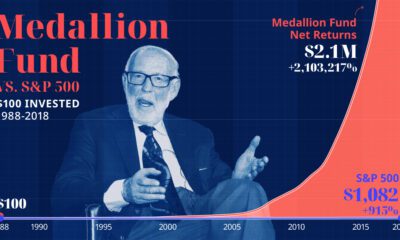
The Growth of $100 Invested in Jim Simons’ Medallion Fund
-

 Markets1 week ago
Charted: Four Decades of U.S. Tech IPOs
-

 Markets1 week ago
Ranked: The 20 Top Retailers Worldwide, by Revenue
-

 Markets1 week ago
Charted: Stock Buybacks by the Magnificent Seven
-

 Money1 week ago
Visualizing the Wealth of Americans Under 40 (1989-2023)