Markets
A Short History of U.S. Trade Wars
Infographic: A Short History of U.S. Trade Wars
The Chart of the Week is a weekly Visual Capitalist feature on Fridays.
History is full of trade wars.
In the majority of cases, the consequences are mostly economic – trade barriers are enacted, and then retaliatory measures are used to counter. Relations can continue to escalate until an understanding can be reached by both parties.
In the minority of cases, trade wars can lead to world-changing consequences.
You may remember that the Boston Tea Party of 1773 was a bold response to an unfair trade measure imposed by a ruling power, and it proved to be a key catalyst that led to the American Revolution.
Meanwhile, the Opium Wars occurred after the Qing Dynasty (China) tried to prevent British merchants from selling opium to the Chinese in the 1830s. These trade barriers led to armed conflicts, and effectively put the nail in the coffin of the Qing Dyasty – the start of China’s infamous “century of humiliation”.
U.S. Trade Wars
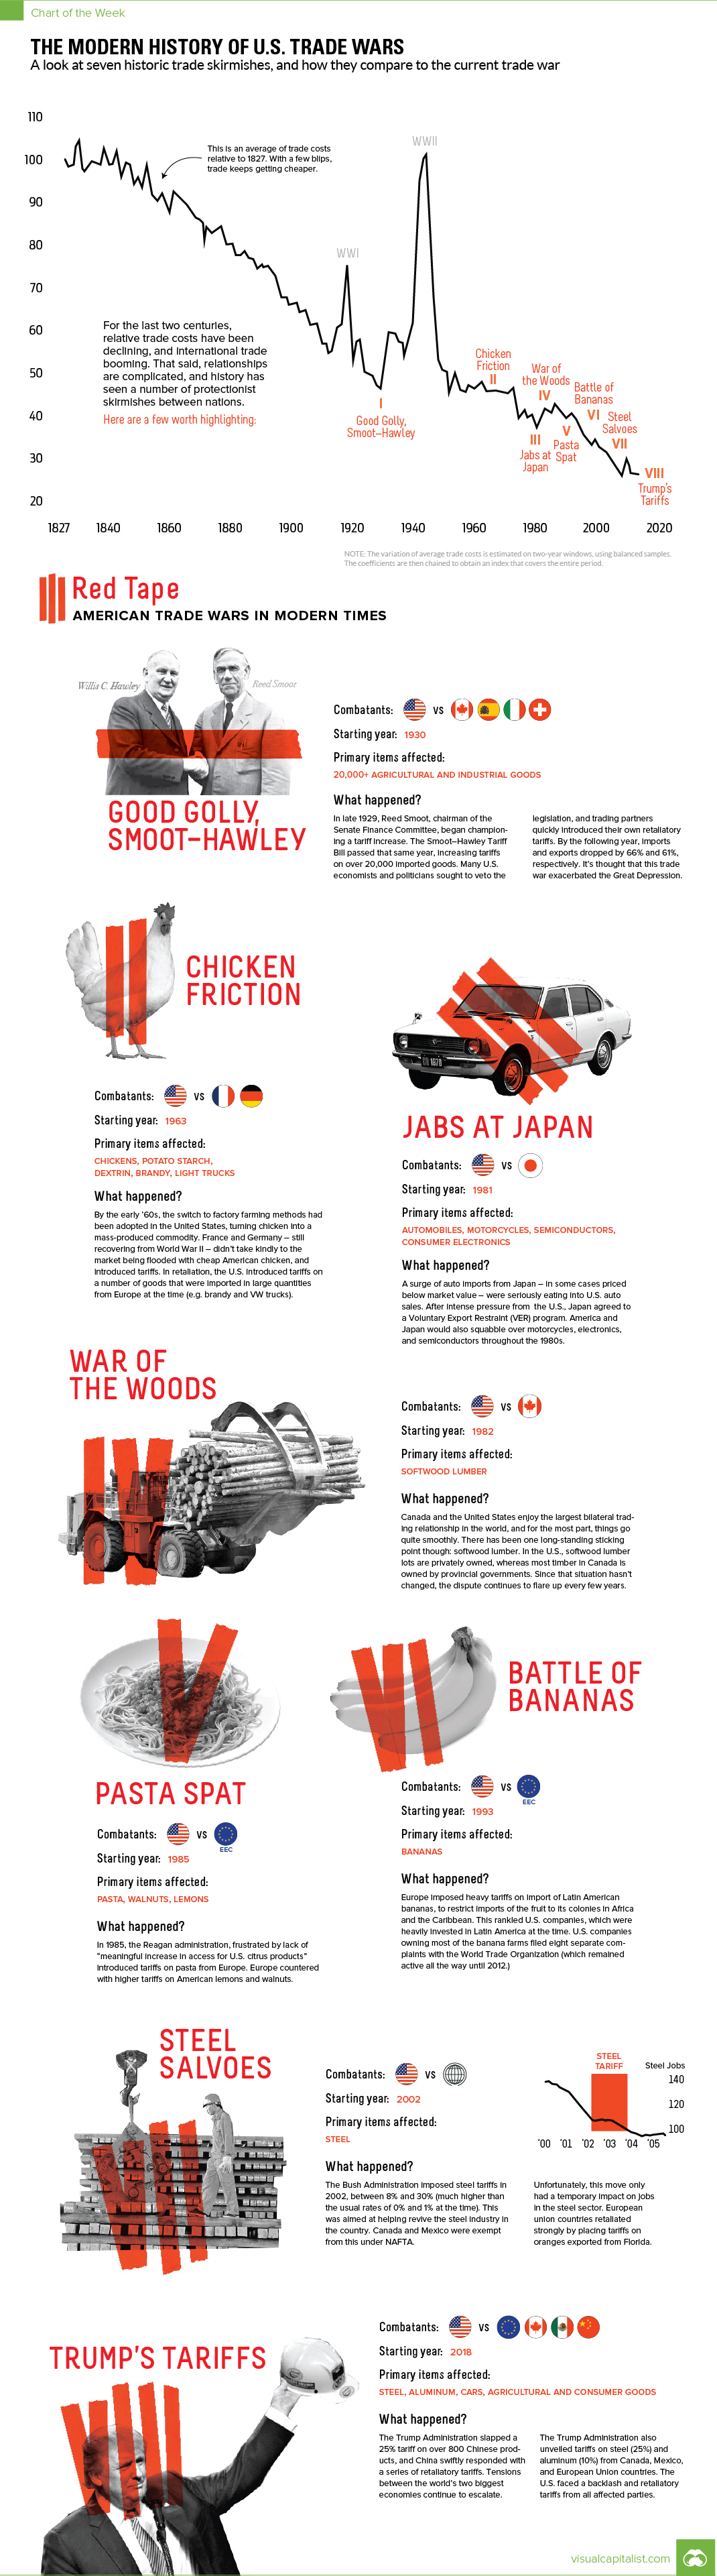
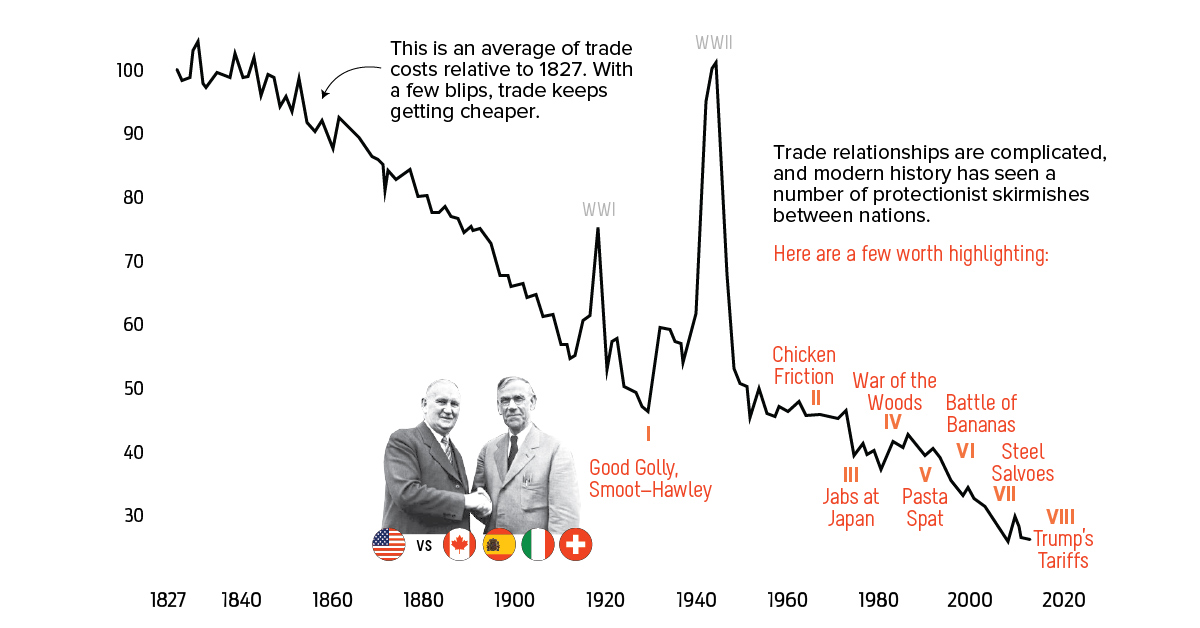
Today’s chart pulls together details on some of the biggest trade conflicts in modern U.S. history.
Here are some of the more interesting U.S. trade wars, and how they compare to the current spat that is evolving with major trade partners:
1. Smoot-Hawley, 1930
Imposed during The Great Depression, the Smoot-Hawley Act is almost universally recognized by economists and economic historians as triggering a trade war that exacerbated the recovery.
2. Chicken Friction, 1963
Factory farming of chicken in the U.S. ended up catching European farmers off guard. French and German authorities responded by imposing tariffs, and the U.S. then taxed imports such as trucks and brandy.
3. Jabs at Japan, 1981
Japan’s mid-century rise led to the country becoming an export powerhouse. As Japanese cars flooded the U.S. market, intense pressure eventually led to the signing of a Voluntary Export Restraint (VER) agreement that limited sales in the United States. During this same timeframe, the two countries also squabbled about other goods like electronics, motorcycles, and semiconductors.
4. War of the Woods, 1982
The Canada-U.S. Softwood Lumber dispute kicked off in 1982, but it inevitably resurfaces in the news every few years.
5. Pasta Spat, 1985
The U.S. was displeased with the level of access for citrus products in Europe, and put a tariff on pasta products. Europe retaliated by taxing walnuts and lemons from the States.
6. Battle of the Bananas, 1993
Another agricultural trade war, the Battle of the Bananas occurred after Europe slapped tariffs on the import of Latin American bananas. Many of these companies, owned by Americans, were not impressed. In response, there were eight separate complaints filed to the World Trade Organization (WTO). They weren’t resolved until 2012.
7. Steel Salvoes, 2002
These were the last major U.S. steel tariffs introduced before the more recent ones. The goal was similar: to revive the steel industry in the country. However, after a period of brief stability, jobs continued to decline. The European Union responded by taxing oranges exported from Florida.


Markets
U.S. Debt Interest Payments Reach $1 Trillion
U.S. debt interest payments have surged past the $1 trillion dollar mark, amid high interest rates and an ever-expanding debt burden.


U.S. Debt Interest Payments Reach $1 Trillion
This was originally posted on our Voronoi app. Download the app for free on iOS or Android and discover incredible data-driven charts from a variety of trusted sources.
The cost of paying for America’s national debt crossed the $1 trillion dollar mark in 2023, driven by high interest rates and a record $34 trillion mountain of debt.
Over the last decade, U.S. debt interest payments have more than doubled amid vast government spending during the pandemic crisis. As debt payments continue to soar, the Congressional Budget Office (CBO) reported that debt servicing costs surpassed defense spending for the first time ever this year.
This graphic shows the sharp rise in U.S. debt payments, based on data from the Federal Reserve.
A $1 Trillion Interest Bill, and Growing
Below, we show how U.S. debt interest payments have risen at a faster pace than at another time in modern history:
| Date | Interest Payments | U.S. National Debt |
|---|---|---|
| 2023 | $1.0T | $34.0T |
| 2022 | $830B | $31.4T |
| 2021 | $612B | $29.6T |
| 2020 | $518B | $27.7T |
| 2019 | $564B | $23.2T |
| 2018 | $571B | $22.0T |
| 2017 | $493B | $20.5T |
| 2016 | $460B | $20.0T |
| 2015 | $435B | $18.9T |
| 2014 | $442B | $18.1T |
| 2013 | $425B | $17.2T |
| 2012 | $417B | $16.4T |
| 2011 | $433B | $15.2T |
| 2010 | $400B | $14.0T |
| 2009 | $354B | $12.3T |
| 2008 | $380B | $10.7T |
| 2007 | $414B | $9.2T |
| 2006 | $387B | $8.7T |
| 2005 | $355B | $8.2T |
| 2004 | $318B | $7.6T |
| 2003 | $294B | $7.0T |
| 2002 | $298B | $6.4T |
| 2001 | $318B | $5.9T |
| 2000 | $353B | $5.7T |
| 1999 | $353B | $5.8T |
| 1998 | $360B | $5.6T |
| 1997 | $368B | $5.5T |
| 1996 | $362B | $5.3T |
| 1995 | $357B | $5.0T |
| 1994 | $334B | $4.8T |
| 1993 | $311B | $4.5T |
| 1992 | $306B | $4.2T |
| 1991 | $308B | $3.8T |
| 1990 | $298B | $3.4T |
| 1989 | $275B | $3.0T |
| 1988 | $254B | $2.7T |
| 1987 | $240B | $2.4T |
| 1986 | $225B | $2.2T |
| 1985 | $219B | $1.9T |
| 1984 | $205B | $1.7T |
| 1983 | $176B | $1.4T |
| 1982 | $157B | $1.2T |
| 1981 | $142B | $1.0T |
| 1980 | $113B | $930.2B |
| 1979 | $96B | $845.1B |
| 1978 | $84B | $789.2B |
| 1977 | $69B | $718.9B |
| 1976 | $61B | $653.5B |
| 1975 | $55B | $576.6B |
| 1974 | $50B | $492.7B |
| 1973 | $45B | $469.1B |
| 1972 | $39B | $448.5B |
| 1971 | $36B | $424.1B |
| 1970 | $35B | $389.2B |
| 1969 | $30B | $368.2B |
| 1968 | $25B | $358.0B |
| 1967 | $23B | $344.7B |
| 1966 | $21B | $329.3B |
Interest payments represent seasonally adjusted annual rate at the end of Q4.
At current rates, the U.S. national debt is growing by a remarkable $1 trillion about every 100 days, equal to roughly $3.6 trillion per year.
As the national debt has ballooned, debt payments even exceeded Medicaid outlays in 2023—one of the government’s largest expenditures. On average, the U.S. spent more than $2 billion per day on interest costs last year. Going further, the U.S. government is projected to spend a historic $12.4 trillion on interest payments over the next decade, averaging about $37,100 per American.
Exacerbating matters is that the U.S. is running a steep deficit, which stood at $1.1 trillion for the first six months of fiscal 2024. This has accelerated due to the 43% increase in debt servicing costs along with a $31 billion dollar increase in defense spending from a year earlier. Additionally, a $30 billion increase in funding for the Federal Deposit Insurance Corporation in light of the regional banking crisis last year was a major contributor to the deficit increase.
Overall, the CBO forecasts that roughly 75% of the federal deficit’s increase will be due to interest costs by 2034.

-

 Green2 weeks ago
Ranked: Top Countries by Total Forest Loss Since 2001
-

 Travel1 week ago
Ranked: The World’s Top Flight Routes, by Revenue
-

 Technology1 week ago
Ranked: Semiconductor Companies by Industry Revenue Share
-

 Money2 weeks ago
Which States Have the Highest Minimum Wage in America?
-

 Real Estate2 weeks ago
Ranked: The Most Valuable Housing Markets in America
-

 Markets2 weeks ago
Charted: Big Four Market Share by S&P 500 Audits
-

 AI2 weeks ago
The Stock Performance of U.S. Chipmakers So Far in 2024
-

 Automotive2 weeks ago
Almost Every EV Stock is Down After Q1 2024