Technology
Why Hackers Hack: Motives Behind Cyberattacks
Why Hackers Hack: The Motives Behind Cyberattacks
Cyberattacks caused $450 billion of damage to the global economy in 2016, and this number is predicted to keep rising as we keep adding more connected devices to the mix.
The magnitude of this impact should not be understated. It’s bigger than the size of notable economies like the UAE ($371B) or Norway ($370B) – which is why it’s no surprise to see organizations putting major resources to shore up their internal defenses and to reduce the risk of threats.
But while the origins of this cybersecurity boom may be clear, what is less obvious is why all of this hacking is happening in the first place.
Why do hackers hack, and what are the motives behind these powerful cyberattacks?
Why Hackers Hack
Today’s infographic comes to us from Raconteur, and it breaks down the statistics from a couple of large global studies on cybersecurity.
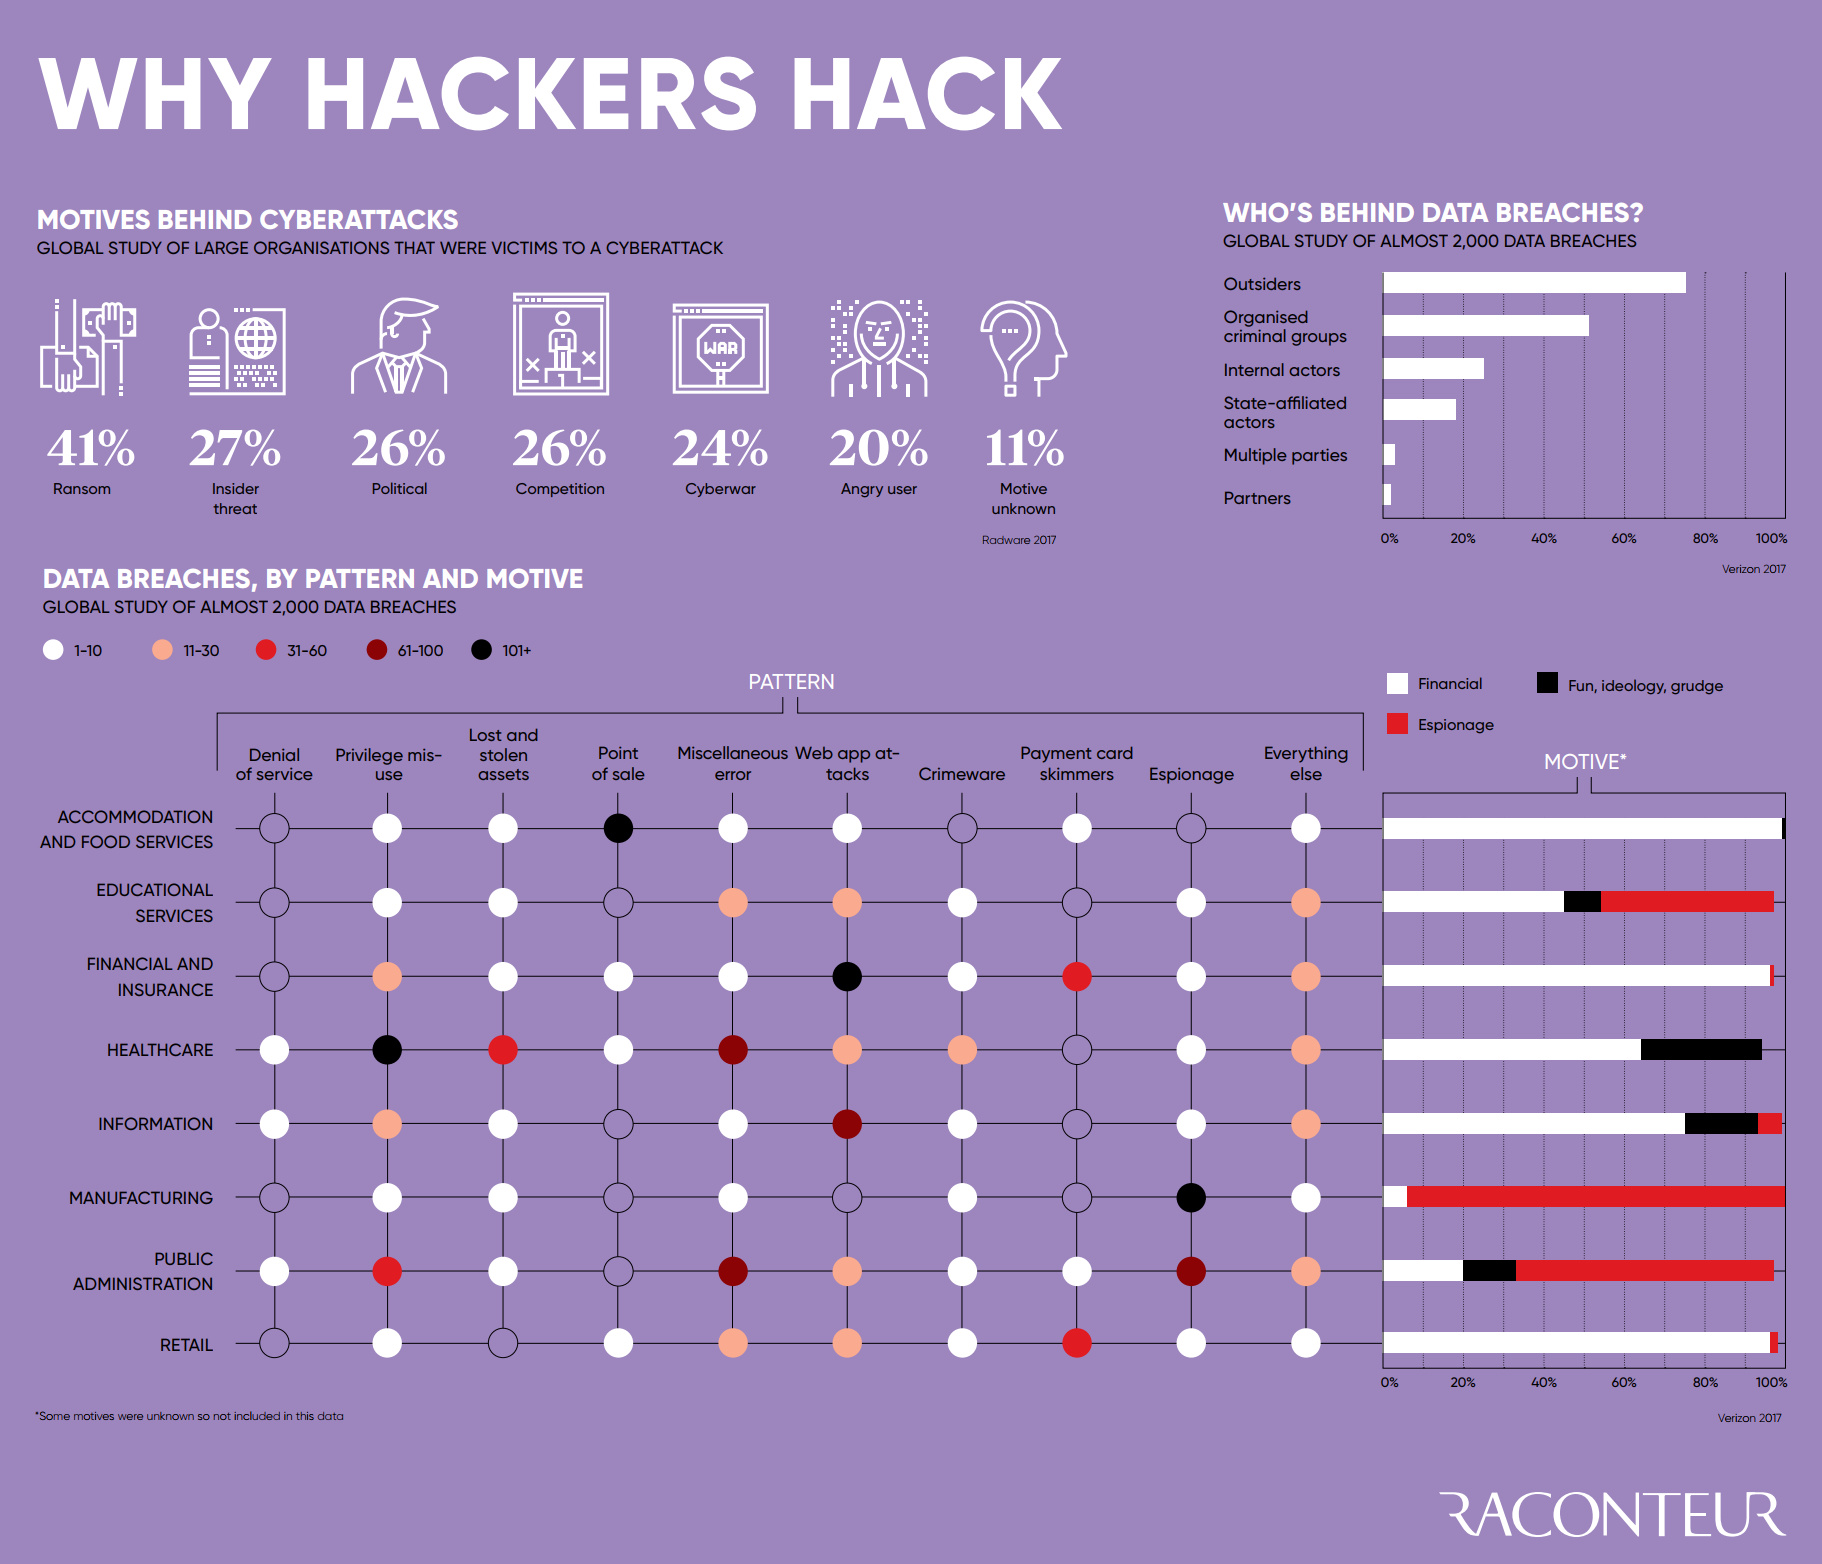
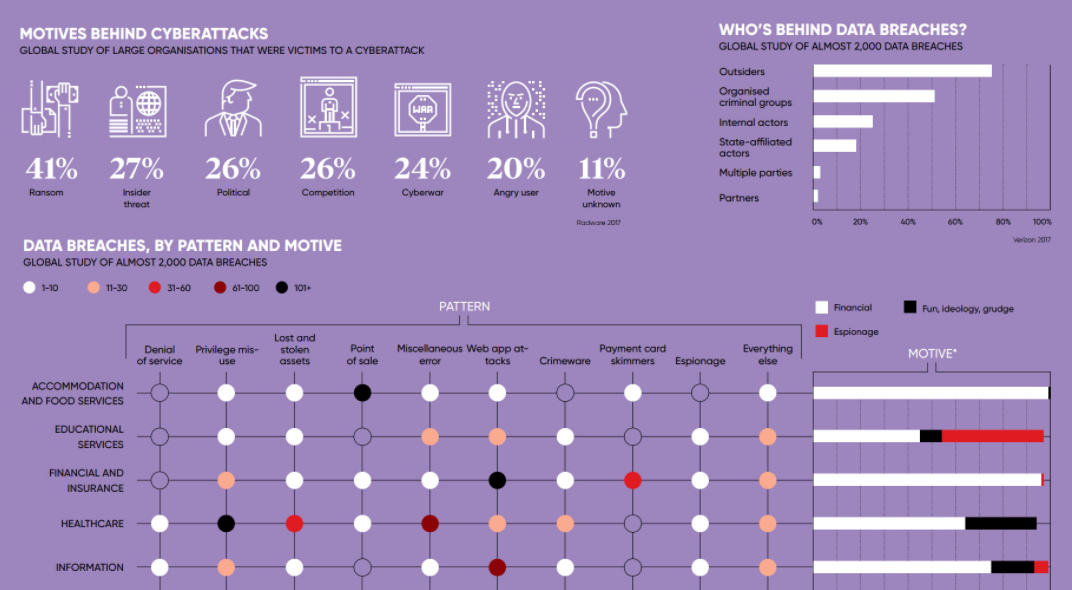
One of the first datasets shown comes from Radware, showing the motives behind why hackers hack:
- Ransom (41%)
- Insider threat (27%)
- Political reasons (26%)
- Competition (26%)
- Cyberwar (24%)
- Angry user (20%)
- Motive unknown (11%)
Interestingly, ransom is a top motive at 41% – but other reasons like politics, competition, and cyberwar were pretty evenly distributed in the mix as well.
Verizon, in their 2017 Data Breach Investigations Report, break down the motives of hackers in a different way. Using the three wider categories of “Financial”, “Espionage” and “Fun, Ideology, or Grudge (FIG)”, here is how cyberattacks look over time:
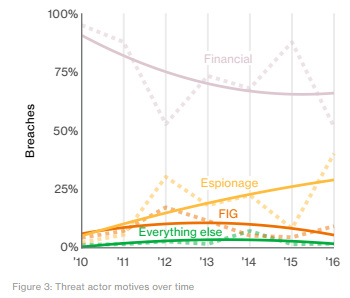
Most notably, espionage appears to be on the rise.
That’s significant, because over 50% of hacks already come from organized criminal groups, and close to 20% originate from state-affiliated actors. With espionage becoming a more common motive, it suggests that cyberattacks will continue getting more sophisticated and deliberate, and that specialized teams of hackers are executing a growing percentage of the attacks.
(For a real-time view of this espionage in action, make sure to watch cyberwarfare happening in real-time.)
Who and Why?
Hackers hack for a multitude of different reasons.
However, it does seem that the actors and motives for hacking are gradually shifting over time. Fewer cyberattacks today have FIG motives (fun, ideology, grudge), and more attacks are increasingly tied to espionage.
With more deliberate, determined, sophisticated, and team-based attackers – it’s no wonder that the cybersecurity industry is growing at a 9.5% annual clip.


Technology
Ranked: Semiconductor Companies by Industry Revenue Share
Nvidia is coming for Intel’s crown. Samsung is losing ground. AI is transforming the space. We break down revenue for semiconductor companies.


Semiconductor Companies by Industry Revenue Share
This was originally posted on our Voronoi app. Download the app for free on Apple or Android and discover incredible data-driven charts from a variety of trusted sources.
Did you know that some computer chips are now retailing for the price of a new BMW?
As computers invade nearly every sphere of life, so too have the chips that power them, raising the revenues of the businesses dedicated to designing them.
But how did various chipmakers measure against each other last year?
We rank the biggest semiconductor companies by their percentage share of the industry’s revenues in 2023, using data from Omdia research.
Which Chip Company Made the Most Money in 2023?
Market leader and industry-defining veteran Intel still holds the crown for the most revenue in the sector, crossing $50 billion in 2023, or 10% of the broader industry’s topline.
All is not well at Intel, however, with the company’s stock price down over 20% year-to-date after it revealed billion-dollar losses in its foundry business.
| Rank | Company | 2023 Revenue | % of Industry Revenue |
|---|---|---|---|
| 1 | Intel | $51B | 9.4% |
| 2 | NVIDIA | $49B | 9.0% |
| 3 | Samsung Electronics | $44B | 8.1% |
| 4 | Qualcomm | $31B | 5.7% |
| 5 | Broadcom | $28B | 5.2% |
| 6 | SK Hynix | $24B | 4.4% |
| 7 | AMD | $22B | 4.1% |
| 8 | Apple | $19B | 3.4% |
| 9 | Infineon Tech | $17B | 3.2% |
| 10 | STMicroelectronics | $17B | 3.2% |
| 11 | Texas Instruments | $17B | 3.1% |
| 12 | Micron Technology | $16B | 2.9% |
| 13 | MediaTek | $14B | 2.6% |
| 14 | NXP | $13B | 2.4% |
| 15 | Analog Devices | $12B | 2.2% |
| 16 | Renesas Electronics Corporation | $11B | 1.9% |
| 17 | Sony Semiconductor Solutions Corporation | $10B | 1.9% |
| 18 | Microchip Technology | $8B | 1.5% |
| 19 | Onsemi | $8B | 1.4% |
| 20 | KIOXIA Corporation | $7B | 1.3% |
| N/A | Others | $126B | 23.2% |
| N/A | Total | $545B | 100% |
Note: Figures are rounded. Totals and percentages may not sum to 100.
Meanwhile, Nvidia is very close to overtaking Intel, after declaring $49 billion of topline revenue for 2023. This is more than double its 2022 revenue ($21 billion), increasing its share of industry revenues to 9%.
Nvidia’s meteoric rise has gotten a huge thumbs-up from investors. It became a trillion dollar stock last year, and broke the single-day gain record for market capitalization this year.
Other chipmakers haven’t been as successful. Out of the top 20 semiconductor companies by revenue, 12 did not match their 2022 revenues, including big names like Intel, Samsung, and AMD.
The Many Different Types of Chipmakers
All of these companies may belong to the same industry, but they don’t focus on the same niche.
According to Investopedia, there are four major types of chips, depending on their functionality: microprocessors, memory chips, standard chips, and complex systems on a chip.
Nvidia’s core business was once GPUs for computers (graphics processing units), but in recent years this has drastically shifted towards microprocessors for analytics and AI.
These specialized chips seem to be where the majority of growth is occurring within the sector. For example, companies that are largely in the memory segment—Samsung, SK Hynix, and Micron Technology—saw peak revenues in the mid-2010s.

-

 Business2 weeks ago
America’s Top Companies by Revenue (1994 vs. 2023)
-

 Environment1 week ago
Ranked: Top Countries by Total Forest Loss Since 2001
-

 Markets1 week ago
Visualizing America’s Shortage of Affordable Homes
-

 Maps2 weeks ago
Mapped: Average Wages Across Europe
-

 Mining2 weeks ago
Charted: The Value Gap Between the Gold Price and Gold Miners
-

 Demographics2 weeks ago
Visualizing the Size of the Global Senior Population
-

 Misc2 weeks ago
Tesla Is Once Again the World’s Best-Selling EV Company
-

 Technology2 weeks ago
Ranked: The Most Popular Smartphone Brands in the U.S.