Markets
Four Maps Showing China’s Rising Dominance in Trade
We often use big, overarching ideas to help us understand the world and the opportunities contained within. These narratives, which can change over time, are used to create context. They give us a frame of reference for comprehending the news and events that affect our outlook on things.
China’s economic prowess is one of these new paradigms that has emerged, but many people still can’t really wrap their heads around the scale or scope of it.
It’s happened suddenly, and the ramifications are extremely relevant to our investments and understanding. Here’s four maps on China’s trade dominance that will help you think differently about the world:
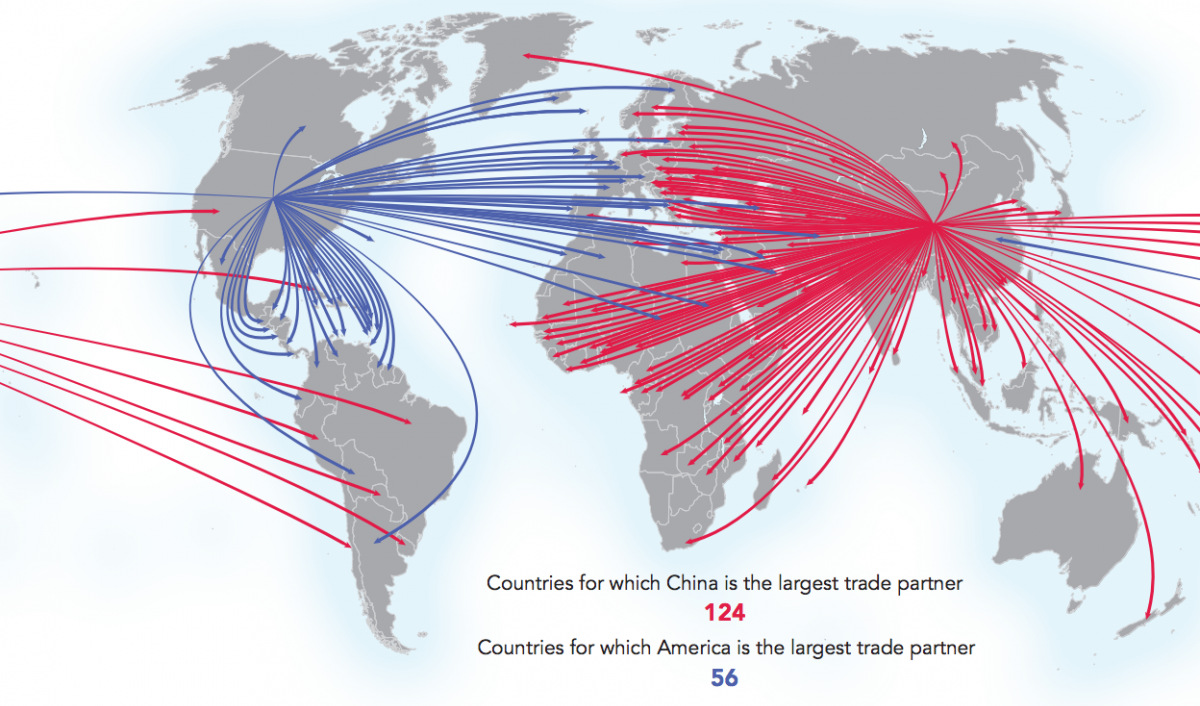
China is the world’s #1 trade partner
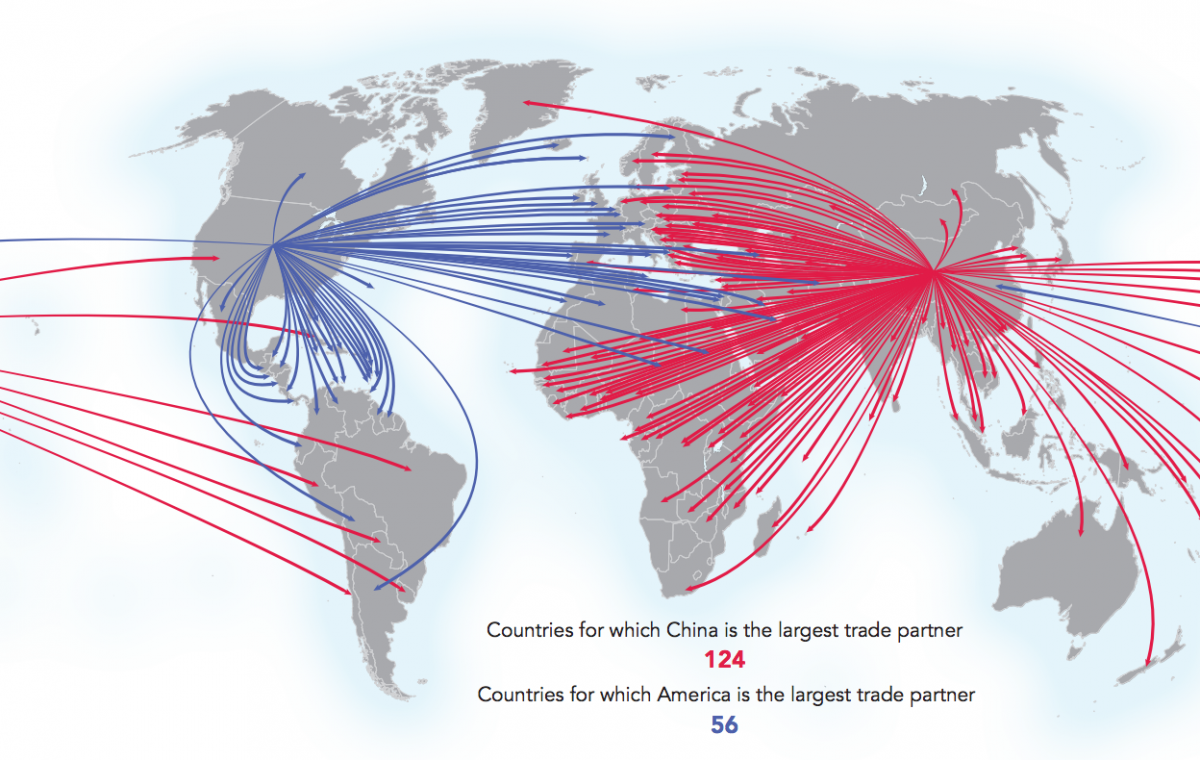
Image courtesy of: Connectography
The United States is the number one trading partner for 56 countries, with important relationships throughout North America, South America, and Western Europe.
Meanwhile, China is the top partner for 124 countries, dominating trade in Asia, Eastern Europe, Africa, and Australia.
China’s Sphere of Influence
This map shows the portion of trade conducted by each country with China in Southeast Asia.
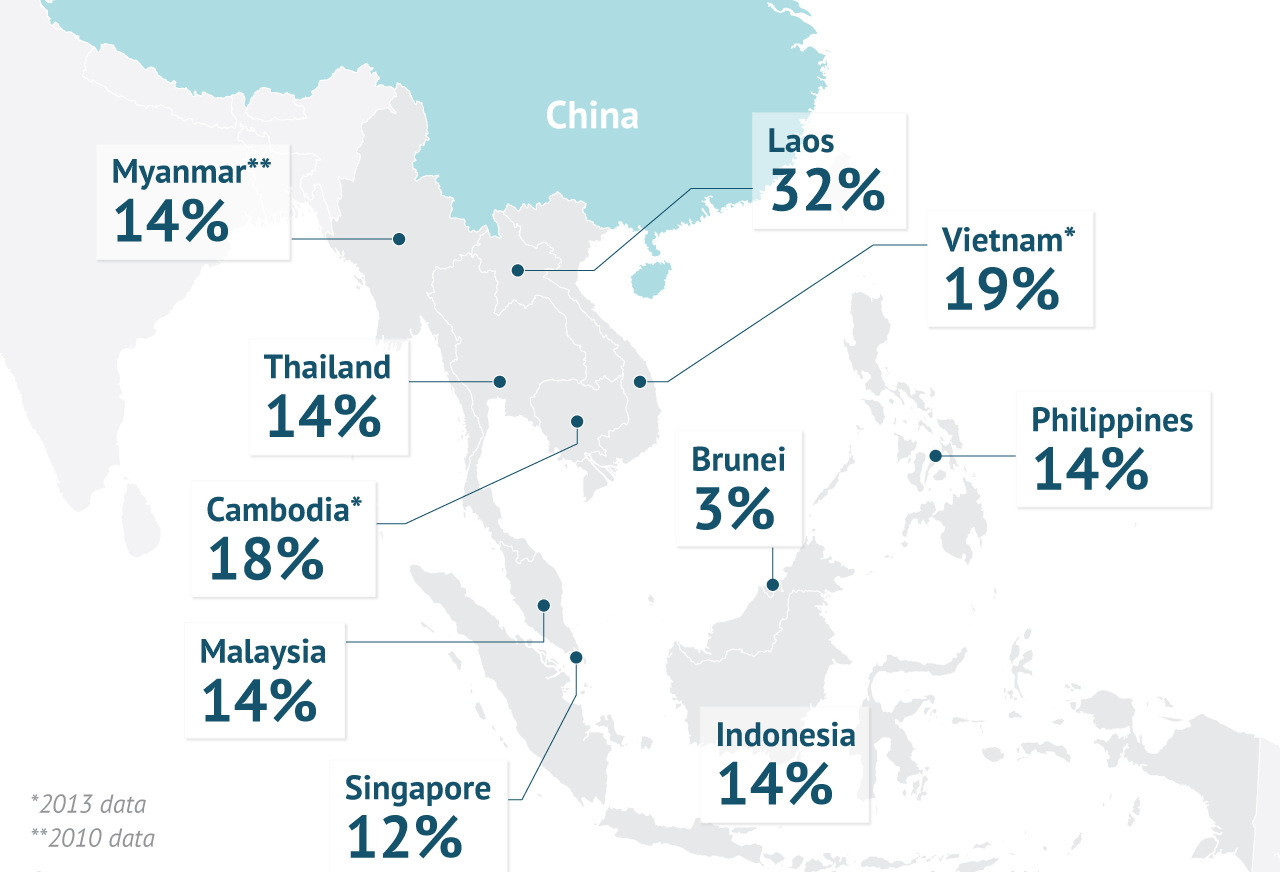
Image courtesy of: Stratfor
The influence that China has with nations in Southeast Asia is significant. Most trade is in double-digit percentages, and China views this as its immediate sphere of influence. Throughout history, territories in this region would even pay tribute to China to gain access to trade.
“In East Asia’s tribute system, China was the superior state, and many of its neighboring states were vassal states, and they maintained a relationship of tribute and rewards,” writes Liu Mingfu in The China Dream, a popular book about China’s plans to return to power.
Maintaining influence in Southeast Asia is part of the reason that Beijing is posturing in the South China Sea. In fact, China’s coastguard is growing so fast that in 10 years it will have more tonnage than all of the coastguards in Southeast Asia, the United States, and Japan combined.
Building a New Silk Road for Chinese Trade
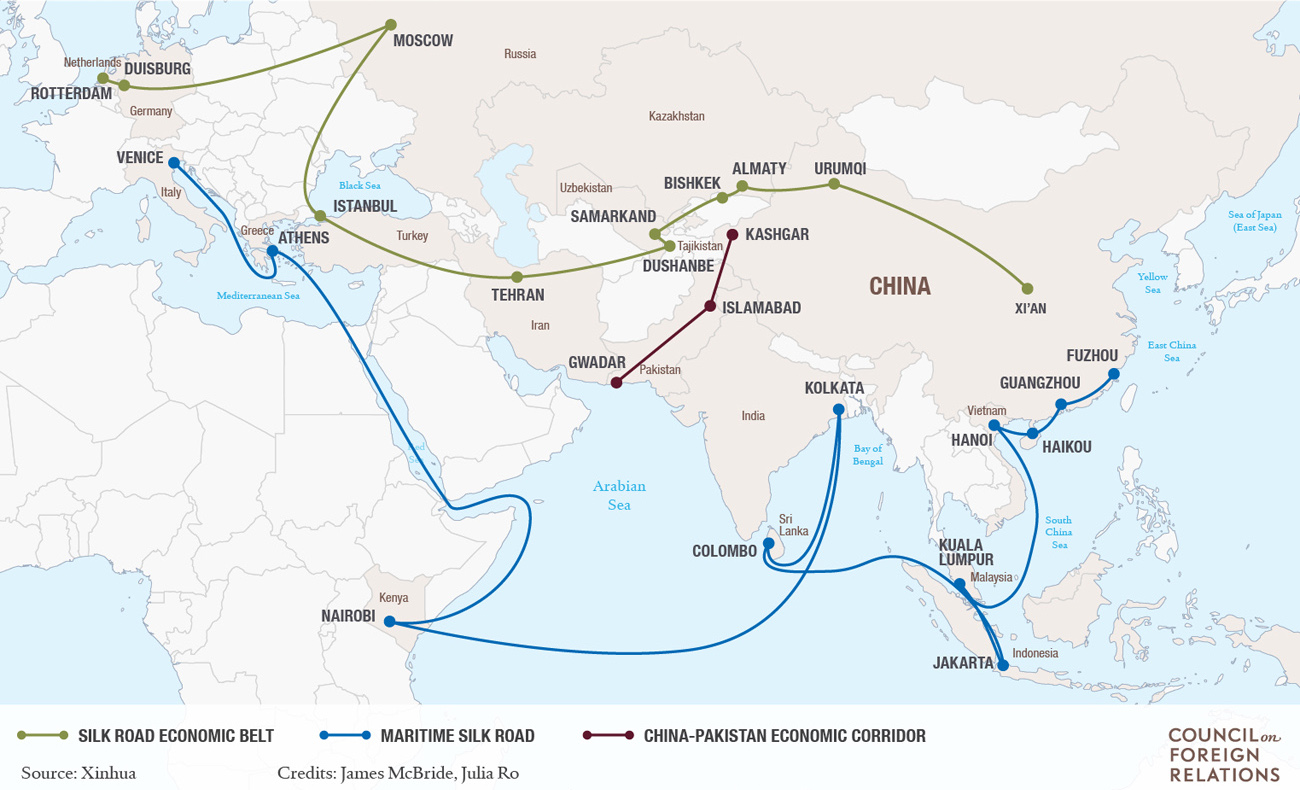
Image courtesy of: Council of Foreign Relations
China seeks to increase trade ties with Asia and Europe even further by building a new Silk Road that puts even Marco Polo’s route to shame.
The Chinese transcontinental network, a massive infrastructure project pegged for completion by 2025, is expected to bring down overland travel time from Beijing to London to just two days. Currently, it takes 15 days for the journey.
The project’s aim is to shorten the time of bulk consumer-goods transport to Europe, while unlocking the economic potential behind Eurasian cities from Almaty to Tehran. The new Silk Road will include at least one high-speed line that goes 320 km/h, and the network will help to link up 70% of the world’s population in roughly 40 countries.
Infrastructure Override
You may have heard of the AIIB (Asian Infrastructure Investment Bank), which was officially launched at the end of last year. Initially proposed by China, the bank now has over a $100 billion of capitalization and 57 founding member states.
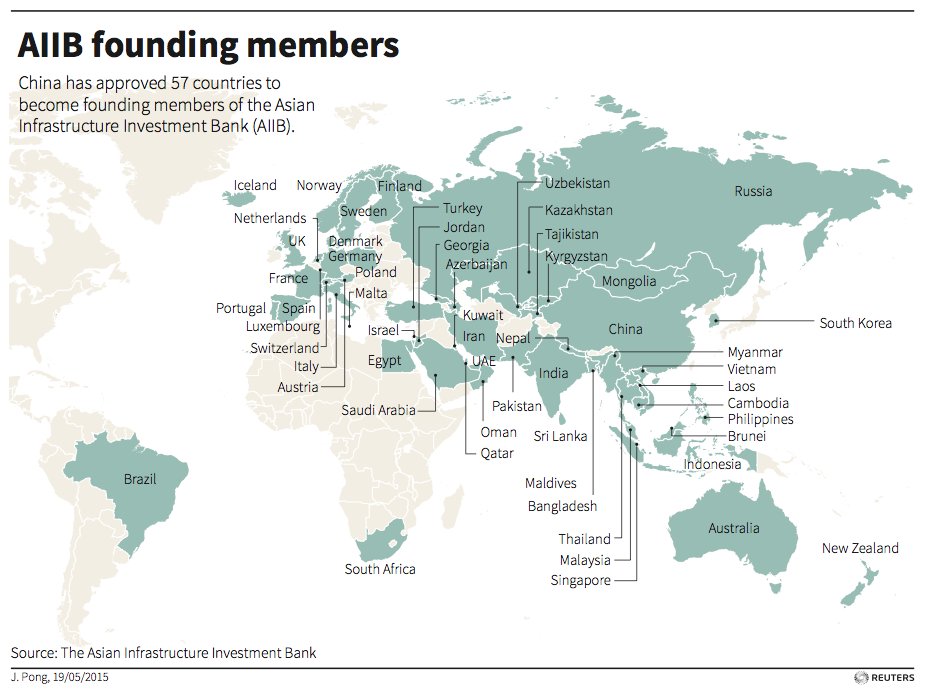
Image courtesy of: Reuters
While this shows China’s push for infrastructure especially to coincide with its new Silk Road, there is another very interesting detail: Beijing controls 26.06% of the votes, essentially giving it veto power as most bank decisions need 75% of the votes to pass.
In other words, only infrastructure projects that benefit Chinese trade will likely get the nod from Beijing.


Markets
The European Stock Market: Attractive Valuations Offer Opportunities
On average, the European stock market has valuations that are nearly 50% lower than U.S. valuations. But how can you access the market?


European Stock Market: Attractive Valuations Offer Opportunities
Europe is known for some established brands, from L’Oréal to Louis Vuitton. However, the European stock market offers additional opportunities that may be lesser known.
The above infographic, sponsored by STOXX, outlines why investors may want to consider European stocks.
Attractive Valuations
Compared to most North American and Asian markets, European stocks offer lower or comparable valuations.
| Index | Price-to-Earnings Ratio | Price-to-Book Ratio |
|---|---|---|
| EURO STOXX 50 | 14.9 | 2.2 |
| STOXX Europe 600 | 14.4 | 2 |
| U.S. | 25.9 | 4.7 |
| Canada | 16.1 | 1.8 |
| Japan | 15.4 | 1.6 |
| Asia Pacific ex. China | 17.1 | 1.8 |
Data as of February 29, 2024. See graphic for full index names. Ratios based on trailing 12 month financials. The price to earnings ratio excludes companies with negative earnings.
On average, European valuations are nearly 50% lower than U.S. valuations, potentially offering an affordable entry point for investors.
Research also shows that lower price ratios have historically led to higher long-term returns.
Market Movements Not Closely Connected
Over the last decade, the European stock market had low-to-moderate correlation with North American and Asian equities.
The below chart shows correlations from February 2014 to February 2024. A value closer to zero indicates low correlation, while a value of one would indicate that two regions are moving in perfect unison.
| EURO STOXX 50 | STOXX EUROPE 600 | U.S. | Canada | Japan | Asia Pacific ex. China |
|
|---|---|---|---|---|---|---|
| EURO STOXX 50 | 1.00 | 0.97 | 0.55 | 0.67 | 0.24 | 0.43 |
| STOXX EUROPE 600 | 1.00 | 0.56 | 0.71 | 0.28 | 0.48 | |
| U.S. | 1.00 | 0.73 | 0.12 | 0.25 | ||
| Canada | 1.00 | 0.22 | 0.40 | |||
| Japan | 1.00 | 0.88 | ||||
| Asia Pacific ex. China | 1.00 |
Data is based on daily USD returns.
European equities had relatively independent market movements from North American and Asian markets. One contributing factor could be the differing sector weights in each market. For instance, technology makes up a quarter of the U.S. market, but health care and industrials dominate the broader European market.
Ultimately, European equities can enhance portfolio diversification and have the potential to mitigate risk for investors.
Tracking the Market
For investors interested in European equities, STOXX offers a variety of flagship indices:
| Index | Description | Market Cap |
|---|---|---|
| STOXX Europe 600 | Pan-regional, broad market | €10.5T |
| STOXX Developed Europe | Pan-regional, broad-market | €9.9T |
| STOXX Europe 600 ESG-X | Pan-regional, broad market, sustainability focus | €9.7T |
| STOXX Europe 50 | Pan-regional, blue-chip | €5.1T |
| EURO STOXX 50 | Eurozone, blue-chip | €3.5T |
Data is as of February 29, 2024. Market cap is free float, which represents the shares that are readily available for public trading on stock exchanges.
The EURO STOXX 50 tracks the Eurozone’s biggest and most traded companies. It also underlies one of the world’s largest ranges of ETFs and mutual funds. As of November 2023, there were €27.3 billion in ETFs and €23.5B in mutual fund assets under management tracking the index.
“For the past 25 years, the EURO STOXX 50 has served as an accurate, reliable and tradable representation of the Eurozone equity market.”
— Axel Lomholt, General Manager at STOXX
Partnering with STOXX to Track the European Stock Market
Are you interested in European equities? STOXX can be a valuable partner:
- Comprehensive, liquid and investable ecosystem
- European heritage, global reach
- Highly sophisticated customization capabilities
- Open architecture approach to using data
- Close partnerships with clients
- Part of ISS STOXX and Deutsche Börse Group
With a full suite of indices, STOXX can help you benchmark against the European stock market.
Learn how STOXX’s European indices offer liquid and effective market access.

-

 Economy1 day ago
Economic Growth Forecasts for G7 and BRICS Countries in 2024
The IMF has released its economic growth forecasts for 2024. How do the G7 and BRICS countries compare?
-

 Markets1 week ago
U.S. Debt Interest Payments Reach $1 Trillion
U.S. debt interest payments have surged past the $1 trillion dollar mark, amid high interest rates and an ever-expanding debt burden.
-

 United States2 weeks ago
Ranked: The Largest U.S. Corporations by Number of Employees
We visualized the top U.S. companies by employees, revealing the massive scale of retailers like Walmart, Target, and Home Depot.
-

 Markets2 weeks ago
The Top 10 States by Real GDP Growth in 2023
This graphic shows the states with the highest real GDP growth rate in 2023, largely propelled by the oil and gas boom.
-

 Markets2 weeks ago
Ranked: The World’s Top Flight Routes, by Revenue
In this graphic, we show the highest earning flight routes globally as air travel continued to rebound in 2023.
-

 Markets2 weeks ago
Ranked: The Most Valuable Housing Markets in America
The U.S. residential real estate market is worth a staggering $47.5 trillion. Here are the most valuable housing markets in the country.


-

 Mining1 week ago
Gold vs. S&P 500: Which Has Grown More Over Five Years?
-
Markets2 weeks ago
Ranked: The Most Valuable Housing Markets in America
-

 Money2 weeks ago
Which States Have the Highest Minimum Wage in America?
-

 AI2 weeks ago
Ranked: Semiconductor Companies by Industry Revenue Share
-
Markets2 weeks ago
Ranked: The World’s Top Flight Routes, by Revenue
-

 Countries2 weeks ago
Population Projections: The World’s 6 Largest Countries in 2075
-
Markets2 weeks ago
The Top 10 States by Real GDP Growth in 2023
-

 Demographics2 weeks ago
The Smallest Gender Wage Gaps in OECD Countries