Markets
Which Countries Own the Most U.S. Debt?
The Foreign Countries Holding the Most U.S. Debt
In the international finance system, U.S. debt can be bought and held by virtually anyone.
In fact, if you hold a U.S. Treasury bond or a T-Bill in your portfolio right now, you are already a creditor to the United States government.
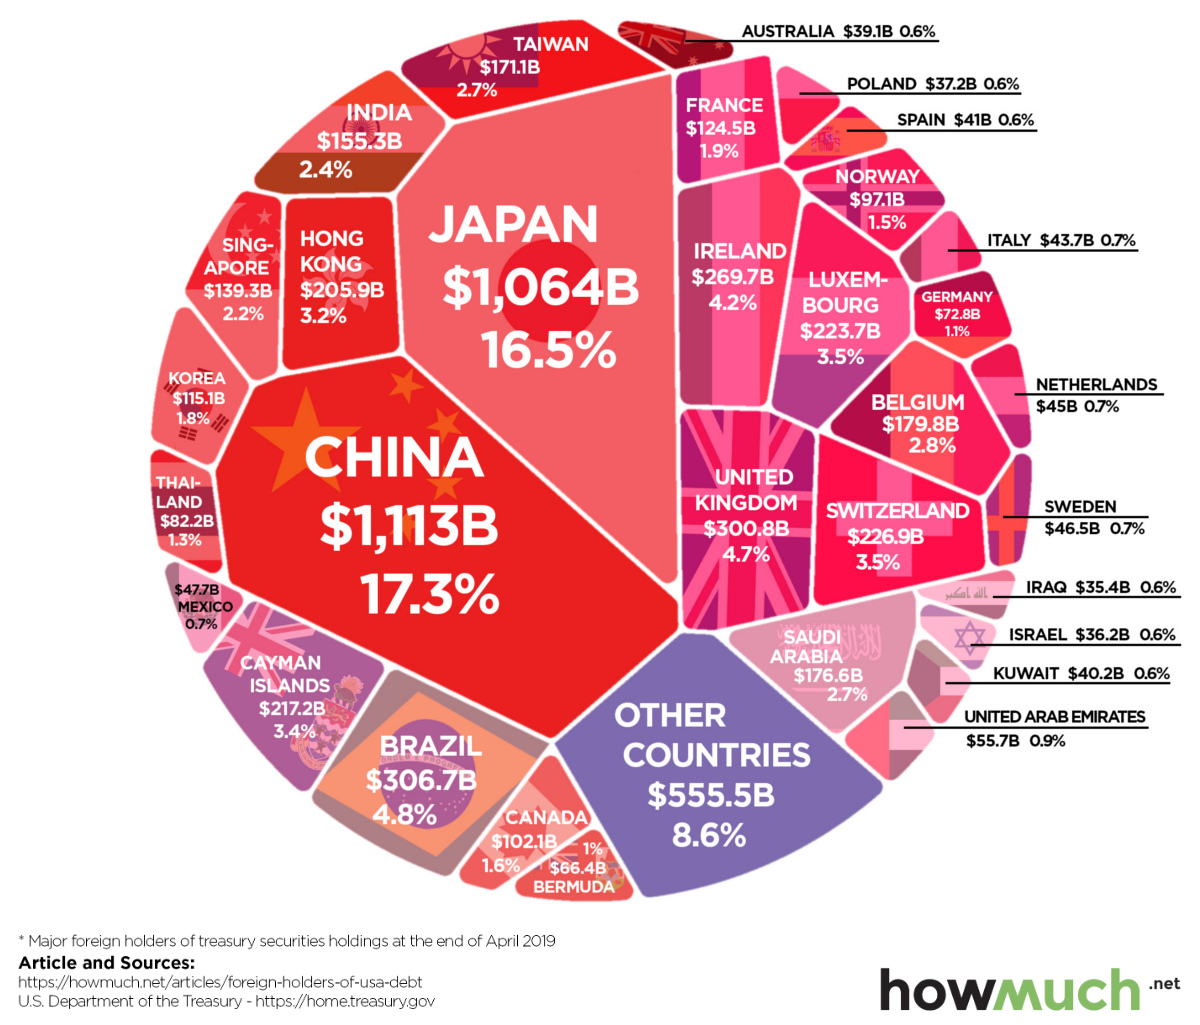
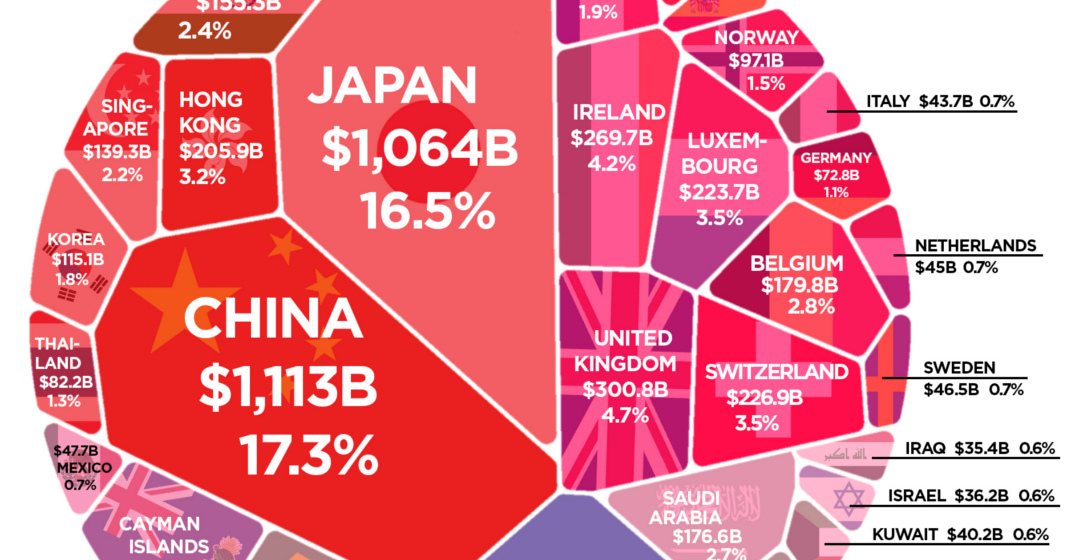
And as you can see in today’s chart from HowMuch.net, foreign countries like China and Japan can also accumulate large positions in U.S. Treasurys, making them significant players in the overall United States debt pie.
U.S. Debt: The Big Picture
The United States federal debt currently sits at $22 trillion, and it’s held by a range of domestic and foreign investors.
| Entity | Debt Holdings | Share of Total |
|---|---|---|
| U.S. Government and Federal Reserve | $8.1 trillion | 36.8% |
| Foreign and international | $6.3 trillion | 28.5% |
| Mutual funds | $2.06 trillion | 9.4% |
| Pension funds | $0.92 trillion | 4.2% |
| Banks | $0.77 trillion | 3.5% |
| State and local governments | $0.69 trillion | 3.1% |
| Other investors | $3.18 trillion | 14.5% |
| Total | $21.97 trillion | 100.0% |
As you can see, about $8.1 trillion of debt is held by departments of the U.S. government or the Federal Reserve. This number would include securities sitting in retirement accounts of federal employees, social security trust funds, or any of the Treasurys sitting on the Fed’s balance sheet.
Next, another $7.6 trillion of debt is held by domestic investors. These are marketable securities held by banks, mutual funds, pension funds, insurance companies, and other investors.
While debt held domestically is mostly uninteresting, a bigger question mark is the $6.3 trillion of debt that is owned by foreign countries. After all, couldn’t a country like China “weaponize” its large holdings of Treasury securities as a form of retaliation in the ongoing trade war?
Foreign Owners of the Debt
Internationally, the biggest owners of debt include China and Japan, each with over $1 trillion.
| Rank | Country | U.S. Debt Holdings | Percentage of Foreign U.S. Debt Held (%) |
|---|---|---|---|
| #1 | 🇨🇳 China | $1.11 trillion | 17.3% |
| #2 | 🇯🇵 Japan | $1.06 trillion | 16.5% |
| #3 | 🇧🇷 Brazil | $307 billion | 4.8% |
| #4 | 🇬🇧 United Kingdom | $301 billion | 4.7% |
| #5 | 🇮🇪 Ireland | $270 billion | 4.2% |
| #6 | 🇨🇭 Switzerland | $227 billion | 3.5% |
| #7 | 🇱🇺 Luxembourg | $224 billion | 3.5% |
| #8 | 🇰🇾 Cayman Islands | $217 billion | 3.4% |
| #9 | 🇭🇰 Hong Kong | $206 billion | 3.2% |
| #10 | 🇧🇪 Belgium | $180 billion | 2.8% |
| #11 | 🇸🇦 Saudi Arabia | $177 billion | 2.8% |
| #12 | 🇹🇼 Taiwan | $171 billion | 2.7% |
Why does China hold so much of the foreign-owned U.S. debt?
China has accumulated Treasury securities over decades, as part of its strategy to keep its domestic currency from strengthening. Interestingly, the export-heavy nation has reduced its swath of Treasurys in recent months, selling off close to $200 billion of them.
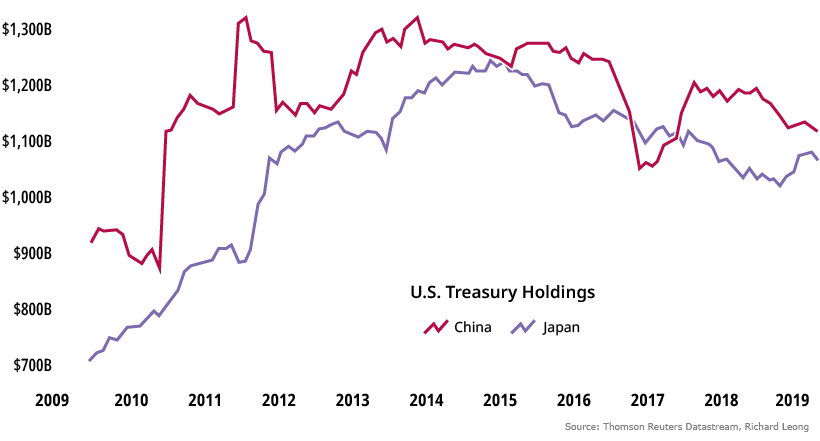
Although China has $1.11 trillion of Treasurys left in reserve, the general consensus is that dumping all of them at once would destabilize the global financial system, having an equally negative effect on China as well.
That said, with foreign nations holding U.S. debt, such a risk will always exist.
Gimme Shelter
While it’s not surprising to see countries like China, Japan, or Brazil on the list of top foreign debt holders, what are places like the Cayman Islands, Luxembourg, or Ireland doing on the list?
Two simple facts help to explain these anomalies.
Firstly, despite having a population of just 60,000 people, the Cayman Islands is a hedge fund capital with over 10,000 funds domiciled there. Luxembourg makes the list for similar reasons, given that it is the European-based tax shelter equivalent.
Ireland, on the other hand, is the overseas headquarters for many U.S.-based tech giants like Facebook or Alphabet. Apparently, these corporations like to hold their overseas profits in highly-liquid Treasurys, rather than paying a repatriation tax to bring the cash back to American soil.


Markets
U.S. Debt Interest Payments Reach $1 Trillion
U.S. debt interest payments have surged past the $1 trillion dollar mark, amid high interest rates and an ever-expanding debt burden.


U.S. Debt Interest Payments Reach $1 Trillion
This was originally posted on our Voronoi app. Download the app for free on iOS or Android and discover incredible data-driven charts from a variety of trusted sources.
The cost of paying for America’s national debt crossed the $1 trillion dollar mark in 2023, driven by high interest rates and a record $34 trillion mountain of debt.
Over the last decade, U.S. debt interest payments have more than doubled amid vast government spending during the pandemic crisis. As debt payments continue to soar, the Congressional Budget Office (CBO) reported that debt servicing costs surpassed defense spending for the first time ever this year.
This graphic shows the sharp rise in U.S. debt payments, based on data from the Federal Reserve.
A $1 Trillion Interest Bill, and Growing
Below, we show how U.S. debt interest payments have risen at a faster pace than at another time in modern history:
| Date | Interest Payments | U.S. National Debt |
|---|---|---|
| 2023 | $1.0T | $34.0T |
| 2022 | $830B | $31.4T |
| 2021 | $612B | $29.6T |
| 2020 | $518B | $27.7T |
| 2019 | $564B | $23.2T |
| 2018 | $571B | $22.0T |
| 2017 | $493B | $20.5T |
| 2016 | $460B | $20.0T |
| 2015 | $435B | $18.9T |
| 2014 | $442B | $18.1T |
| 2013 | $425B | $17.2T |
| 2012 | $417B | $16.4T |
| 2011 | $433B | $15.2T |
| 2010 | $400B | $14.0T |
| 2009 | $354B | $12.3T |
| 2008 | $380B | $10.7T |
| 2007 | $414B | $9.2T |
| 2006 | $387B | $8.7T |
| 2005 | $355B | $8.2T |
| 2004 | $318B | $7.6T |
| 2003 | $294B | $7.0T |
| 2002 | $298B | $6.4T |
| 2001 | $318B | $5.9T |
| 2000 | $353B | $5.7T |
| 1999 | $353B | $5.8T |
| 1998 | $360B | $5.6T |
| 1997 | $368B | $5.5T |
| 1996 | $362B | $5.3T |
| 1995 | $357B | $5.0T |
| 1994 | $334B | $4.8T |
| 1993 | $311B | $4.5T |
| 1992 | $306B | $4.2T |
| 1991 | $308B | $3.8T |
| 1990 | $298B | $3.4T |
| 1989 | $275B | $3.0T |
| 1988 | $254B | $2.7T |
| 1987 | $240B | $2.4T |
| 1986 | $225B | $2.2T |
| 1985 | $219B | $1.9T |
| 1984 | $205B | $1.7T |
| 1983 | $176B | $1.4T |
| 1982 | $157B | $1.2T |
| 1981 | $142B | $1.0T |
| 1980 | $113B | $930.2B |
| 1979 | $96B | $845.1B |
| 1978 | $84B | $789.2B |
| 1977 | $69B | $718.9B |
| 1976 | $61B | $653.5B |
| 1975 | $55B | $576.6B |
| 1974 | $50B | $492.7B |
| 1973 | $45B | $469.1B |
| 1972 | $39B | $448.5B |
| 1971 | $36B | $424.1B |
| 1970 | $35B | $389.2B |
| 1969 | $30B | $368.2B |
| 1968 | $25B | $358.0B |
| 1967 | $23B | $344.7B |
| 1966 | $21B | $329.3B |
Interest payments represent seasonally adjusted annual rate at the end of Q4.
At current rates, the U.S. national debt is growing by a remarkable $1 trillion about every 100 days, equal to roughly $3.6 trillion per year.
As the national debt has ballooned, debt payments even exceeded Medicaid outlays in 2023—one of the government’s largest expenditures. On average, the U.S. spent more than $2 billion per day on interest costs last year. Going further, the U.S. government is projected to spend a historic $12.4 trillion on interest payments over the next decade, averaging about $37,100 per American.
Exacerbating matters is that the U.S. is running a steep deficit, which stood at $1.1 trillion for the first six months of fiscal 2024. This has accelerated due to the 43% increase in debt servicing costs along with a $31 billion dollar increase in defense spending from a year earlier. Additionally, a $30 billion increase in funding for the Federal Deposit Insurance Corporation in light of the regional banking crisis last year was a major contributor to the deficit increase.
Overall, the CBO forecasts that roughly 75% of the federal deficit’s increase will be due to interest costs by 2034.

-

 Green2 weeks ago
Ranked: Top Countries by Total Forest Loss Since 2001
-

 Travel1 week ago
Ranked: The World’s Top Flight Routes, by Revenue
-

 Technology2 weeks ago
Ranked: Semiconductor Companies by Industry Revenue Share
-

 Money2 weeks ago
Which States Have the Highest Minimum Wage in America?
-

 Real Estate2 weeks ago
Ranked: The Most Valuable Housing Markets in America
-

 Markets2 weeks ago
Charted: Big Four Market Share by S&P 500 Audits
-

 AI2 weeks ago
The Stock Performance of U.S. Chipmakers So Far in 2024
-

 Automotive2 weeks ago
Almost Every EV Stock is Down After Q1 2024