Markets
Unlocking the Return Potential in Factor Investing
What is the best way to predict success?
In baseball, the game’s strategy was forever changed when Oakland Athletics traded in the standard scout’s intuition for a data-driven approach. It was a switch that eventually led the team to an impressive 20-game winning streak, depicted in the movie Moneyball—it also kickstarted a broader revolution in sports analytics.
Similarly, successful data patterns are also being discovered by experts in the investing world. One such framework is factor investing, where securities are chosen based on attributes that are commonly associated with higher risk-adjusted returns.
Factor Investing 101
Today’s infographic comes to us from Stoxx, and it explains how factor investing works, as well as how to apply the strategy in a portfolio.

A Selective Approach
There are two main types of factors. Macroeconomic factors, such as inflation, drive market-wide returns. Style factors, such as a company’s size, drive returns within asset classes.
Analysts have numerous theories as to why these factors have historically outperformed over long timeframes:
- Rewarded risk
Investors can potentially earn a higher return for taking on more risk. - Behavioral bias
Investors can be prone to acting emotionally rather than rationally. - Investor constraints
Investors may face constraints such as the inability to use leverage. - Size: Smaller companies have historically experienced higher returns than larger companies
- Low Risk: Stocks with low volatility tend to earn higher risk-adjusted returns than stocks that have higher volatility.
- Momentum: Stocks that have generated strong returns in the past tend to continue outperforming.
- Quality: Quality is identified by minimal debt, consistent earnings, steady asset growth, and good corporate governance.
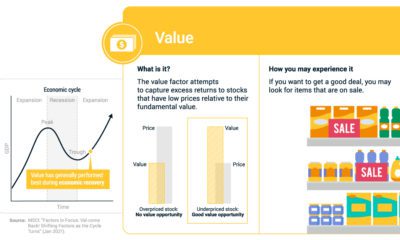
- Value: Stocks that have a low price compared to their fundamental value may generate higher returns.
- Hold long positions in attractive securities, such as those with upward momentum
- Hold short positions in unattractive securities, such as those with downward momentum
Astute investors can capitalize on these biases by targeting the individual factors driving returns.
The Common Style Factors
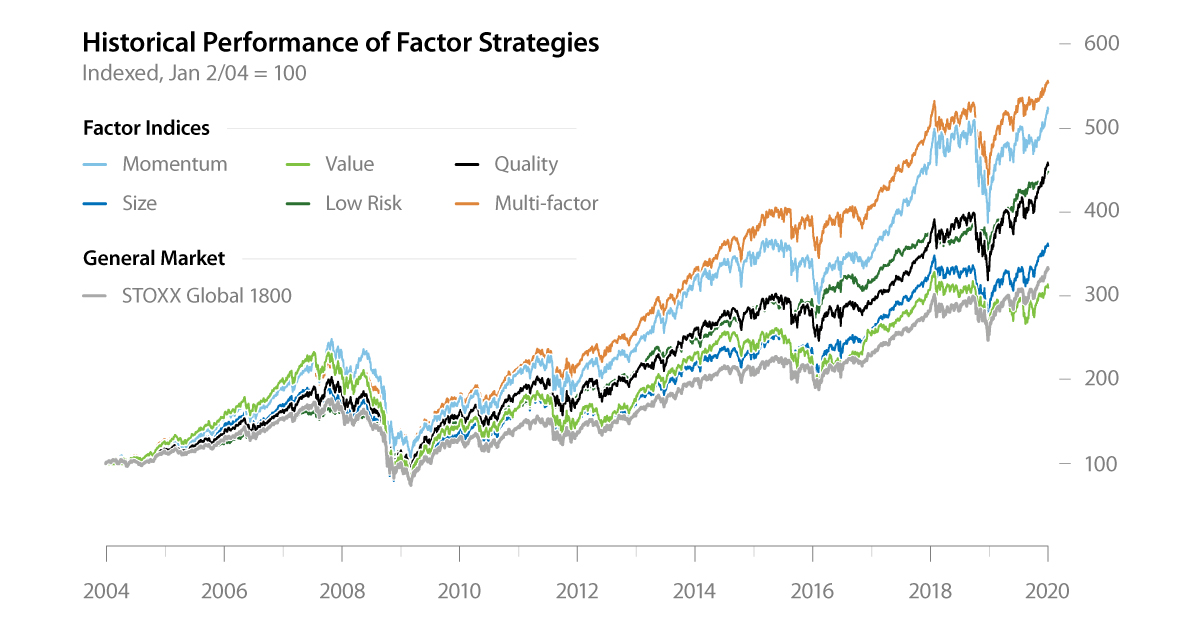
Based on academic research and historical performance, there are five style factors that are widely accepted.
It is becoming more straightforward for investors to implement these factors in a portfolio.
How Can You Apply Factor Investing?
All investors are exposed to factors whether they are aware of it or not. For example, an investor who puts capital in an ESG fund—targeting companies with good corporate governance—will have some level of quality exposure.
However, there are various approaches investors can take to implement factors intentionally.
Single Factors
Factors perform differently over the course of a market cycle. For example, low volatility stocks have historically performed well during market downturns such as the 2008 financial crisis or the 2015 sell-off.
Investors can consider macroeconomic information and their own market views, and adjust their exposure to individual factors accordingly.
Multi-factor
Factors tend to exhibit low or negative correlation with each other. For a long-term strategy, investors can combine multiple factors, which increases portfolio diversification and may provide more consistent returns.
Long-short
For each factor, there are investments that lie on either end of the spectrum. Experienced, risk-tolerant investors can employ a long-short strategy to play both sides:
This diversifies potential return sources, and reduces aggregate market exposure.
Capturing Factors Through Indexing
Active managers have been selecting securities based on factors for decades. To capture factors with precision, managers must carefully consider numerous elements of portfolio construction, such as the starting investment universe and the relative weight of securities.
More recently, investors can access factor investing through another method: indexing. An indexing approach provides a framework for capturing these factors, which helps simplify the investment process. Based on objective rules, index solutions provide a higher level of transparency than some active solutions.
Not only that, their efficiency makes them more suitable as tools for building targeted outcomes.
The Future of Factors
In light of indexing’s various benefits, it’s perhaps not surprising that exchange-traded factor products have seen immense growth in the last decade.
In addition, there’s still plenty of room for factor ETF expansion in equities and other asset classes. Only about 1% of factor ETFs invest in fixed income, and 70% of surveyed institutional investors believe factor investing can be extended to the asset class.
As solutions continue to evolve, factor products could become the foundation of many investors’ portfolios.


Markets
The European Stock Market: Attractive Valuations Offer Opportunities
On average, the European stock market has valuations that are nearly 50% lower than U.S. valuations. But how can you access the market?


European Stock Market: Attractive Valuations Offer Opportunities
Europe is known for some established brands, from L’Oréal to Louis Vuitton. However, the European stock market offers additional opportunities that may be lesser known.
The above infographic, sponsored by STOXX, outlines why investors may want to consider European stocks.
Attractive Valuations
Compared to most North American and Asian markets, European stocks offer lower or comparable valuations.
| Index | Price-to-Earnings Ratio | Price-to-Book Ratio |
|---|---|---|
| EURO STOXX 50 | 14.9 | 2.2 |
| STOXX Europe 600 | 14.4 | 2 |
| U.S. | 25.9 | 4.7 |
| Canada | 16.1 | 1.8 |
| Japan | 15.4 | 1.6 |
| Asia Pacific ex. China | 17.1 | 1.8 |
Data as of February 29, 2024. See graphic for full index names. Ratios based on trailing 12 month financials. The price to earnings ratio excludes companies with negative earnings.
On average, European valuations are nearly 50% lower than U.S. valuations, potentially offering an affordable entry point for investors.
Research also shows that lower price ratios have historically led to higher long-term returns.
Market Movements Not Closely Connected
Over the last decade, the European stock market had low-to-moderate correlation with North American and Asian equities.
The below chart shows correlations from February 2014 to February 2024. A value closer to zero indicates low correlation, while a value of one would indicate that two regions are moving in perfect unison.
| EURO STOXX 50 | STOXX EUROPE 600 | U.S. | Canada | Japan | Asia Pacific ex. China |
|
|---|---|---|---|---|---|---|
| EURO STOXX 50 | 1.00 | 0.97 | 0.55 | 0.67 | 0.24 | 0.43 |
| STOXX EUROPE 600 | 1.00 | 0.56 | 0.71 | 0.28 | 0.48 | |
| U.S. | 1.00 | 0.73 | 0.12 | 0.25 | ||
| Canada | 1.00 | 0.22 | 0.40 | |||
| Japan | 1.00 | 0.88 | ||||
| Asia Pacific ex. China | 1.00 |
Data is based on daily USD returns.
European equities had relatively independent market movements from North American and Asian markets. One contributing factor could be the differing sector weights in each market. For instance, technology makes up a quarter of the U.S. market, but health care and industrials dominate the broader European market.
Ultimately, European equities can enhance portfolio diversification and have the potential to mitigate risk for investors.
Tracking the Market
For investors interested in European equities, STOXX offers a variety of flagship indices:
| Index | Description | Market Cap |
|---|---|---|
| STOXX Europe 600 | Pan-regional, broad market | €10.5T |
| STOXX Developed Europe | Pan-regional, broad-market | €9.9T |
| STOXX Europe 600 ESG-X | Pan-regional, broad market, sustainability focus | €9.7T |
| STOXX Europe 50 | Pan-regional, blue-chip | €5.1T |
| EURO STOXX 50 | Eurozone, blue-chip | €3.5T |
Data is as of February 29, 2024. Market cap is free float, which represents the shares that are readily available for public trading on stock exchanges.
The EURO STOXX 50 tracks the Eurozone’s biggest and most traded companies. It also underlies one of the world’s largest ranges of ETFs and mutual funds. As of November 2023, there were €27.3 billion in ETFs and €23.5B in mutual fund assets under management tracking the index.
“For the past 25 years, the EURO STOXX 50 has served as an accurate, reliable and tradable representation of the Eurozone equity market.”
— Axel Lomholt, General Manager at STOXX
Partnering with STOXX to Track the European Stock Market
Are you interested in European equities? STOXX can be a valuable partner:
- Comprehensive, liquid and investable ecosystem
- European heritage, global reach
- Highly sophisticated customization capabilities
- Open architecture approach to using data
- Close partnerships with clients
- Part of ISS STOXX and Deutsche Börse Group
With a full suite of indices, STOXX can help you benchmark against the European stock market.
Learn how STOXX’s European indices offer liquid and effective market access.

-

 Economy1 day ago
Economic Growth Forecasts for G7 and BRICS Countries in 2024
The IMF has released its economic growth forecasts for 2024. How do the G7 and BRICS countries compare?
-

 Markets1 week ago
U.S. Debt Interest Payments Reach $1 Trillion
U.S. debt interest payments have surged past the $1 trillion dollar mark, amid high interest rates and an ever-expanding debt burden.
-

 United States1 week ago
Ranked: The Largest U.S. Corporations by Number of Employees
We visualized the top U.S. companies by employees, revealing the massive scale of retailers like Walmart, Target, and Home Depot.
-

 Markets2 weeks ago
The Top 10 States by Real GDP Growth in 2023
This graphic shows the states with the highest real GDP growth rate in 2023, largely propelled by the oil and gas boom.
-

 Markets2 weeks ago
Ranked: The World’s Top Flight Routes, by Revenue
In this graphic, we show the highest earning flight routes globally as air travel continued to rebound in 2023.
-

 Markets2 weeks ago
Ranked: The Most Valuable Housing Markets in America
The U.S. residential real estate market is worth a staggering $47.5 trillion. Here are the most valuable housing markets in the country.


-

 Mining1 week ago
Gold vs. S&P 500: Which Has Grown More Over Five Years?
-
Markets2 weeks ago
Ranked: The Most Valuable Housing Markets in America
-

 Money2 weeks ago
Which States Have the Highest Minimum Wage in America?
-

 AI2 weeks ago
Ranked: Semiconductor Companies by Industry Revenue Share
-
Markets2 weeks ago
Ranked: The World’s Top Flight Routes, by Revenue
-

 Demographics2 weeks ago
Population Projections: The World’s 6 Largest Countries in 2075
-
Markets2 weeks ago
The Top 10 States by Real GDP Growth in 2023
-

 Demographics2 weeks ago
The Smallest Gender Wage Gaps in OECD Countries