Energy
Visualizing EV Production in the U.S. by Brand


Visualizing EV Production in the U.S. by Brand
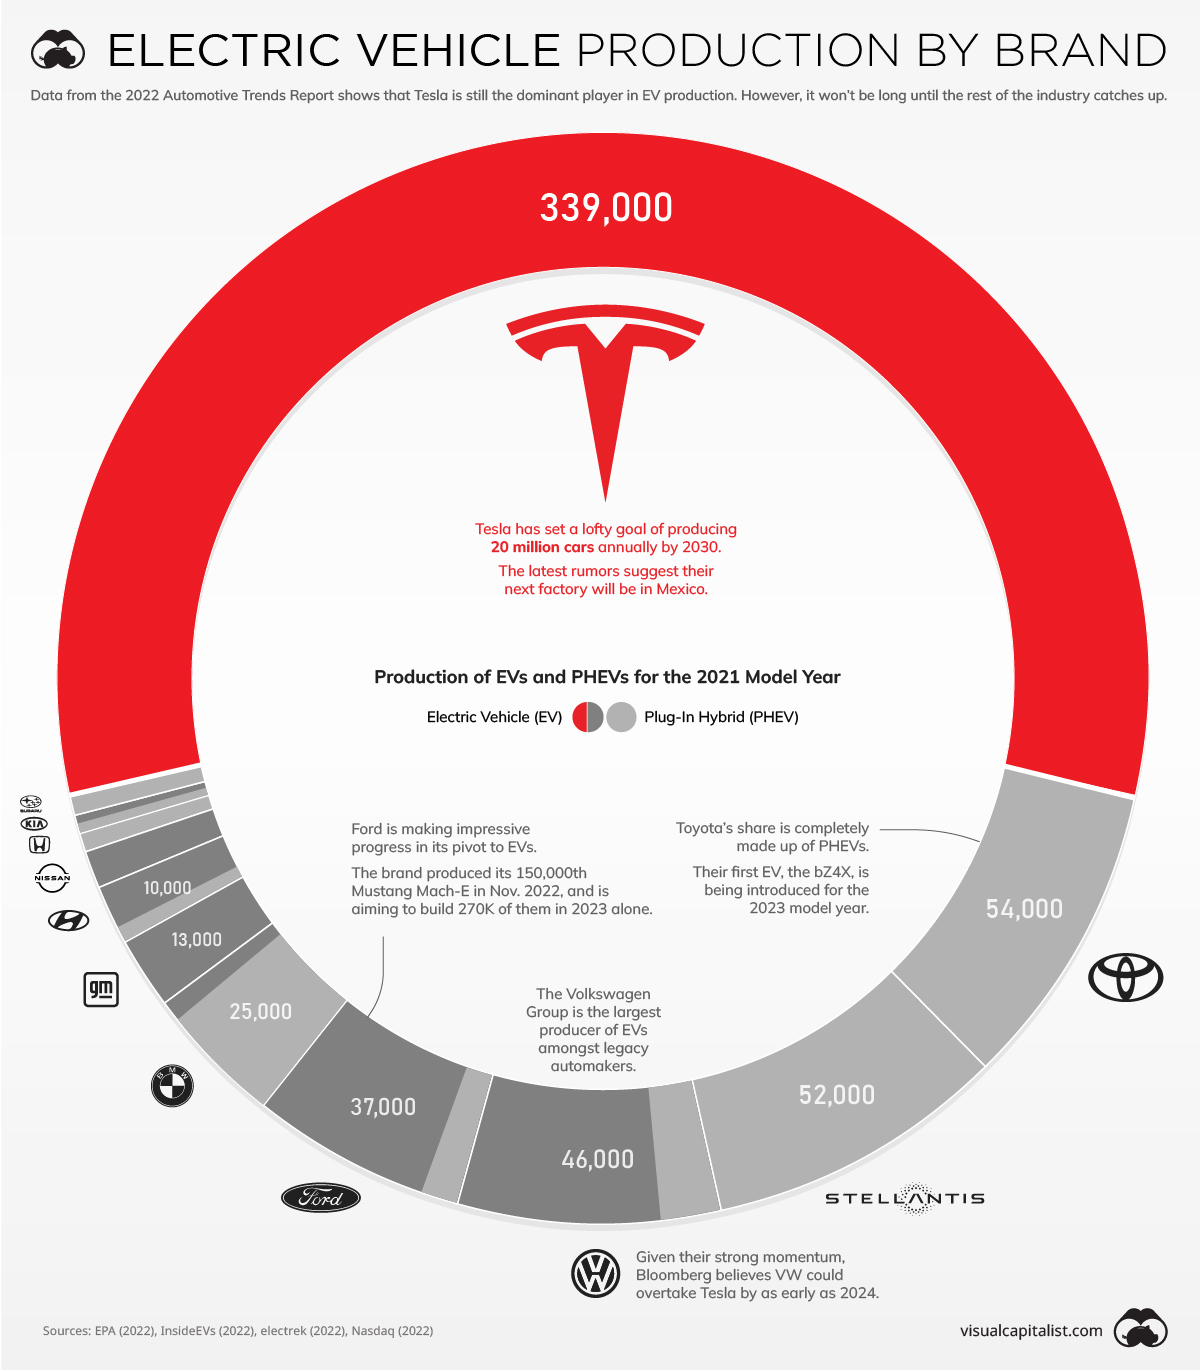
How long will Tesla hold onto its dominant electric vehicle (EV) market share?
This is one of the biggest questions facing the U.S. automotive industry. On one hand, Tesla has a very strong brand and loyal customer base (similar to Apple). The company also has a headstart in EV production and spends more on R&D per car than its competitors.
On the other hand, legacy automakers such as Volkswagen are eager to overtake Tesla. As the incumbents, they have decades more experience in building cars and are investing billions of dollars to catch up.
To keep you up to date on this evolving story, we’ve visualized data from the EPA’s 2022 Automotive Trends Report.
Data for the 2021 Model Year
Although it comes from a 2022 report, the comprehensive production data used in this infographic is for the 2021 model year.
The table below breaks out total production by EV and PHEV (plug-in hybrid electric vehicle).
| Manufacturer | EV Production | PHEV Production | Combined Production |
|---|---|---|---|
| GM | 13,000 | 0 | 13,000 |
| Toyota | 0 | 54,000 | 54,000 |
| VW | 37,000 | 9,000 | 46,000 |
| BMW | 2,000 | 22,000 | 25,000 |
| Honda | 0 | 2,000 | 2,000 |
| Tesla | 339,000 | 0 | 339,000 |
| Mazda | 0 | 0 | 0 |
| Hyundai | 8,000 | 2,000 | 10,000 |
| Subaru | 0 | 2,000 | 2,000 |
| Mercedes | 0 | 0 | 0 |
| Stellantis | 0 | 52,000 | 52,000 |
| Kia | 1,000 | 1,000 | 2,000 |
| Nissan | 6,000 | 0 | 6,000 |
| Ford | 32,000 | 5,000 | 37,000 |
| Total* | 438,000 | 149,000 | 588,000 |
*Rounded to nearest 1,000. Numbers may not add up due to rounding. Includes top 14 manufacturers with U.S. footprint
Toyota and Stellantis are the two biggest legacy automakers in this dataset, though it’s worth pointing out that they only produced PHEVs. Toyota’s first EV, the bZ4X, isn’t slated for release until 2023.
Stellantis appears to be even further behind, though the company has plenty of untapped potential with brands like Jeep and Ram. In a recent interview, Stellantis CEO Carlos Tavares revealed that the company has set aside $36 billion for electrification and software.
Legacy Brands with the Most Momentum
When it comes to building EVs, some legacy brands have moved quicker than others.
Among these legacy brands is Volkswagen, which has made a major commitment to EVs in the fallout of its Dieselgate scandal. The group aims to produce 22 million EVs by 2028, and is rolling out various models including the ID.3 hatchback, the ID.4 SUV, and the ID. Buzz (an electric revival of the classic Microbus).
Ford is also showing good pace, announcing $22 billion in EV investment between 2021 and 2025. The brand produced its 150,000th Mustang Mach-E in Nov. 2022, and is aiming to build 270,000 of them in 2023 alone.
Ford’s highly anticipated F-150 Lightning has also received over 200,000 reservations. Production of the Lightning is expected to be 15,000 in 2022, 55,000 in 2023, and 80,000 in 2024. Rivian, Ford’s primary rival in the electric pickup truck segment, is on track to reach 25,000 vehicles in 2022.


Who’s Building the Most Solar Energy?
This was originally posted on our Voronoi app. Download the app for free on iOS or Android and discover incredible data-driven charts from a variety of trusted sources.
In 2023, solar energy accounted for three-quarters of renewable capacity additions worldwide. Most of this growth occurred in Asia, the EU, and the U.S., continuing a trend observed over the past decade.
In this graphic, we illustrate the rise in installed solar photovoltaic (PV) capacity in China, the EU, and the U.S. between 2010 and 2022, measured in gigawatts (GW). Bruegel compiled the data..
Chinese Dominance
As of 2022, China’s total installed capacity stands at 393 GW, nearly double that of the EU’s 205 GW and surpassing the USA’s total of 113 GW by more than threefold in absolute terms.
| Installed solar capacity (GW) | China | EU27 | U.S. |
|---|---|---|---|
| 2022 | 393.0 | 205.5 | 113.0 |
| 2021 | 307.0 | 162.7 | 95.4 |
| 2020 | 254.0 | 136.9 | 76.4 |
| 2019 | 205.0 | 120.1 | 61.6 |
| 2018 | 175.3 | 104.0 | 52.0 |
| 2017 | 130.8 | 96.2 | 43.8 |
| 2016 | 77.8 | 91.5 | 35.4 |
| 2015 | 43.6 | 87.7 | 24.2 |
| 2014 | 28.4 | 83.6 | 18.1 |
| 2013 | 17.8 | 79.7 | 13.3 |
| 2012 | 6.7 | 71.1 | 8.6 |
| 2011 | 3.1 | 53.3 | 5.6 |
| 2010 | 1.0 | 30.6 | 3.4 |
Since 2017, China has shown a compound annual growth rate (CAGR) of approximately 25% in installed PV capacity, while the USA has seen a CAGR of 21%, and the EU of 16%.
Additionally, China dominates the production of solar power components, currently controlling around 80% of the world’s solar panel supply chain.
In 2022, China’s solar industry employed 2.76 million individuals, with manufacturing roles representing approximately 1.8 million and the remaining 918,000 jobs in construction, installation, and operations and maintenance.
The EU industry employed 648,000 individuals, while the U.S. reached 264,000 jobs.
According to the IEA, China accounts for almost 60% of new renewable capacity expected to become operational globally by 2028.
Despite the phasing out of national subsidies in 2020 and 2021, deployment of solar PV in China is accelerating. The country is expected to reach its national 2030 target for wind and solar PV installations in 2024, six years ahead of schedule.

-

 Markets5 days ago
The World’s Fastest Growing Emerging Markets (2024-2029 Forecast)
-

 Technology2 weeks ago
All of the Grants Given by the U.S. CHIPS Act
-

 Green2 weeks ago
The Carbon Footprint of Major Travel Methods
-

 United States2 weeks ago
Visualizing the Most Common Pets in the U.S.
-

 Culture2 weeks ago
The World’s Top Media Franchises by All-Time Revenue
-

 Visual Capitalist1 week ago
Best Visualizations of April on the Voronoi App
-

 Wealth1 week ago
Charted: Which Country Has the Most Billionaires in 2024?
-

 Markets1 week ago
The Top Private Equity Firms by Country