Datastream
Europe Leads in EV Sales, but for How Long?
The Briefing
- Europe and China were the largest electric vehicle (EV) markets by a wide margin in 2020
- EV adoption in the U.S. is expected to rise as the Biden administration works to increase industry incentives
Europe Leads in EV Sales, but for How Long?
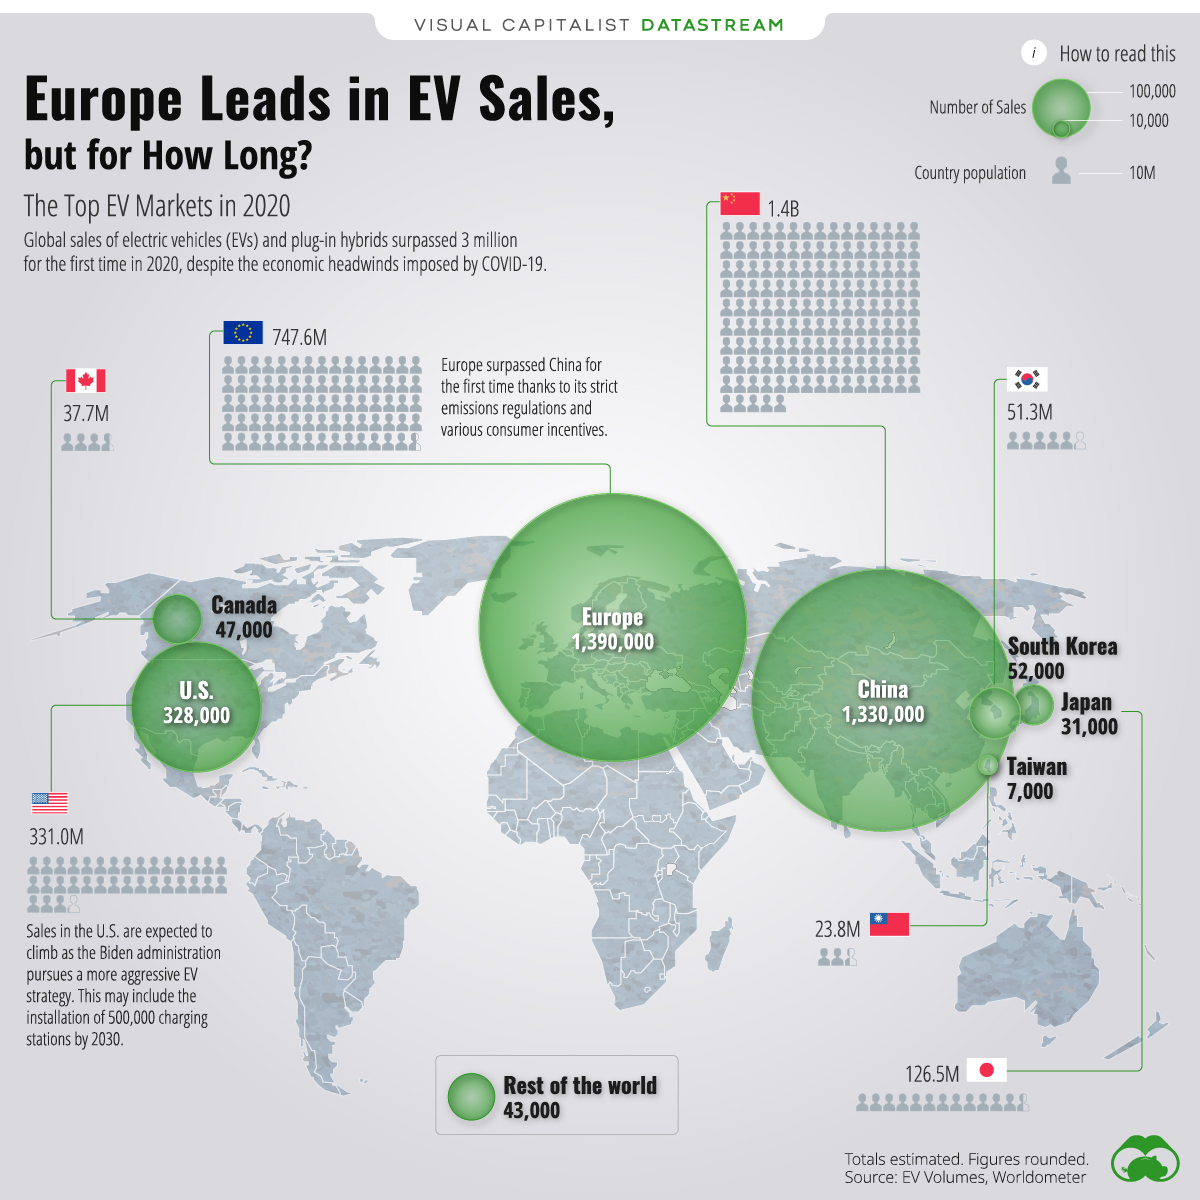
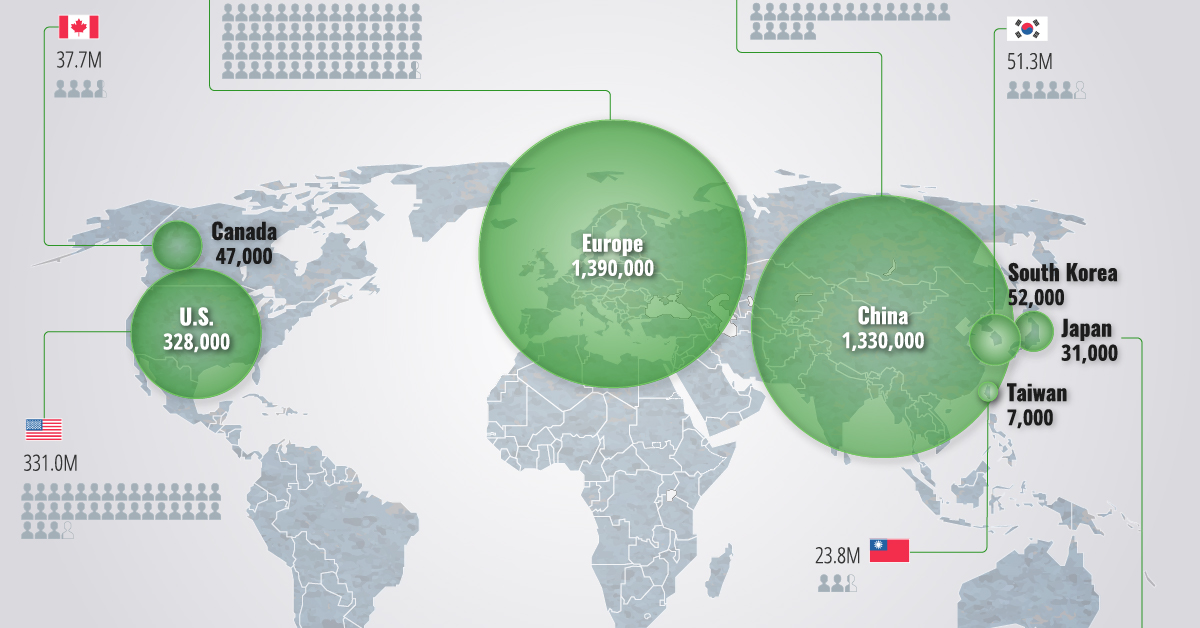
Global sales of electric vehicles (EVs) and plug-in hybrids (PHEV) surpassed 3 million for the first time in 2020, despite the economic headwinds imposed by COVID-19.
This visualization presents a geographical breakdown of these sales, revealing that over 80% were made in either Europe or China.
| Country | EV and Plug-in Hybrid Sales (2020) | Population (2020) |
|---|---|---|
| European Union (EU) | 1,390,000 | 747.6M |
| China | 1,330,000 | 1.4B |
| U.S. | 328,000 | 331.0M |
| South Korea | 52,000 | 51.3M |
| Canada | 47,000 | 37.7M |
| Japan | 31,000 | 126.5M |
| Taiwan | 7,000 | 23.8M |
| Other | 43,000 | - |
The EU was the largest market by a margin of 60,000 cars, but given China’s larger population, it’s likely the two will switch places in the near future.
Government Incentives Play a Key Role
Government incentives have boosted the transition to battery power in recent years. For example, many countries offer a buyer rebate, which effectively reduces the price a consumer pays for an EV or PHEV.
In Germany, buyers can receive a subsidy of $10,800 when purchasing an EV with a list price of less than $48,000. China also offers a rebate program, where buyers of an EV with a travel range of at least 186 miles can receive a subsidy of $2,500.
Consumers should be aware that these incentives are likely to diminish over time, especially as EVs become more mainstream. In January 2021, the Chinese government announced it would reduce its existing subsidies by 20%.
Will EV Sales in America Catch Up?
In a 2020 survey, 71% of U.S. drivers said they were interested in getting an EV—so why are sales so far behind Europe and China?
In that same survey, 50% of drivers cited a lack of public charging stations as the main factor for preventing them from buying an EV. Concerns like these have led the Biden administration to propose a more aggressive EV strategy, which includes the installation of at least 500,000 charging stations by 2030.
»If you found this post interesting, you might enjoy this graphic that compares electric vehicle highway ranges
Where does this data come from?
Source: EV Volumes, Worldometer
Notes: Final figures rounded


Datastream
Can You Calculate Your Daily Carbon Footprint?
Discover how the average person’s carbon footprint impacts the environment and learn how carbon credits can offset your carbon footprint.


The Briefing
- A person’s carbon footprint is substantial, with activities such as food consumption creating as much as 4,500 g of CO₂ emissions daily.
- By purchasing carbon credits from Carbon Streaming Corporation, you can offset your own emissions and fund positive climate action.
Your Everyday Carbon Footprint
While many large businesses and countries have committed to net-zero goals, it is essential to acknowledge that your everyday activities also contribute to global emissions.
In this graphic, sponsored by Carbon Streaming Corporation, we will explore how the choices we make and the products we use have a profound impact on our carbon footprint.
Carbon Emissions by Activity
Here are some of the daily activities and products of the average person and their carbon footprint, according to Clever Carbon.
| Household Activities & Products | CO2 Emissions (g) |
|---|---|
| 💡 Standard Light Bulb (100 watts, four hours) | 172 g |
| 📱 Mobile Phone Use (195 minutes per day)* | 189 g |
| 👕 Washing Machine (0.63 kWh) | 275 g |
| 🔥 Electric Oven (1.56 kWh) | 675 g |
| ♨️ Tumble Dryer (2.5 kWh) | 1,000 g |
| 🧻 Toilet Roll (2 ply) | 1,300 g |
| 🚿 Hot Shower (10 mins) | 2,000 g |
| 🚙 Daily Commute (one hour, by car) | 3,360 g |
| 🍽️ Average Daily Food Consumption (three meals of 600 calories) | 4,500 g |
| *Phone use based on yearly use of 69kg per the source, Reboxed | |
Your choice of transportation plays a crucial role in determining your carbon footprint. For instance, a 15 km daily commute to work on public transport generates an average of 1,464 g of CO₂ emissions. Compared to 3,360 g—twice the volume for a journey the same length by car.
By opting for more sustainable modes of transport, such as cycling, walking, or public transportation, you can significantly reduce your carbon footprint.
Addressing Your Carbon Footprint
One way to compensate for your emissions is by purchasing high-quality carbon credits.
Carbon credits are used to help fund projects that avoid, reduce or remove CO₂ emissions. This includes nature-based solutions such as reforestation and improved forest management, or technology-based solutions such as the production of biochar and carbon capture and storage (CCS).
While carbon credits offer a potential solution for individuals to help reduce global emissions, public awareness remains a significant challenge. A BCG-Patch survey revealed that only 34% of U.S. consumers are familiar with carbon credits, and only 3% have purchased them in the past.
About Carbon Streaming
By financing the creation or expansion of carbon projects, Carbon Streaming Corporation secures the rights to future carbon credits generated by these sustainable projects. You can then purchase these carbon credits to help fund climate solutions around the world and compensate for your own emissions.
Ready to get involved?
>> Learn more about purchasing carbon credits at Carbon Streaming

-

 Green2 weeks ago
Ranked: Top Countries by Total Forest Loss Since 2001
-

 Travel1 week ago
Ranked: The World’s Top Flight Routes, by Revenue
-

 Technology2 weeks ago
Ranked: Semiconductor Companies by Industry Revenue Share
-

 Money2 weeks ago
Which States Have the Highest Minimum Wage in America?
-

 Real Estate2 weeks ago
Ranked: The Most Valuable Housing Markets in America
-

 Markets2 weeks ago
Charted: Big Four Market Share by S&P 500 Audits
-

 AI2 weeks ago
The Stock Performance of U.S. Chipmakers So Far in 2024
-

 Misc2 weeks ago
Almost Every EV Stock is Down After Q1 2024