Technology
Visualizing the Current Landscape of the Fintech Industry
Visualizing the Current Landscape of the Fintech Industry
Since the introduction of the first credit card with a magnetic stripe in 1966, financial technology has come a long way. Silicon Valley may not have birthed the term “fintech”, but it has certainly helped catapult its applications into the mainstream.
Leveraging everything from basic apps to the blockchain, the changing dynamics of fintech are creating new investment opportunities everyday, growing its appetite with every new megadeal.
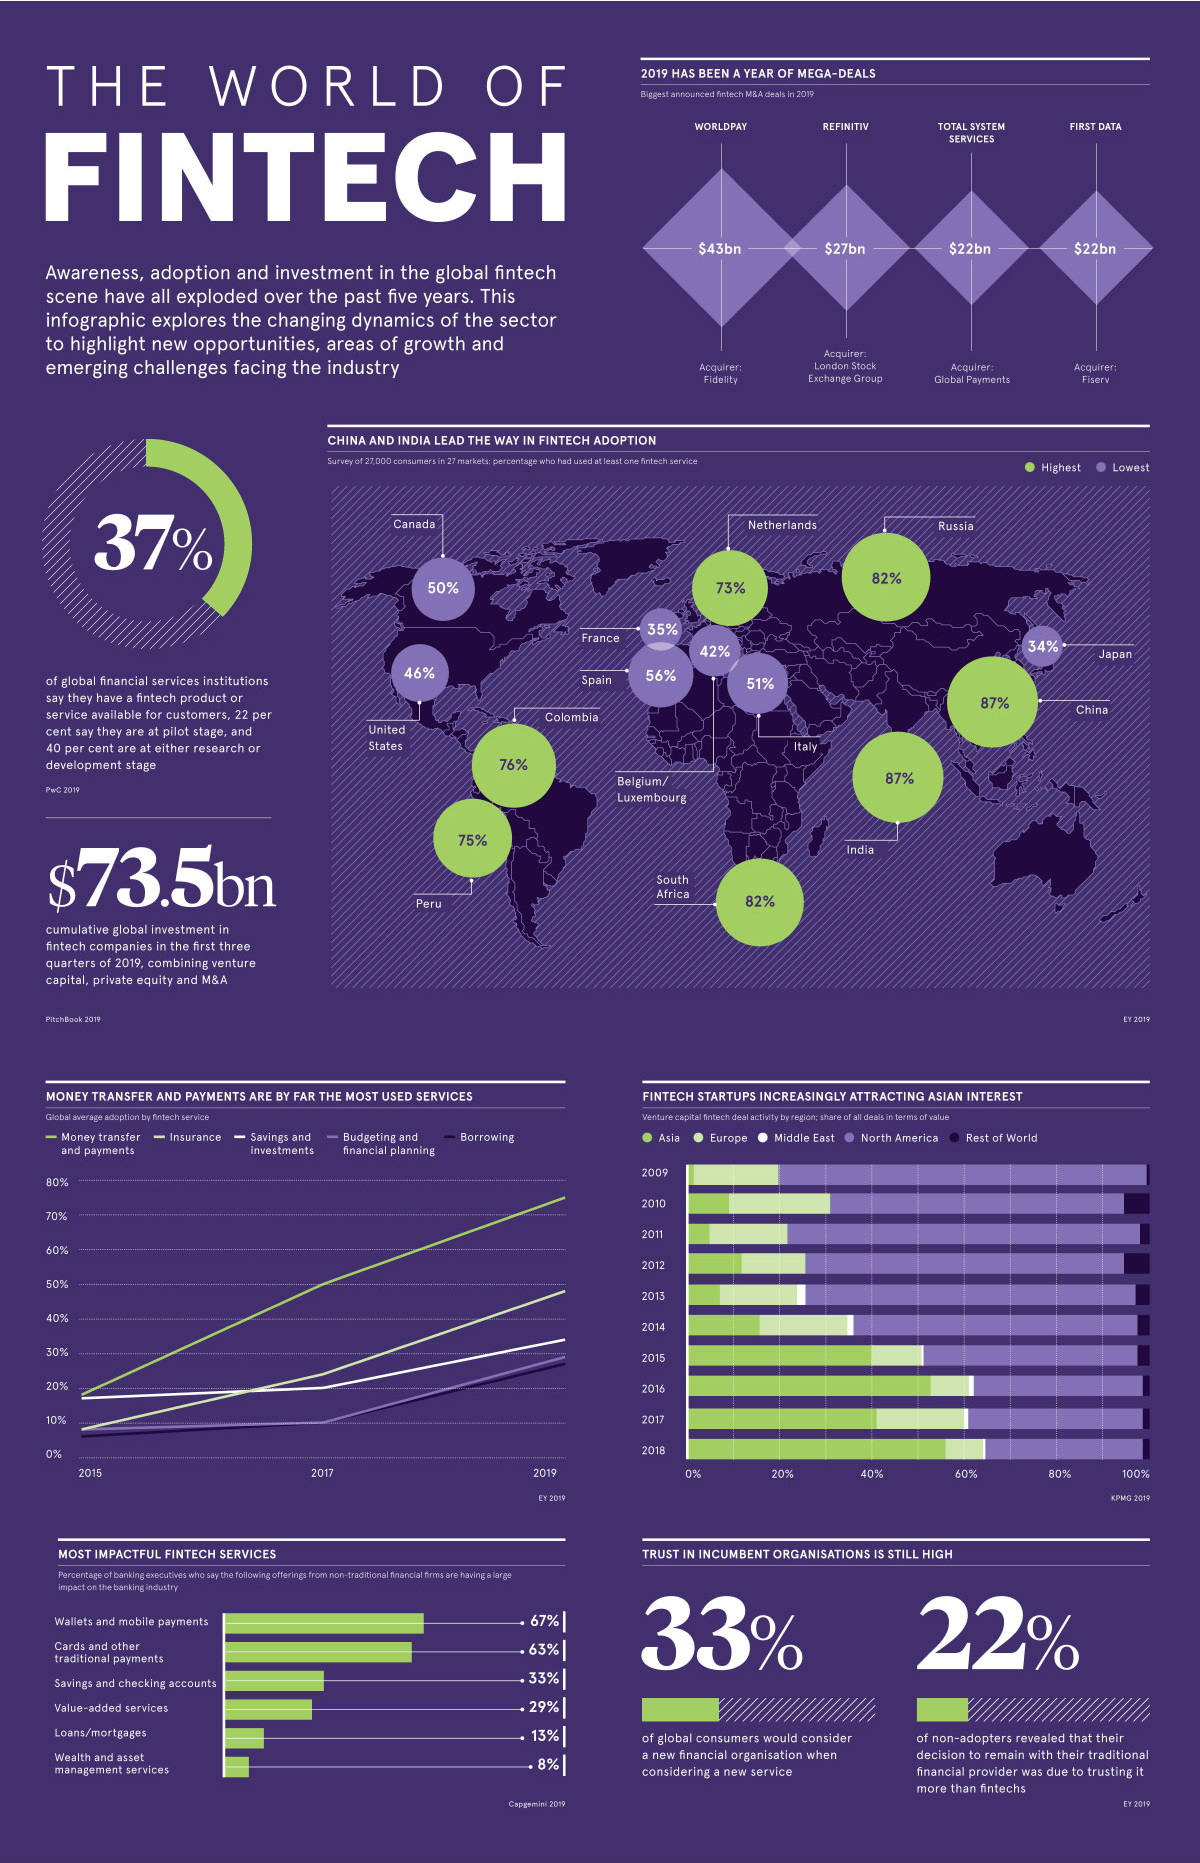
Today’s graphic from Raconteur highlights the global growth of the fintech industry, the services with the most staying power, and major M&A developments of the past year as traditional institutions scramble to deal with this digital disruption.
How Fintech Levels the Playing Field
Over the past five years, digitally-enabled financial technology services have delivered convenient and cheaper access to financial services to millions of consumers.
What draws consumers towards using fintech?
- Attractive rates and fees (27%)
- Easy access and account setup (20%)
- Variety of innovative products and services (18%)
- Better service quality and product features (12%)
This new implementation of technology is democratizing financial services for the masses, a strong contrast to accessing them through traditional brick-and-mortar institutions.
How Fintech Fares Across Borders
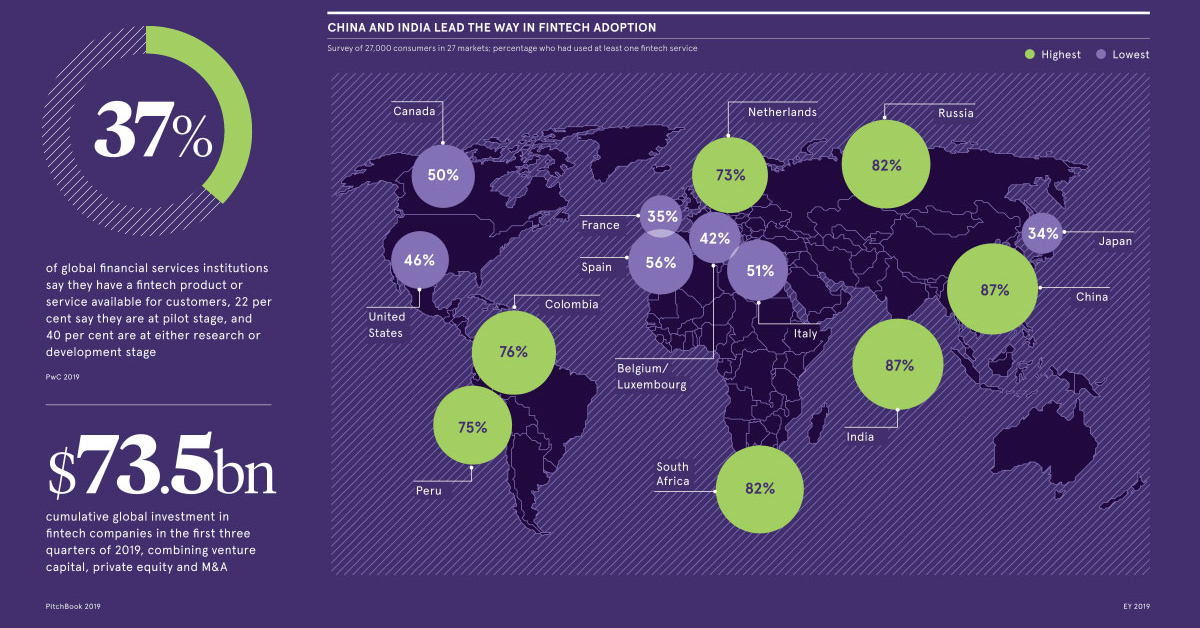
On average, 64% of the world’s digitally active population has used at least one fintech service. But China and India surpass this benchmark by a mile—in a survey of 27,000 consumers across 27 markets, both countries demonstrated a 87% fintech adoption rate.
Russia and South Africa are in close second, with 82% adoption respectively. On the other hand, France and Japan are tied at the low end of the spectrum with only 35% fintech adoption.
The trajectory of mobile payments and digital wallets in China can help put high Asian adoption rates in perspective. Thanks to services like Alipay and WeChat, 890 million unique mobile payment users are essentially transforming China from a cash economy to a digital one.
Which Services Have Caught Consumer Attention?
Just like “Googling” is synonymous with looking up information online, the term “Venmo-ing” has become an American verb for paying someone back via a digital wallet.
That’s why it’s no surprise that money transfer and payments are by far the most rapidly growing fintech services, shooting up from 18% to 75% global adoption in just four years. Here’s how global average adoption rates differ by fintech service, across time:
| Fintech Category | 2015 | 2017 | 2019 |
|---|---|---|---|
| 💸 Money transfer and payments | 18% | 50% | 75% |
| 💰 Savings and investments | 17% | 20% | 34% |
| 📋 Budgeting and financial planning | 8% | 10% | 29% |
| 🛡️ Insurance | 8% | 24% | 48% |
| 💳 Borrowing | 6% | 10% | 27% |
Source: EY Global Fintech Adoption Index 2019
Insurtech has steadily gained traction in the market. Digital insurance solutions provide personalized and on-demand coverage plans for clients, using bots and machine learning to assess risk levels. As a result, this sub-segment has been attracting large funding rounds due to the time—and money—it helps free up for firms.
According to CapGemini, incumbents in the financial industry see wallets and mobile payments from fintech providers as the most significant offerings impacting their companies. That may be why they’re resorting to big moves to protect their business.
Deals and More Deals
Major financial institutions made some serious plays in 2019, in the way of mergers and acquisitions of fintech companies:
- FIS bought the payments processing company Worldpay for $35 billion, valuing the company at $43 billion when debt is included. (Reuters)
- The London Stock Exchange Group plans to acquire financial markets data provider Refinitiv for $27 billion, in the hopes of rivaling Bloomberg. (Reuters)
- Global Payments bought the payments processing company Total System Services for $21.5 billion, planning to provide services to over 1,300 financial institutions. (Bloomberg)
- Fiserv acquired payments processing company First Data for $22 billion—the two companies combined are a backbone of Wall Street’s financial technology. (WSJ)
- Visa purchased the payments authentication company Plaid for $5.3 billion in January 2020, in hopes of strengthening its relations with financial institutions. (CNBC)
As billions of dollars exchange hands, it’s been noted that many of these plays were made by established incumbents to curb the threat posed by fintech startups.
At the same time, however, it’s also clear that traditional institutions want to tap into what fintech startups are doing right.


Technology
Ranked: Semiconductor Companies by Industry Revenue Share
Nvidia is coming for Intel’s crown. Samsung is losing ground. AI is transforming the space. We break down revenue for semiconductor companies.


Semiconductor Companies by Industry Revenue Share
This was originally posted on our Voronoi app. Download the app for free on Apple or Android and discover incredible data-driven charts from a variety of trusted sources.
Did you know that some computer chips are now retailing for the price of a new BMW?
As computers invade nearly every sphere of life, so too have the chips that power them, raising the revenues of the businesses dedicated to designing them.
But how did various chipmakers measure against each other last year?
We rank the biggest semiconductor companies by their percentage share of the industry’s revenues in 2023, using data from Omdia research.
Which Chip Company Made the Most Money in 2023?
Market leader and industry-defining veteran Intel still holds the crown for the most revenue in the sector, crossing $50 billion in 2023, or 10% of the broader industry’s topline.
All is not well at Intel, however, with the company’s stock price down over 20% year-to-date after it revealed billion-dollar losses in its foundry business.
| Rank | Company | 2023 Revenue | % of Industry Revenue |
|---|---|---|---|
| 1 | Intel | $51B | 9.4% |
| 2 | NVIDIA | $49B | 9.0% |
| 3 | Samsung Electronics | $44B | 8.1% |
| 4 | Qualcomm | $31B | 5.7% |
| 5 | Broadcom | $28B | 5.2% |
| 6 | SK Hynix | $24B | 4.4% |
| 7 | AMD | $22B | 4.1% |
| 8 | Apple | $19B | 3.4% |
| 9 | Infineon Tech | $17B | 3.2% |
| 10 | STMicroelectronics | $17B | 3.2% |
| 11 | Texas Instruments | $17B | 3.1% |
| 12 | Micron Technology | $16B | 2.9% |
| 13 | MediaTek | $14B | 2.6% |
| 14 | NXP | $13B | 2.4% |
| 15 | Analog Devices | $12B | 2.2% |
| 16 | Renesas Electronics Corporation | $11B | 1.9% |
| 17 | Sony Semiconductor Solutions Corporation | $10B | 1.9% |
| 18 | Microchip Technology | $8B | 1.5% |
| 19 | Onsemi | $8B | 1.4% |
| 20 | KIOXIA Corporation | $7B | 1.3% |
| N/A | Others | $126B | 23.2% |
| N/A | Total | $545B | 100% |
Note: Figures are rounded. Totals and percentages may not sum to 100.
Meanwhile, Nvidia is very close to overtaking Intel, after declaring $49 billion of topline revenue for 2023. This is more than double its 2022 revenue ($21 billion), increasing its share of industry revenues to 9%.
Nvidia’s meteoric rise has gotten a huge thumbs-up from investors. It became a trillion dollar stock last year, and broke the single-day gain record for market capitalization this year.
Other chipmakers haven’t been as successful. Out of the top 20 semiconductor companies by revenue, 12 did not match their 2022 revenues, including big names like Intel, Samsung, and AMD.
The Many Different Types of Chipmakers
All of these companies may belong to the same industry, but they don’t focus on the same niche.
According to Investopedia, there are four major types of chips, depending on their functionality: microprocessors, memory chips, standard chips, and complex systems on a chip.
Nvidia’s core business was once GPUs for computers (graphics processing units), but in recent years this has drastically shifted towards microprocessors for analytics and AI.
These specialized chips seem to be where the majority of growth is occurring within the sector. For example, companies that are largely in the memory segment—Samsung, SK Hynix, and Micron Technology—saw peak revenues in the mid-2010s.

-

 Real Estate2 weeks ago
Visualizing America’s Shortage of Affordable Homes
-

 Technology1 week ago
Ranked: Semiconductor Companies by Industry Revenue Share
-

 Money1 week ago
Which States Have the Highest Minimum Wage in America?
-

 Real Estate1 week ago
Ranked: The Most Valuable Housing Markets in America
-

 Business2 weeks ago
Charted: Big Four Market Share by S&P 500 Audits
-

 AI2 weeks ago
The Stock Performance of U.S. Chipmakers So Far in 2024
-

 Misc2 weeks ago
Almost Every EV Stock is Down After Q1 2024
-

 Money2 weeks ago
Where Does One U.S. Tax Dollar Go?