Markets
All of the World’s Exports by Country, in One Chart
Article/Editing:
All of the World’s Exports by Country, in One Chart
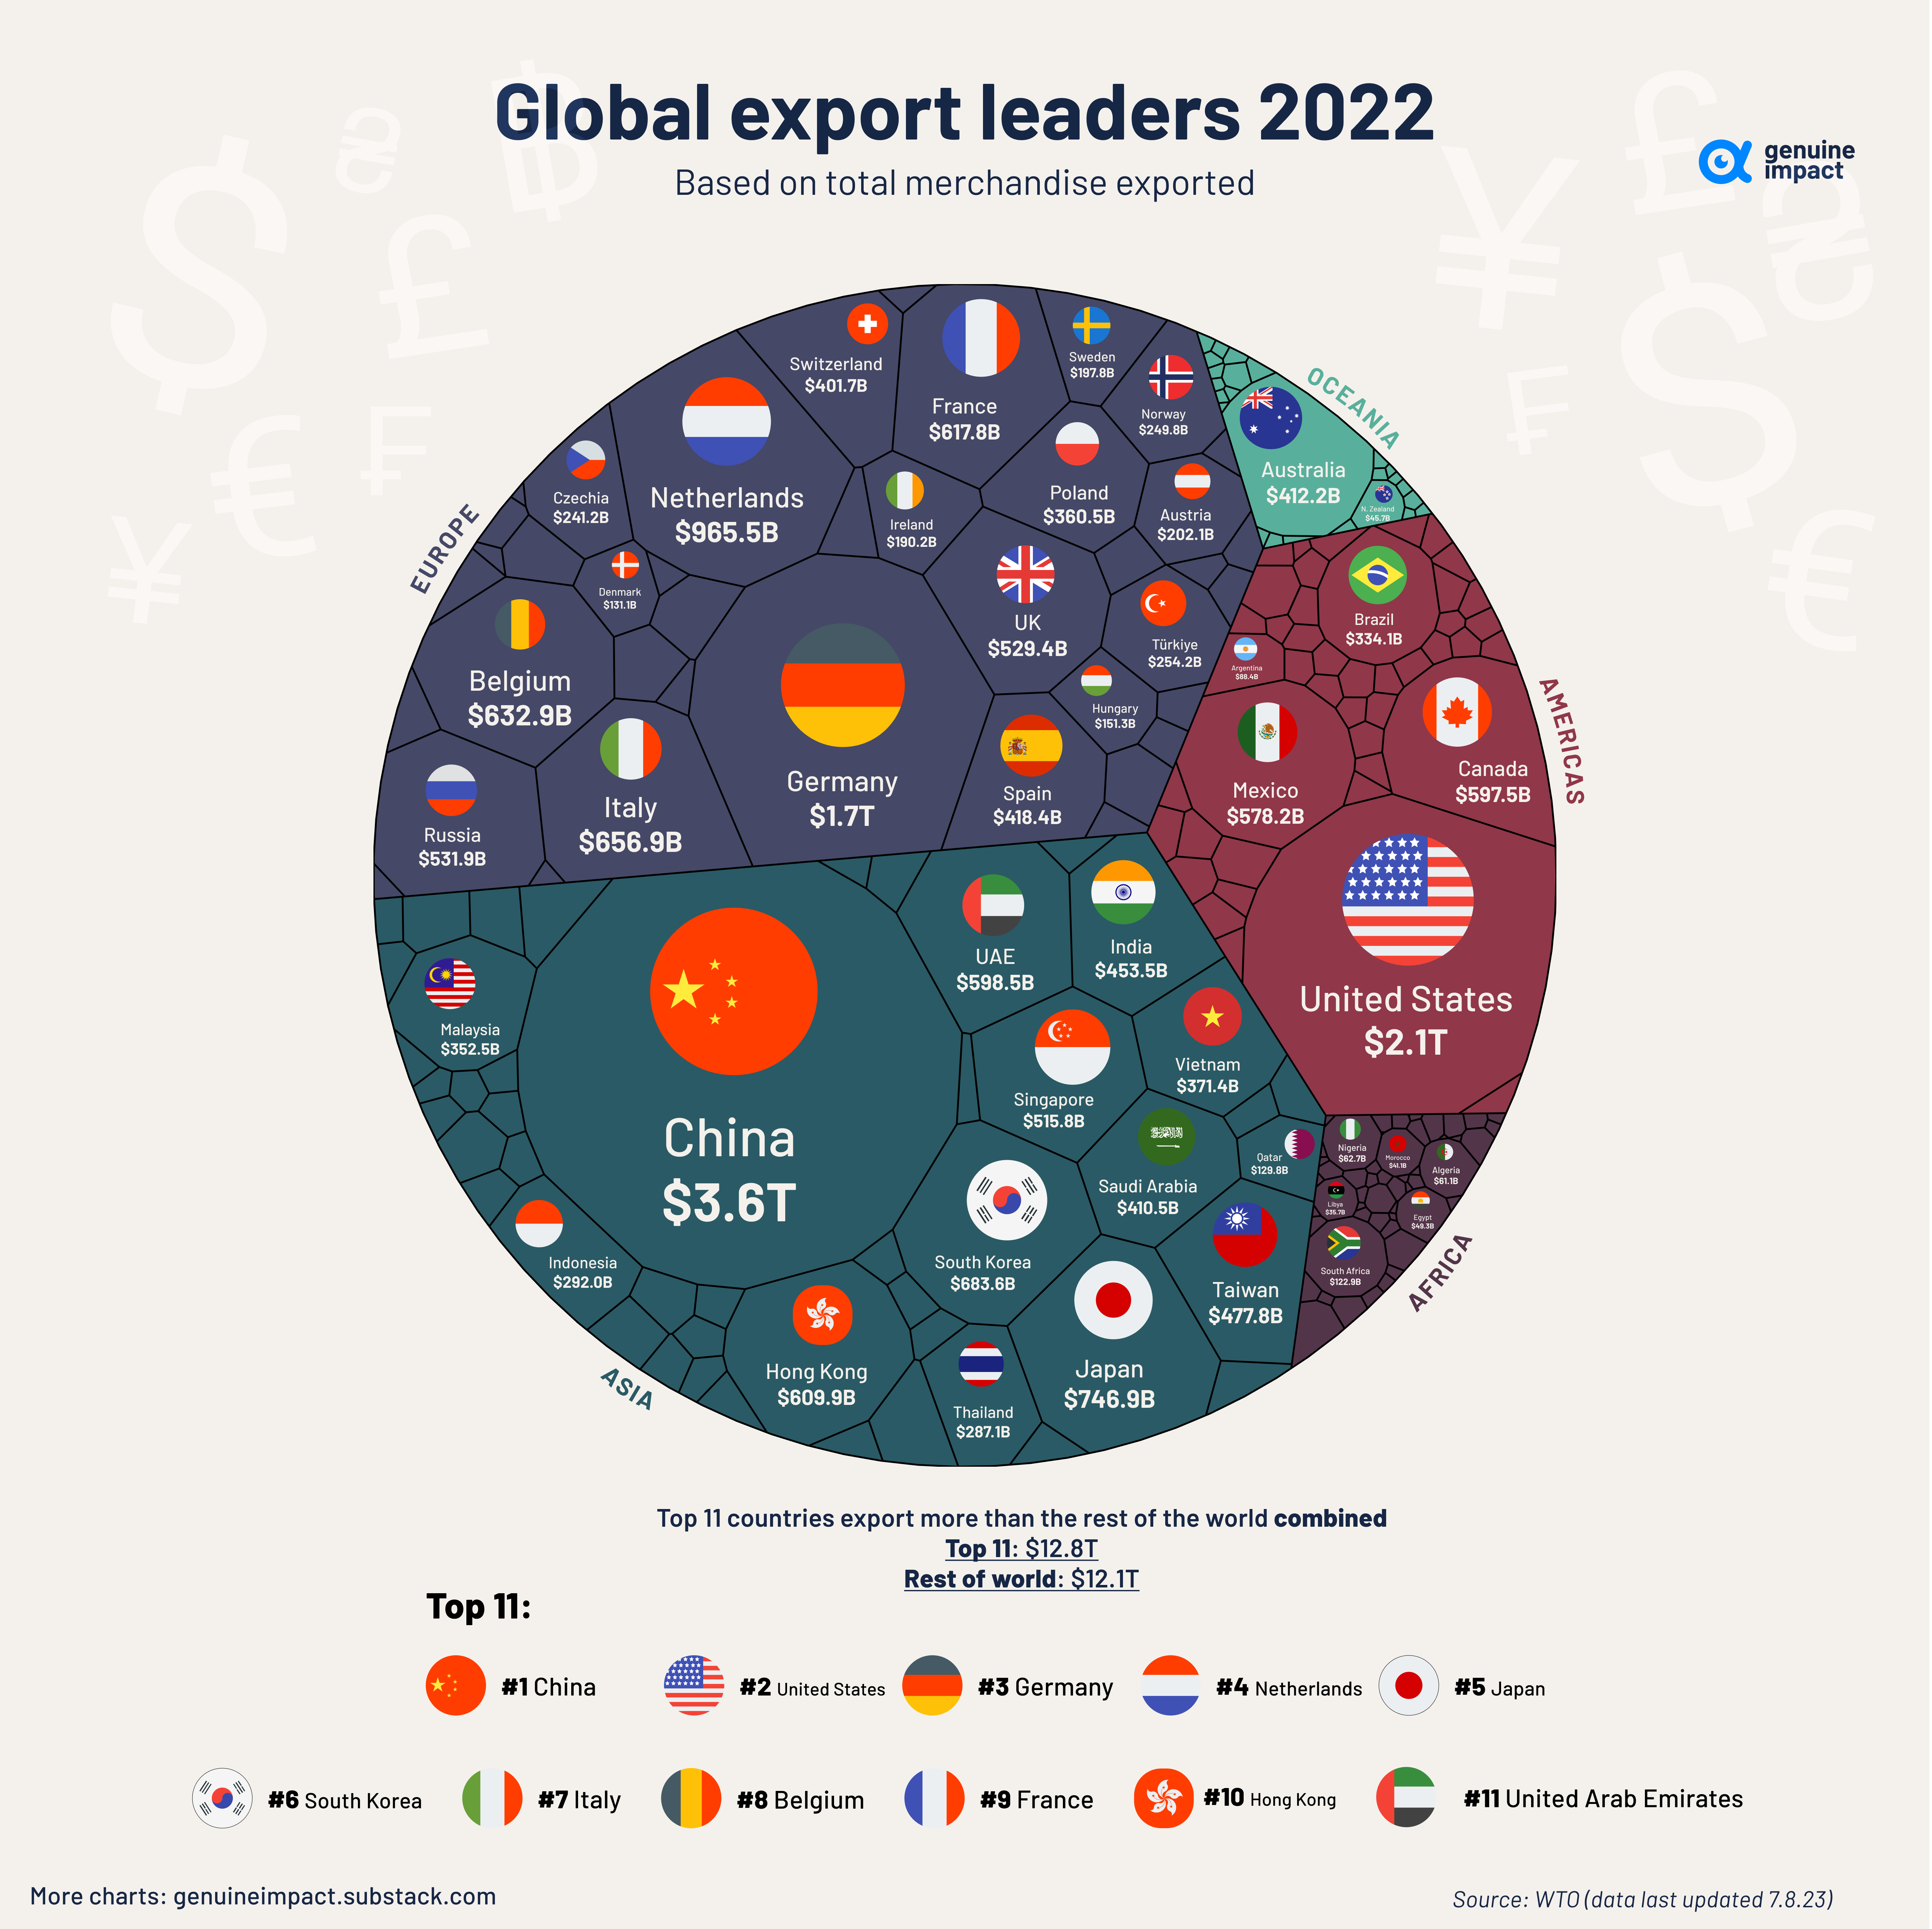
In 2022, the total export value of global goods reached nearly $25 trillion.
With the evolution of international trade, the effects of globalization, and progress in technology, global trade has increased by around 300% over the last 20 years.
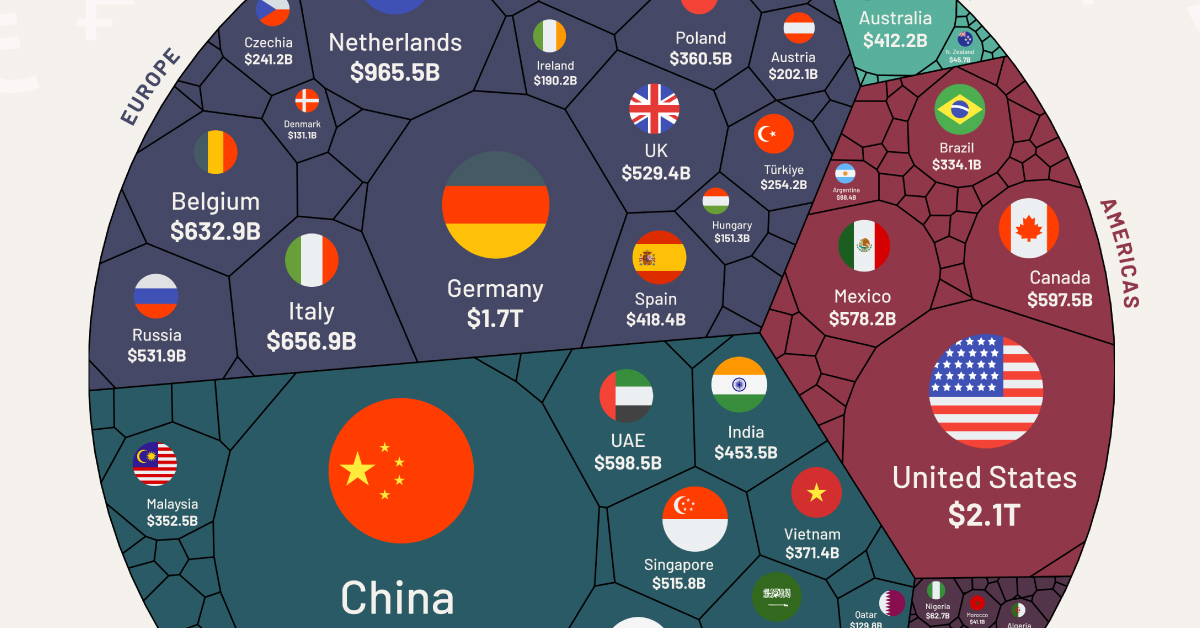
This visualization by Truman Du uses data from the World Trade Organization (WTO) to chart the world’s top exporters by country.
China is Still the “World’s Factory”
The world’s largest 11 exporters shipped out $12.8 trillion of goods in 2022, more than the rest of the world combined ($12.1 trillion).
The list is headed by China, with $3.6 trillion or 14% of total exports. The country has been the largest exporter of goods in the world since 2009.
| Top 11 | Country | Exports (USD) |
|---|---|---|
| 1 | 🇨🇳 China | $3.6T |
| 2 | 🇺🇸 U.S. | $2.1T |
| 3 | 🇩🇪 Germany | $1.7T |
| 4 | 🇳🇱 Netherlands | $965.5B |
| 5 | 🇯🇵 Japan | $746.9B |
| 6 | 🇰🇷 South Korea | $683.6B |
| 7 | 🇮🇹 Italy | $656.9B |
| 8 | 🇧🇪 Belgium | $632.9B |
| 9 | 🇫🇷 France | $617.8B |
| 10 | 🇭🇰 Hong Kong | $609.9B |
| 11 | 🇦🇪 United Arab Emirates | $598.5B |
In 2022, the top products exported from China by value were phones (including smartphones), computers, optical readers, integrated circuits, solar power diodes, and semiconductors.
Two of China’s primary trading partners are neighboring countries Japan and South Korea.
Mexico Surpasses China as America’s Largest Trading Partner
China has built up significant trade relations with the European Union and the United States, two of the world’s largest markets for goods.
However, recent trade tensions have led to China losing its status as the United States’ biggest trading partner in 2023.
Mexico has now overtaken China as the largest seller to the United States. This shift in trade dynamics is part of a broader effort by the U.S. to import goods from closer to home and reduce its dependence on geopolitical rivals.
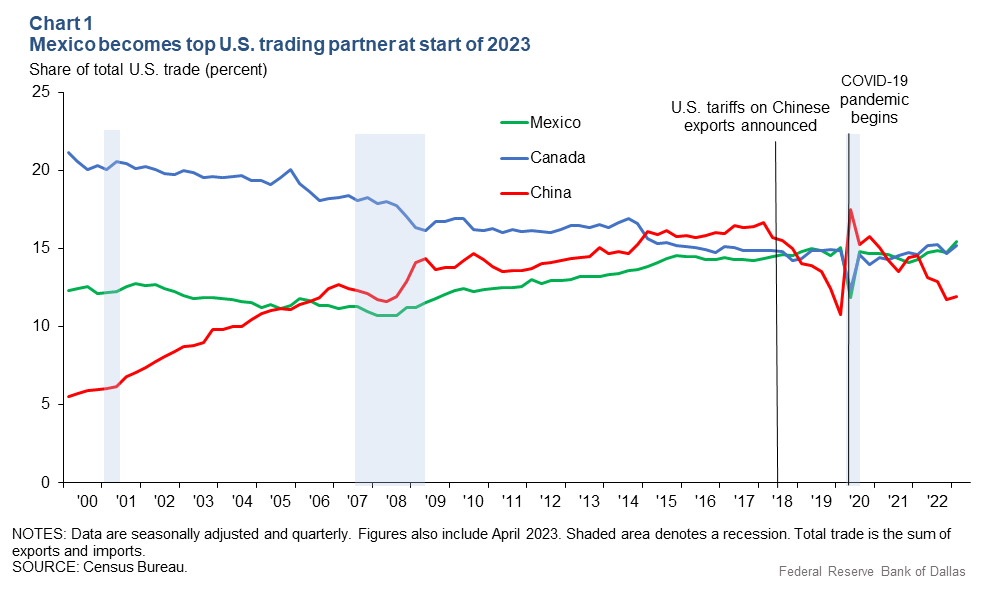
The U.S. itself is the world’s second largest goods exporter, with over $2 trillion annually.
Canada was the largest purchaser of U.S. exports in 2022, accounting for 17% of total exports, followed by Mexico, China, Japan, and the United Kingdom.
The top exports of the United States are refined petroleum, petroleum gas, crude petroleum, cars, and integrated circuits.
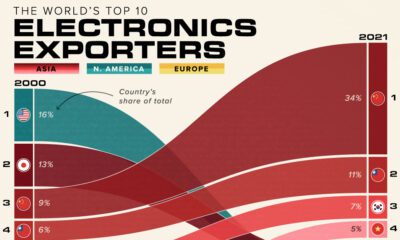
The Regional View of Exports by Country
From a regional perspective, it’s clear Asia dominates the trading market with over 36% of the total exports, followed by Europe with 34%.
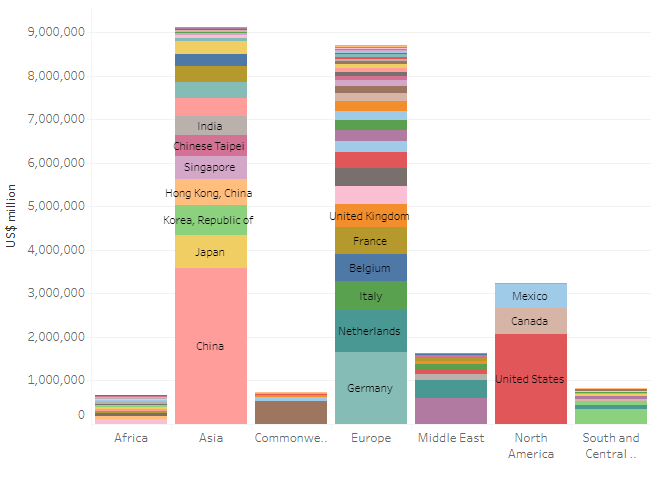
Source: World Trade Organization
While Asian, European, and North American countries have manufactured and technology products among their main exports, African and South American countries mostly export commodities such as oil, gold, diamonds, cocoa, timber, and precious metals.
A New Era of Deglobalization?
International trade grew immensely at the beginning of the 21st century, from $15.6 trillion in 2001 to $40.7 trillion in 2008.
Since then, protectionist trade policies such as taxes on foreign goods and import quotas have increased by 663%. Similarly, global trade as a percent of GDP has also stalled out, peaking in 2008 and going sideways ever since.
Despite many countries reducing their interdependence and integration in the post-COVID era, global exports are still set to grow by 70% between 2020 and 2030, reaching $29.7 trillion by 2030, according to Standard Chartered.

This article was published as a part of Visual Capitalist's Creator Program, which features data-driven visuals from some of our favorite Creators around the world.


Markets
Mapped: Europe’s GDP Per Capita, by Country
Which European economies are richest on a GDP per capita basis? This map shows the results for 44 countries across the continent.


Mapped: Europe’s GDP Per Capita, by Country (2024)
This was originally posted on our Voronoi app. Download the app for free on iOS or Android and discover incredible data-driven charts from a variety of trusted sources.
Europe is home to some of the largest and most sophisticated economies in the world. But how do countries in the region compare with each other on a per capita productivity basis?
In this map, we show Europe’s GDP per capita levels across 44 nations in current U.S. dollars. Data for this visualization and article is sourced from the International Monetary Fund (IMF) via their DataMapper tool, updated April 2024.
Europe’s Richest and Poorest Nations, By GDP Per Capita
Luxembourg, Ireland, and Switzerland, lead the list of Europe’s richest nations by GDP per capita, all above $100,000.
| Rank | Country | GDP Per Capita (2024) |
|---|---|---|
| 1 | 🇱🇺 Luxembourg | $131,380 |
| 2 | 🇮🇪 Ireland | $106,060 |
| 3 | 🇨🇭 Switzerland | $105,670 |
| 4 | 🇳🇴 Norway | $94,660 |
| 5 | 🇮🇸 Iceland | $84,590 |
| 6 | 🇩🇰 Denmark | $68,900 |
| 7 | 🇳🇱 Netherlands | $63,750 |
| 8 | 🇸🇲 San Marino | $59,410 |
| 9 | 🇦🇹 Austria | $59,230 |
| 10 | 🇸🇪 Sweden | $58,530 |
| 11 | 🇧🇪 Belgium | $55,540 |
| 12 | 🇫🇮 Finland | $55,130 |
| 13 | 🇩🇪 Germany | $54,290 |
| 14 | 🇬🇧 UK | $51,070 |
| 15 | 🇫🇷 France | $47,360 |
| 16 | 🇦🇩 Andorra | $44,900 |
| 17 | 🇲🇹 Malta | $41,740 |
| 18 | 🇮🇹 Italy | $39,580 |
| 19 | 🇨🇾 Cyprus | $37,150 |
| 20 | 🇪🇸 Spain | $34,050 |
| 21 | 🇸🇮 Slovenia | $34,030 |
| 22 | 🇪🇪 Estonia | $31,850 |
| 23 | 🇨🇿 Czech Republic | $29,800 |
| 24 | 🇵🇹 Portugal | $28,970 |
| 25 | 🇱🇹 Lithuania | $28,410 |
| 26 | 🇸🇰 Slovakia | $25,930 |
| 27 | 🇱🇻 Latvia | $24,190 |
| 28 | 🇬🇷 Greece | $23,970 |
| 29 | 🇭🇺 Hungary | $23,320 |
| 30 | 🇵🇱 Poland | $23,010 |
| 31 | 🇭🇷 Croatia | $22,970 |
| 32 | 🇷🇴 Romania | $19,530 |
| 33 | 🇧🇬 Bulgaria | $16,940 |
| 34 | 🇷🇺 Russia | $14,390 |
| 35 | 🇹🇷 Türkiye | $12,760 |
| 36 | 🇲🇪 Montenegro | $12,650 |
| 37 | 🇷🇸 Serbia | $12,380 |
| 38 | 🇦🇱 Albania | $8,920 |
| 39 | 🇧🇦 Bosnia & Herzegovina | $8,420 |
| 40 | 🇲🇰 North Macedonia | $7,690 |
| 41 | 🇧🇾 Belarus | $7,560 |
| 42 | 🇲🇩 Moldova | $7,490 |
| 43 | 🇽🇰 Kosovo | $6,390 |
| 44 | 🇺🇦 Ukraine | $5,660 |
| N/A | 🇪🇺 EU Average | $44,200 |
Note: Figures are rounded.
Three Nordic countries (Norway, Iceland, Denmark) also place highly, between $70,000-90,000. Other Nordic peers, Sweden and Finland rank just outside the top 10, between $55,000-60,000.
Meanwhile, Europe’s biggest economies in absolute terms, Germany, UK, and France, rank closer to the middle of the top 20, with GDP per capitas around $50,000.
Finally, at the end of the scale, Eastern Europe as a whole tends to have much lower per capita GDPs. In that group, Ukraine ranks last, at $5,660.
A Closer Look at Ukraine
For a broader comparison, Ukraine’s per capita GDP is similar to Iran ($5,310), El Salvador ($5,540), and Guatemala ($5,680).
According to experts, Ukraine’s economy has historically underperformed to expectations. After the fall of the Berlin Wall, the economy contracted for five straight years. Its transition to a Western, liberalized economic structure was overshadowed by widespread corruption, a limited taxpool, and few revenue sources.
Politically, its transformation from authoritarian regime to civil democracy has proved difficult, especially when it comes to institution building.
Finally, after the 2022 invasion of the country, Ukraine’s GDP contracted by 30% in a single year—the largest loss since independence. Large scale emigration—to the tune of six million refugees—is also playing a role.
Despite these challenges, the country’s economic growth has somewhat stabilized while fighting continues.

-

 Healthcare4 days ago
What Causes Preventable Child Deaths?
-

 voronoi2 weeks ago
Best Visualizations of April on the Voronoi App
-

 Wealth2 weeks ago
Charted: Which Country Has the Most Billionaires in 2024?
-

 Markets1 week ago
The Top Private Equity Firms by Country
-

 Jobs1 week ago
The Best U.S. Companies to Work for According to LinkedIn
-

 Economy1 week ago
Ranked: The Top 20 Countries in Debt to China
-

 Politics1 week ago
Charted: Trust in Government Institutions by G7 Countries
-

 Energy1 week ago
Mapped: The Age of Energy Projects in Interconnection Queues, by State