Demographics
Where Will the World’s Next 1,000 Babies Be Born?
Article/Editing:
View a higher resolution version of this map.
Where Will the World’s Next 1,000 Babies Be Born?
View a higher resolution version of this map.
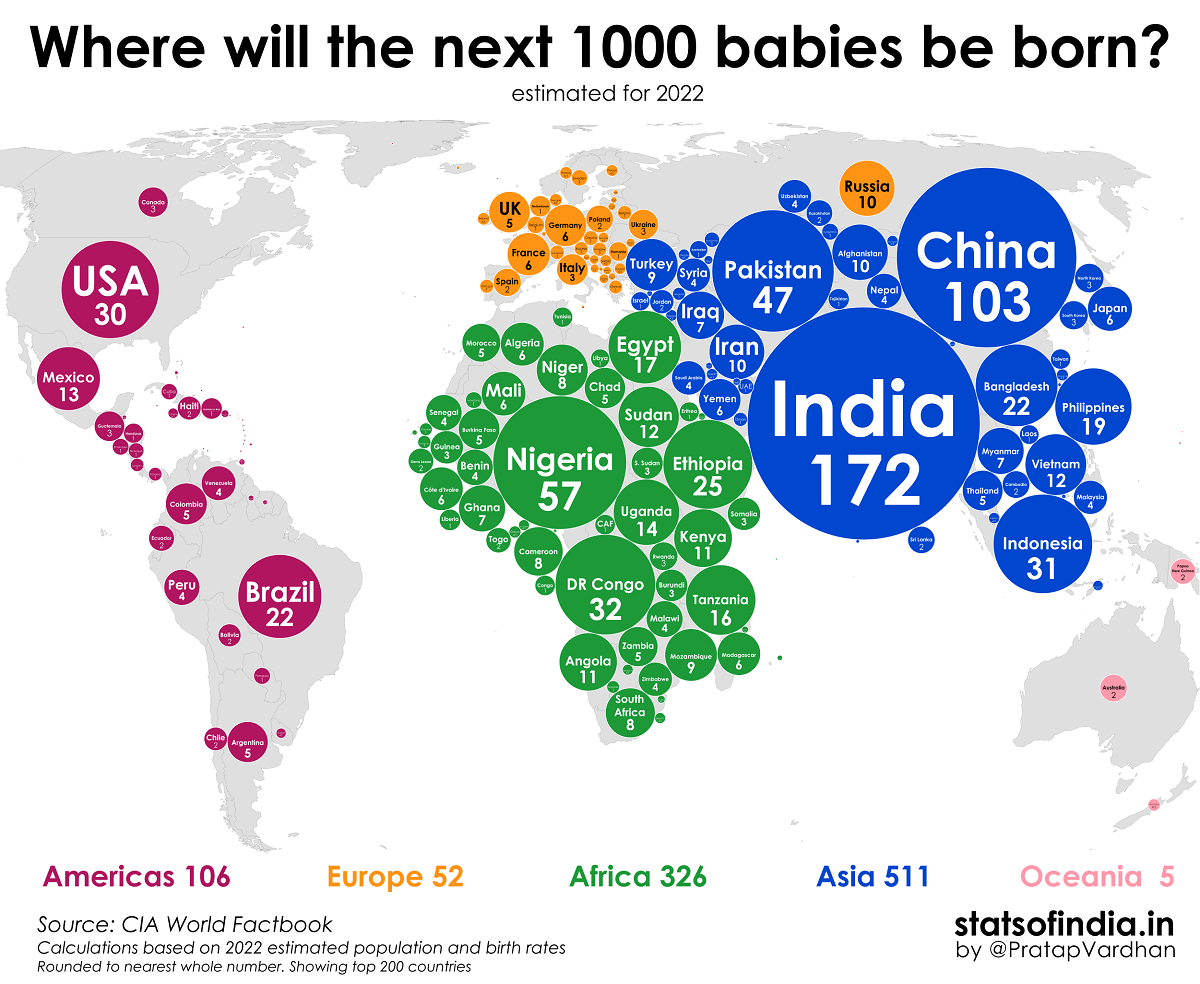
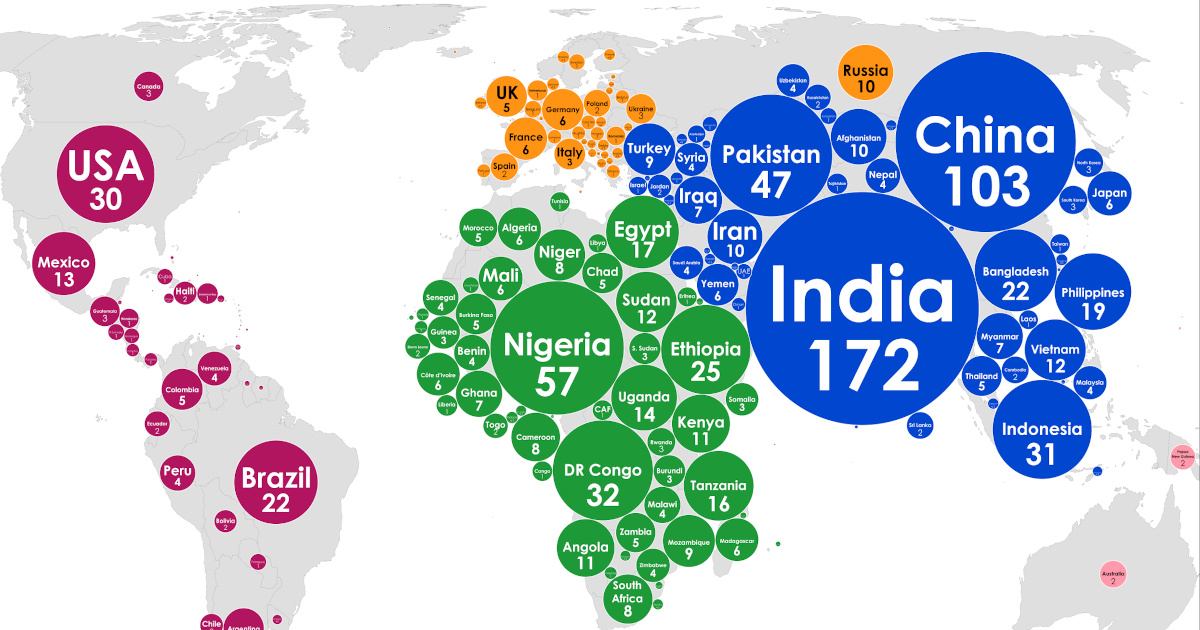
Every four minutes, approximately 1,000 babies are born across the globe. But in which countries are these babies the most statistically likely to come from?
Using data from the CIA World Factbook, this graphic by Pratap Vardhan (Stats of India) paints a picture of the world’s demographics, showing which countries are most likely to welcome the next 1,000 babies based on population and birth rates as of 2022 estimates.
The Next 1,000 Babies, By Country
Considering India has a population of nearly 1.4 billion, it’s fairly unsurprising that it ranks first on the list. Of every 1,000 babies born, the South Asian country accounts for roughly 172 of them.
| Place | Region | Births Per 1,000 Global Babies |
|---|---|---|
| 🇮🇳 India | Asia | 171.62 |
| 🇨🇳 China | Asia | 102.84 |
| 🇳🇬 Nigeria | Africa | 56.50 |
| 🇵🇰 Pakistan | Asia | 47.23 |
| 🇨🇩 Congo, Democratic Republic of the | Africa | 31.90 |
| 🇮🇩 Indonesia | Asia | 31.20 |
| 🇺🇸 United States | Americas | 30.42 |
| 🇪🇹 Ethiopia | Africa | 25.44 |
| 🇧🇷 Brazil | Americas | 22.27 |
| 🇧🇩 Bangladesh | Asia | 21.52 |
| 🇵🇭 Philippines | Asia | 18.75 |
| 🇪🇬 Egypt | Africa | 16.98 |
| 🇹🇿 Tanzania | Africa | 15.61 |
| 🇺🇬 Uganda | Africa | 13.89 |
| 🇲🇽 Mexico | Americas | 12.85 |
| 🇻🇳 Vietnam | Asia | 11.96 |
| 🇸🇩 Sudan | Africa | 11.79 |
| 🇰🇪 Kenya | Africa | 10.82 |
| 🇦🇴 Angola | Africa | 10.68 |
| 🇦🇫 Afghanistan | Asia | 9.98 |
| 🇷🇺 Russia | Europe | 9.85 |
| 🇮🇷 Iran | Asia | 9.73 |
| 🇲🇿 Mozambique | Africa | 8.72 |
| 🇹🇷 Turkey | Asia | 8.71 |
| 🇳🇪 Niger | Africa | 8.46 |
| 🇿🇦 South Africa | Africa | 7.84 |
| 🇨🇲 Cameroon | Africa | 7.65 |
| 🇮🇶 Iraq | Asia | 7.34 |
| 🇬🇭 Ghana | Africa | 6.94 |
| 🇲🇲 Myanmar | Asia | 6.90 |
| 🇯🇵 Japan | Asia | 6.34 |
| 🇲🇱 Mali | Africa | 6.25 |
| 🇩🇿 Algeria | Africa | 6.01 |
| 🇨🇮 Cote d'Ivoire | Africa | 5.97 |
| 🇲🇬 Madagascar | Africa | 5.93 |
| 🇫🇷 France | Europe | 5.85 |
| 🇩🇪 Germany | Europe | 5.62 |
| 🇾🇪 Yemen | Asia | 5.61 |
| 🇨🇴 Colombia | Americas | 5.48 |
| 🇧🇫 Burkina Faso | Africa | 5.41 |
| 🇬🇧 United Kingdom | Europe | 5.37 |
| 🇹🇩 Chad | Africa | 5.34 |
| 🇦🇷 Argentina | Americas | 5.29 |
| 🇹🇭 Thailand | Asia | 5.19 |
| 🇿🇲 Zambia | Africa | 5.03 |
| 🇲🇦 Morocco | Africa | 4.70 |
| 🇲🇼 Malawi | Africa | 4.27 |
| 🇧🇯 Benin | Africa | 4.16 |
| 🇸🇳 Senegal | Africa | 4.15 |
| 🇵🇪 Peru | Americas | 4.08 |
| 🇳🇵 Nepal | Asia | 3.95 |
| 🇻🇪 Venezuela | Americas | 3.78 |
| 🇸🇦 Saudi Arabia | Asia | 3.69 |
| 🇿🇼 Zimbabwe | Africa | 3.67 |
| 🇲🇾 Malaysia | Asia | 3.62 |
| 🇸🇾 Syria | Asia | 3.60 |
| 🇺🇿 Uzbekistan | Asia | 3.55 |
| 🇬🇳 Guinea | Africa | 3.47 |
| 🇸🇴 Somalia | Africa | 3.45 |
| 🇧🇮 Burundi | Africa | 3.28 |
| 🇸🇸 South Sudan | Africa | 3.19 |
| 🇮🇹 Italy | Europe | 3.12 |
| 🇬🇹 Guatemala | Americas | 2.90 |
| 🇺🇦 Ukraine | Europe | 2.88 |
| 🇨🇦 Canada | Americas | 2.85 |
| 🇰🇵 Korea, North | Asia | 2.71 |
| 🇰🇷 Korea, South | Asia | 2.63 |
| 🇷🇼 Rwanda | Africa | 2.56 |
| 🇪🇸 Spain | Europe | 2.47 |
| 🇵🇱 Poland | Europe | 2.38 |
| 🇰🇭 Cambodia | Asia | 2.37 |
| 🇦🇺 Australia | Oceania | 2.36 |
| 🇱🇰 Sri Lanka | Asia | 2.35 |
| 🇰🇿 Kazakhstan | Asia | 2.19 |
| 🇪🇨 Ecuador | Americas | 2.09 |
| 🇸🇱 Sierra Leone | Africa | 2.06 |
| 🇵🇬 Papua New Guinea | Oceania | 2.04 |
| 🇹🇬 Togo | Africa | 1.99 |
| 🇯🇴 Jordan | Asia | 1.82 |
| 🇭🇹 Haiti | Americas | 1.76 |
| 🇨🇱 Chile | Americas | 1.73 |
| 🇧🇴 Bolivia | Americas | 1.65 |
| 🇱🇷 Liberia | Africa | 1.44 |
| 🇩🇴 Dominican Republic | Americas | 1.42 |
| 🇳🇱 Netherlands | Europe | 1.40 |
| 🇹🇯 Tajikistan | Asia | 1.39 |
| 🇨🇫 Central African Republic | Africa | 1.31 |
| 🇨🇬 Congo, Republic of the | Africa | 1.30 |
| 🇹🇼 Taiwan | Asia | 1.28 |
| 🇹🇳 Tunisia | Africa | 1.28 |
| 🇭🇳 Honduras | Americas | 1.24 |
| 🇪🇷 Eritrea | Africa | 1.23 |
| 🇷🇴 Romania | Europe | 1.19 |
| 🇱🇦 Laos | Asia | 1.19 |
| 🇮🇱 Israel | Asia | 1.14 |
| 🇱🇾 Libya | Africa | 1.13 |
| 🇦🇿 Azerbaijan | Asia | 1.03 |
| 🇧🇪 Belgium | Europe | 0.95 |
| 🇵🇾 Paraguay | Americas | 0.88 |
| 🇰🇬 Kyrgyzstan | Asia | 0.87 |
| 🇸🇻 El Salvador | Americas | 0.86 |
| 🇲🇷 Mauritania | Africa | 0.86 |
| 🇸🇪 Sweden | Europe | 0.83 |
| 🇨🇺 Cuba | Americas | 0.82 |
| 🇦🇪 United Arab Emirates | Asia | 0.79 |
| 🇳🇮 Nicaragua | Americas | 0.76 |
| 🇹🇲 Turkmenistan | Asia | 0.72 |
| 🇨🇿 Czechia | Europe | 0.68 |
| 🇨🇭 Switzerland | Europe | 0.65 |
| 🇧🇾 Belarus | Europe | 0.63 |
| 🇦🇹 Austria | Europe | 0.62 |
| 🇭🇺 Hungary | Europe | 0.62 |
| 🇴🇲 Oman | Asia | 0.61 |
| 🇵🇹 Portugal | Europe | 0.60 |
| 🇬🇷 Greece | Europe | 0.59 |
| 🇵🇦 Panama | Americas | 0.57 |
| 🇨🇷 Costa Rica | Americas | 0.55 |
| 🇬🇼 Guinea-Bissau | Africa | 0.54 |
| 🇵🇸 West Bank | Asia | 0.54 |
| 🇬🇲 Gambia | Africa | 0.51 |
| 🇱🇧 Lebanon | Asia | 0.51 |
| 🇳🇦 Namibia | Africa | 0.50 |
| 🇳🇴 Norway | Europe | 0.49 |
| 🇩🇰 Denmark | Europe | 0.49 |
| 🇮🇪 Ireland | Europe | 0.48 |
| 🇳🇿 New Zealand | Oceania | 0.47 |
| 🇬🇦 Gabon | Africa | 0.45 |
| 🇷🇸 Serbia | Europe | 0.44 |
| 🇭🇰 Hong Kong | Asia | 0.43 |
| 🇫🇮 Finland | Europe | 0.43 |
| 🇧🇬 Bulgaria | Europe | 0.41 |
| 🇵🇸 Gaza Strip | Asia | 0.41 |
| 🇰🇼 Kuwait | Asia | 0.40 |
| 🇬🇪 Georgia | Asia | 0.40 |
| 🇸🇬 Singapore | Asia | 0.39 |
| 🇲🇳 Mongolia | Asia | 0.38 |
| 🇱🇸 Lesotho | Africa | 0.37 |
| 🇬🇶 Equatorial Guinea | Africa | 0.37 |
| 🇸🇰 Slovakia | Europe | 0.36 |
| 🇧🇼 Botswana | Africa | 0.36 |
| 🇯🇲 Jamaica | Americas | 0.33 |
| 🇹🇱 Timor-Leste | Asia | 0.33 |
| 🇺🇾 Uruguay | Americas | 0.32 |
| 🇦🇱 Albania | Europe | 0.29 |
| 🇭🇷 Croatia | Europe | 0.27 |
| 🇲🇩 Moldova | Europe | 0.25 |
| 🇦🇲 Armenia | Asia | 0.24 |
| 🇧🇦 Bosnia and Herzegovina | Europe | 0.24 |
| 🇽🇰 Kosovo | Europe | 0.21 |
| 🇸🇿 Eswatini | Africa | 0.19 |
| 🇱🇹 Lithuania | Europe | 0.18 |
| 🇵🇷 Puerto Rico | Americas | 0.18 |
| 🇶🇦 Qatar | Asia | 0.17 |
| 🇲🇰 North Macedonia | Europe | 0.16 |
| 🇩🇯 Djibouti | Africa | 0.16 |
| 🇰🇲 Comoros | Africa | 0.14 |
| 🇧🇭 Bahrain | Asia | 0.14 |
| 🇸🇮 Slovenia | Europe | 0.13 |
| 🇱🇻 Latvia | Europe | 0.12 |
| 🇸🇧 Solomon Islands | Oceania | 0.12 |
| 🇫🇯 Fiji | Oceania | 0.11 |
| 🇹🇹 Trinidad and Tobago | Americas | 0.11 |
| 🇧🇹 Bhutan | Asia | 0.10 |
| 🇨🇾 Cyprus | Asia | 0.10 |
| 🇬🇾 Guyana | Americas | 0.10 |
| 🇲🇺 Mauritius | Africa | 0.09 |
| 🇨🇻 Cabo Verde | Africa | 0.08 |
| 🇪🇪 Estonia | Europe | 0.08 |
| 🇸🇷 Suriname | Americas | 0.07 |
| 🇧🇿 Belize | Americas | 0.06 |
| 🇧🇳 Brunei | Asia | 0.06 |
| 🇱🇺 Luxembourg | Europe | 0.06 |
| 🇲🇪 Montenegro | Europe | 0.05 |
| 🇻🇺 Vanuatu | Oceania | 0.05 |
| 🇸🇹 Sao Tome and Principe | Africa | 0.04 |
| 🇲🇻 Maldives | Asia | 0.04 |
| 🇲🇴 Macau | Asia | 0.04 |
| 🇧🇸 Bahamas, The | Americas | 0.04 |
| 🇮🇸 Iceland | Europe | 0.03 |
| 🇲🇹 Malta | Europe | 0.03 |
| 🇳🇨 New Caledonia | Oceania | 0.03 |
| 🇵🇫 French Polynesia | Oceania | 0.03 |
| 🇼🇸 Samoa | Oceania | 0.03 |
| 🇧🇧 Barbados | Americas | 0.02 |
| 🇬🇺 Guam | Oceania | 0.02 |
| 🇰🇮 Kiribati | Oceania | 0.02 |
| 🇹🇴 Tonga | Oceania | 0.02 |
| 🇨🇼 Curacao | Americas | 0.01 |
| 🇱🇨 Saint Lucia | Americas | 0.01 |
| 🇫🇲 Micronesia, Federated States of | Oceania | 0.01 |
| 🇲🇭 Marshall Islands | Oceania | 0.01 |
| 🇬🇩 Grenada | Americas | 0.01 |
| 🇦🇬 Antigua and Barbuda | Americas | 0.01 |
| 🇦🇼 Aruba | Americas | 0.01 |
| 🇯🇪 Jersey | Europe | 0.01 |
| 🇻🇨 Saint Vincent and the Grenadines | Americas | 0.01 |
| 🇻🇮 Virgin Islands | Americas | 0.01 |
| 🇸🇨 Seychelles | Africa | 0.01 |
| 🇩🇲 Dominica | Americas | 0.01 |
| 🇮🇲 Isle of Man | Europe | 0.01 |
| 🇧🇲 Bermuda | Americas | 0.01 |
| 🇲🇵 Northern Mariana Islands | Oceania | 0.01 |
| 🇬🇱 Greenland | Americas | 0.01 |
| 🇹🇨 Turks and Caicos Islands | Americas | 0.01 |
| 🇫🇴 Faroe Islands | Europe | 0.01 |
| 🇦🇸 American Samoa | Oceania | 0.01 |
| 🇰🇾 Cayman Islands | Americas | 0.01 |
| 🇰🇳 Saint Kitts and Nevis | Americas | 0.00 |
| 🇬🇬 Guernsey | Europe | 0.00 |
| 🇦🇩 Andorra | Europe | 0.00 |
| 🇸🇽 Sint Maarten | Americas | 0.00 |
| 🇲🇫 Saint Martin | Americas | 0.00 |
| 🇻🇬 British Virgin Islands | Americas | 0.00 |
| 🇬🇮 Gibraltar | Europe | 0.00 |
| 🇱🇮 Liechtenstein | Europe | 0.00 |
| 🇸🇲 San Marino | Europe | 0.00 |
| 🇹🇻 Tuvalu | Oceania | 0.00 |
| 🇵🇼 Palau | Oceania | 0.00 |
| 🇦🇮 Anguilla | Americas | 0.00 |
| 🇲🇨 Monaco | Europe | 0.00 |
| 🇳🇷 Nauru | Oceania | 0.00 |
| 🇼🇫 Wallis and Futuna | Oceania | 0.00 |
| 🇨🇰 Cook Islands | Oceania | 0.00 |
| 🇸🇭 Saint Helena, Ascension, and Tristan da Cunha | Africa | 0.00 |
| 🇧🇱 Saint Barthelemy | Americas | 0.00 |
| 🇲🇸 Montserrat | Americas | 0.00 |
| 🇫🇰 Falkland Islands (Islas Malvinas) | Americas | 0.00 |
| 🇵🇲 Saint Pierre and Miquelon | Americas | 0.00 |
It’s worth noting that, while India ranks number one on the list, the country’s birth rate (which is its total number of births in a year per 1,000 individuals) is actually slightly below the global average, at 16.8 compared to 17.7 respectively.
China, which comes second on the list, is similar to India, with a high population but relatively low birth rate as well. On the other hand, Nigeria, which ranks third on the list, has a birth rate that’s nearly double the global average, at 34.2.
Why is Nigeria’s birth rate so high?
There are various intermingling factors at play, but one key reason is the fact that Nigeria’s economy still is developing, and ranks 131st globally in terms of GDP per capita. Further, access to education for women is still not as widespread as it could be, and research shows that this is strongly correlated with higher birth rates.
The World’s Population Growth Rate is Declining
While there are hundreds of thousands of babies born around the world each day, it’s worth mentioning that the world’s overall population growth rate has actually been declining since the 1960s.
This is happening for a number of reasons, including:
- Increased wealth around the world, which research has correlated with fewer births
- Various government policies discouraging large families
- The global shift from rural to urban living
By 2100, global population growth is expected to drop to 0.1%, which means we’ll essentially reach net-zero population growth.
This would increase our global median age even further, which poses a number of economic risks if countries don’t properly prepare for this demographic shift.

This article was published as a part of Visual Capitalist's Creator Program, which features data-driven visuals from some of our favorite Creators around the world.


Millennials
Charted: U.S. Wealth by Generation
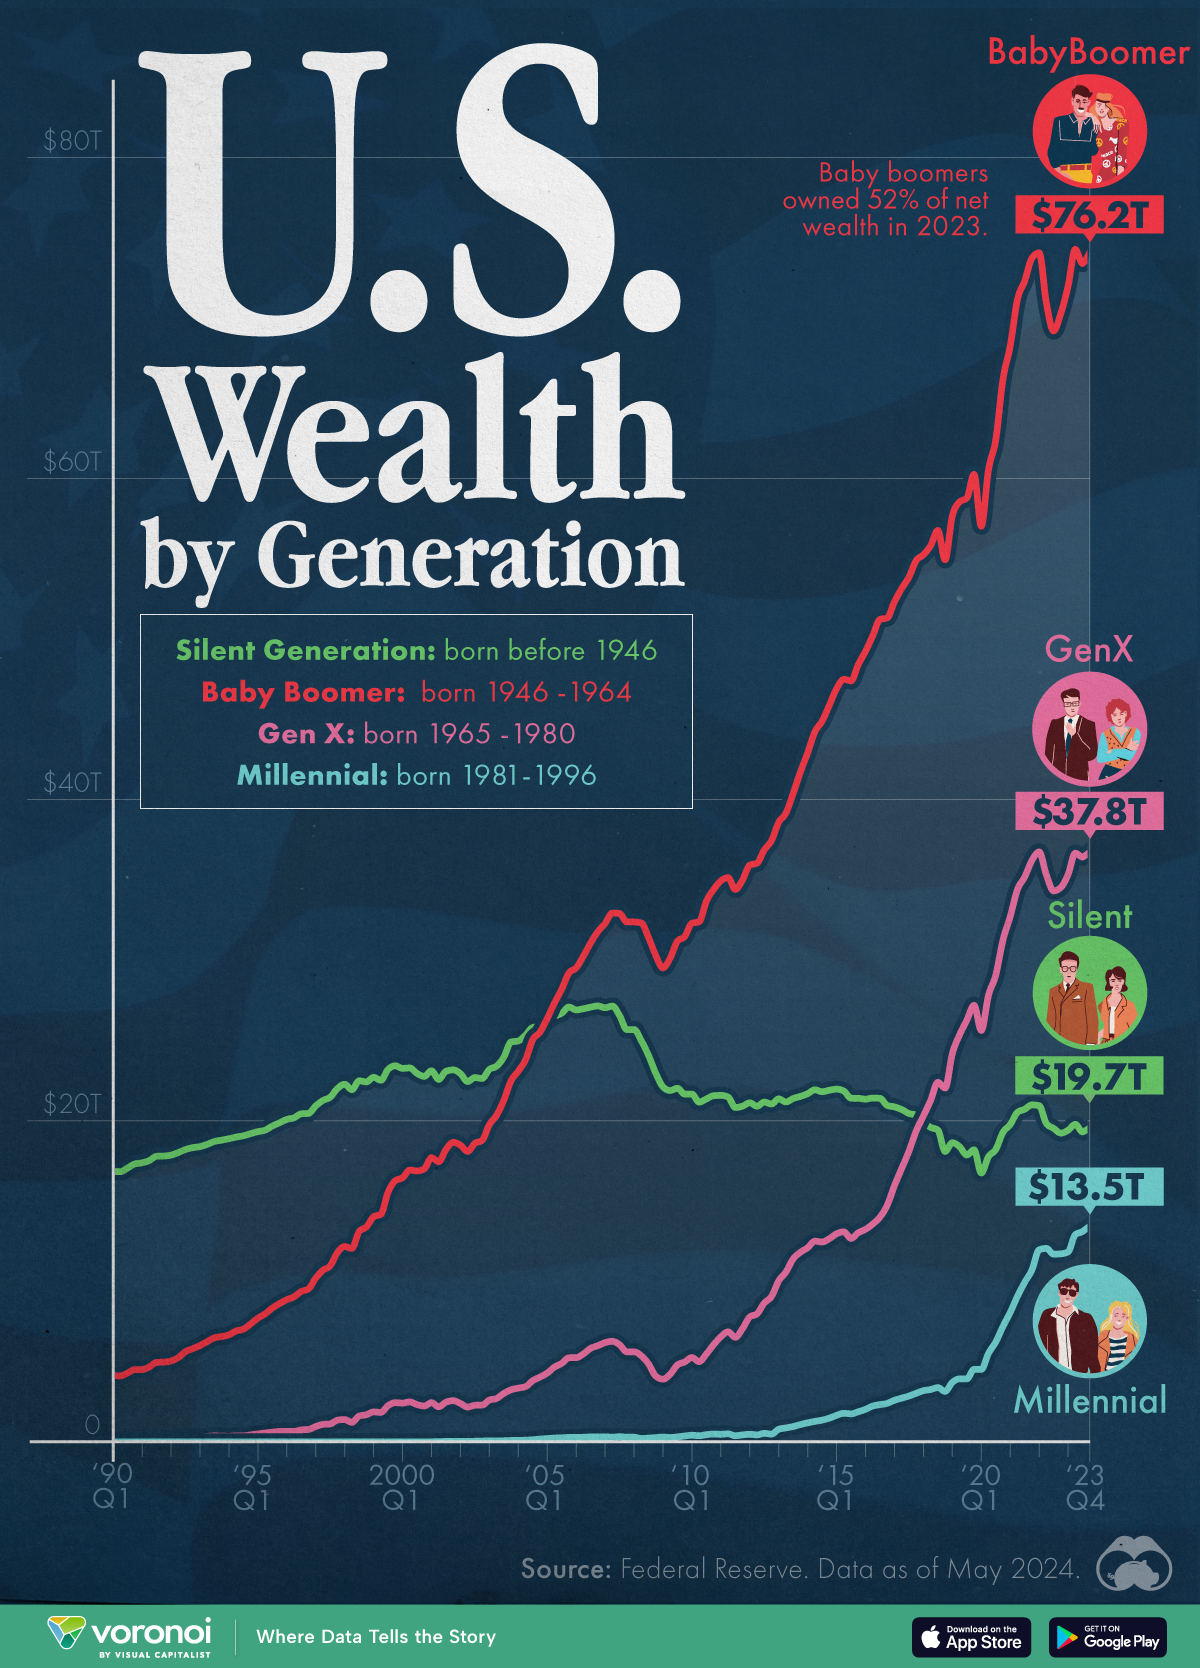
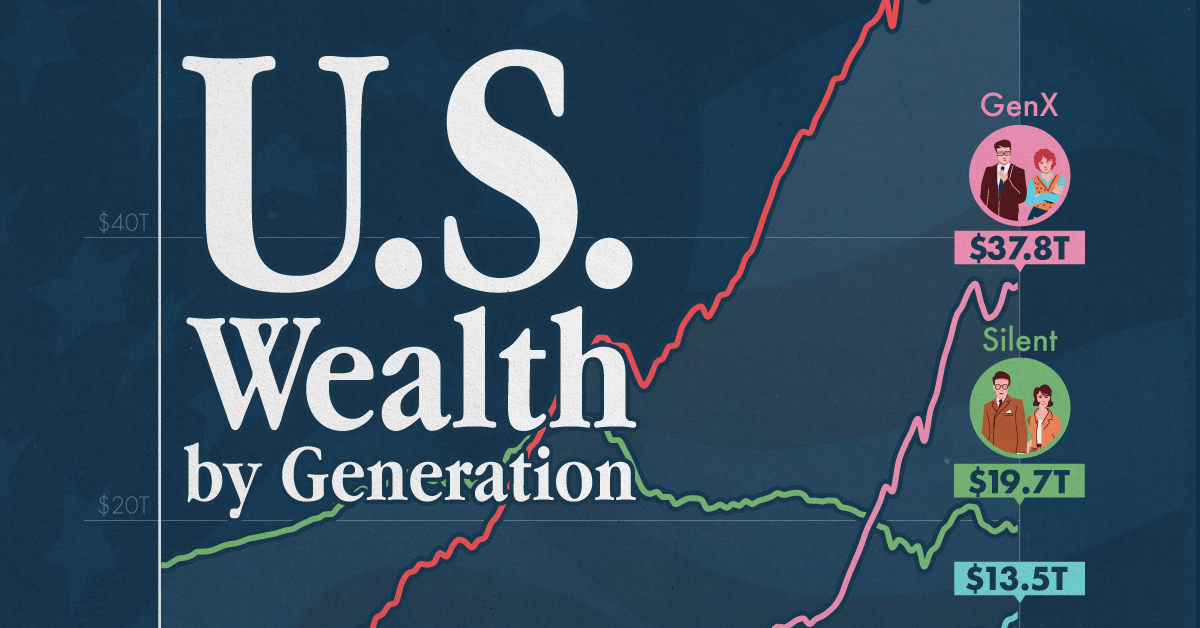
This graphic illustrates the distribution of wealth in the United States from 1990 to 2023 by generation, from Millennials to Boomers.
Charted: U.S. Wealth by Generation
This was originally posted on our Voronoi app. Download the app for free on iOS or Android and discover incredible data-driven charts from a variety of trusted sources.
In 2023, American Baby Boomers owned 52% of the country’s net wealth despite comprising only 20% of the population.
Based on Federal Reserve data, this graphic illustrates the distribution of wealth in the United States from 1990 to 2023 by generation.
Generations are defined by birth year:
- Silent Generation (born before 1946)
- Baby Boomers (born 1946-1964)
- Gen Xers (born 1965-1980)
- Millennials (born 1981-1996)
Baby Boomers Own Over Half of the Wealth
Baby Boomers are often considered one of the luckier generations in terms of timing.
Most did not experience wars and benefited from strong economic growth driven by falling interest rates, a roaring stock market, global monetary expansion, and high earnings. Consequently, this group’s wealth grew from $4.5 trillion in 1990 to $76.2 trillion in 2023.
Wealth by Generation (USD, Trillions)
| Year | Silent | Baby Boom | Gen X | Millennial |
|---|---|---|---|---|
| 1990 | 17.3T | 4.5T | 0.2T | 0 |
| 1995 | 19.9T | 8.6T | 0.6T | 0 |
| 2000 | 22.8T | 17.0T | 2.2T | 0 |
| 2005 | 27.1T | 29.2T | 5.2T | 0.3T |
| 2010 | 21.6T | 34.4T | 6.0T | 0.5T |
| 2015 | 21.4T | 48.4T | 13.0T | 1.9T |
| 2020 | 19.3T | 66.2T | 31.3T | 7.2T |
| 2023 | 19.7T | 76.2T | 37.8T | 13.5T |
Meanwhile, Gen X’s share of American wealth rose from 15% in 2013 to 26% in 2023. In contrast, with most of the cohort over 80 years old, the Silent Generation saw its share of the national wealth total drop from 79% in 1990 to 13% in 2024.
Contrary to their ‘broke generation’ label, millennials have defied expectations. They saw their wealth reach historic highs after the COVID-19 pandemic, amassing more wealth by their 40s than previous generations. In a significant leap, millennials’ share of wealth in America increased from a modest 1.4% to a promising 9.2% between 1990 and 2023.
If you enjoyed this post, be sure to check out this graphic, which shows the retirement savings that Americans currently hold.

-

 Markets2 weeks ago
Ranked: Which NHL Team Takes Home the Most Revenue?
-

 Markets1 week ago
Mapped: The World’s Least Affordable Housing Markets in 2024
-

 Energy1 week ago
Visualizing Saudi Aramco’s Massive Oil Reserves
-

 Economy1 week ago
GDP Per Capita, by G7 Country (2019-2029F)
-

 Sports1 week ago
A Look at Cristiano Ronaldo’s Euro Records
-

 Misc1 week ago
Chart: Which Countries Eat the Most Instant Noodles?
-

 Misc1 week ago
Ranked: The 10 Highest-Grossing Concert Tours of All Time
-

 Demographics1 week ago
Charted: Unauthorized Immigrants in the U.S., by Country of Origin