Misc
Ranked: The Top Goal Scorers in FIFA World Cup History
Article/Editing:
Ranked: The Top Goal Scorers in FIFA World Cup History
With the 2022 FIFA World Cup around the corner, soccer (or football) fans have their eyes set on how their favorite teams and players will perform.
But history shows that some players, and teams, are far more proficient in goals and wins than others. After all, with only 32 teams competing and the field quickly whittling down, there aren’t many chances for players to make their mark.
Who are history’s most prolific goal scorers? This series of graphics from Pablo Alvarez breaks down the top goal scorers in FIFA World Cup history, and their goals per appearances.
The World’s Cup Top Goal Scorers
Since the inaugural World Cup tournament in 1930, there have been 21 tournaments held across 17 countries.
At the first World Cup in Uruguay, 13 national teams competed for the championship trophy. The tournament then included 16 teams until 1982, when it expanded to 24 teams. Most recently, FIFA expanded to the current 32-team format starting in 1998.
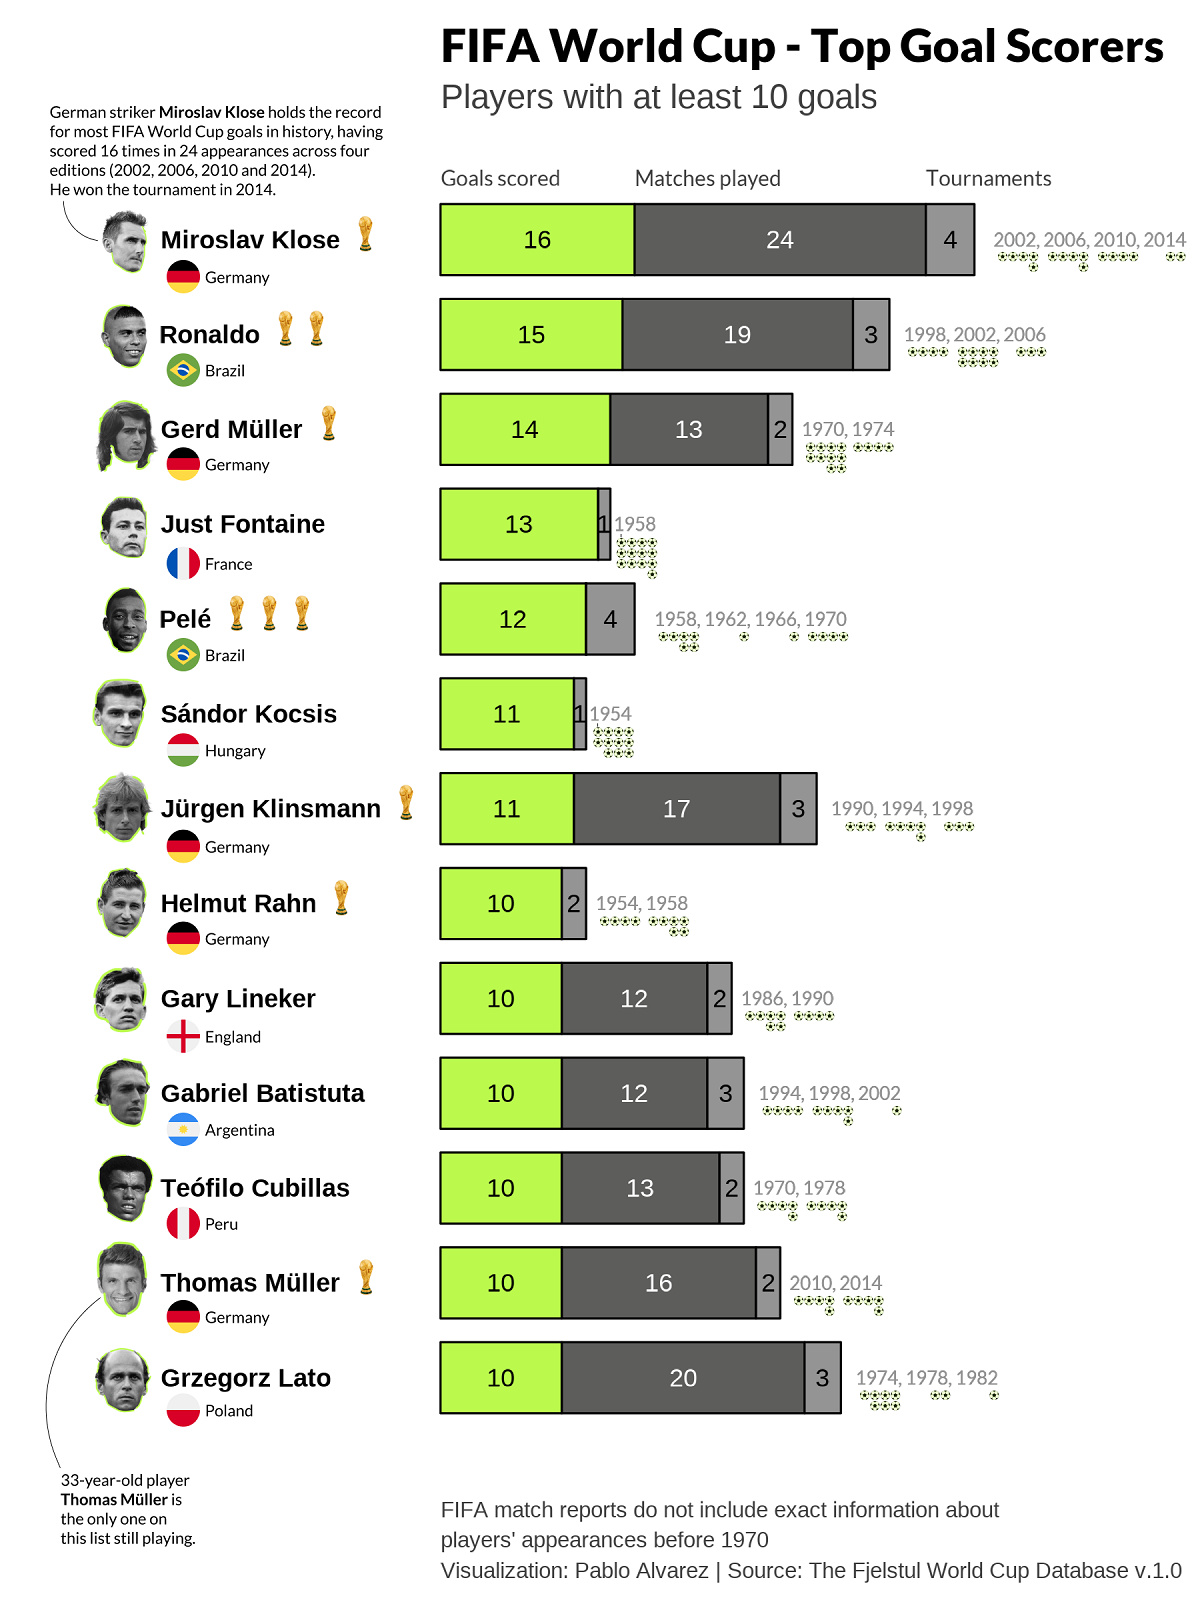
And across all these tournaments, just 13 players have scored 10 or more goals:
| Rank | Player (* denotes active) | World Cup Goals | Tournaments |
|---|---|---|---|
| 1 | 🇩🇪 Miroslav Klose | 16 | 4 |
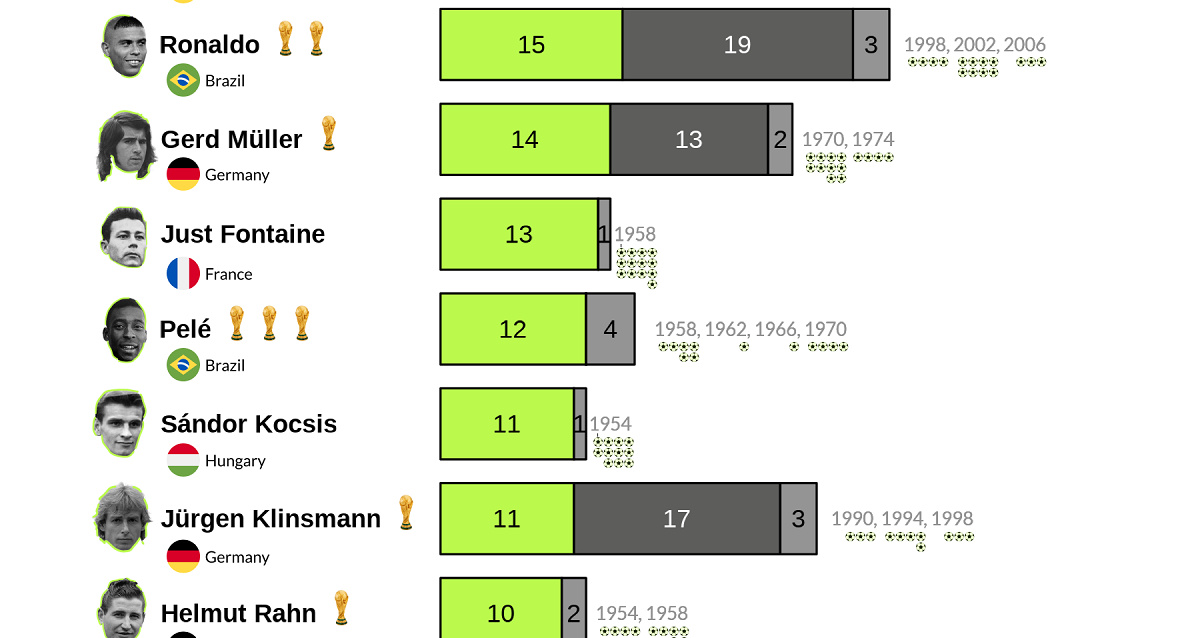
| 2 | 🇧🇷 Ronaldo | 15 | 3 |
| 3 | 🇩🇪 Gerd Müller | 14 | 2 |
| 4 | 🇫🇷 Just Fontaine | 13 | 1 |
| 5 | 🇧🇷 Pelé | 12 | 4 |
| T6 | 🇭🇺 Sándor Kocsis | 11 | 1 |
| T6 | 🇩🇪 Jürgen Klinsmann | 11 | 3 |
| T8 | 🇩🇪 Helmut Rahn | 10 | 2 |
| T8 | 🏴 Gary Lineker | 10 | 2 |
| T8 | 🇦🇷 Gabriel Batistuta | 10 | 3 |
| T8 | 🇵🇪 Teófilo Cubillas | 10 | 2 |
| T8 | 🇩🇪 Thomas Müller* | 10 | 2 |
| T8 | 🇵🇱 Grzegorz Lato | 10 | 3 |
The record for the most goals scored at the World Cup currently belongs to Germany’s Miroslav Klose with 16 goals across 4 tournaments, including one championship in 2014.
In fact, Germany had the most 10+ goal scorers of any country with five, including the only still-active player Thomas Müller.
Other well-known legends on the list include Ronaldo (not to be confused with Cristiano Ronaldo) and Pelé from Brazil, and Gary Lineker from England. But the title for the most goals scored in just one tournament goes to France’s Just Fontaine, who scored an incredible 13 goals in six matches in 1958.
Tracking World Cup Goals Per Appearances
Because of a diverse field and an intense qualification process, some teams play more games than others. Therefore, the above list skews towards teams and players with many caps.
So Alvarez also charted how World Cup goal scorers compare on a per-match basis. Unfortunately, FIFA match reports only fully tracked appearances and substitutions from 1970 onwards, though this still gives a clear picture of some of the world’s most effective (and least effective) goal scorers:
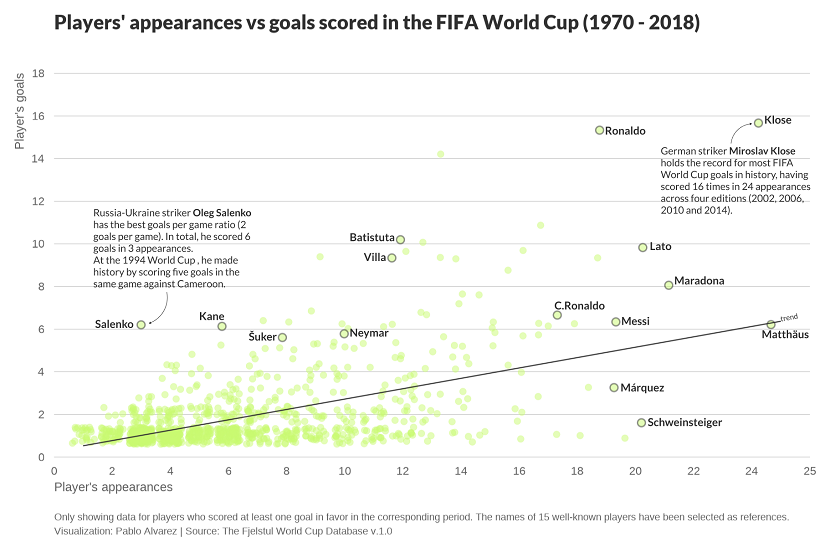
Again, the top goal scorers Klose and Ronaldo appear very prominently with 15+ goals, but other legends with a similar number of appearances like Maradona, Messi, and Cristiano Ronaldo weren’t as successful on a per-match basis.
What happens when we take the top World Cup goal scorers with 5 or more goals from 1970 onwards and look at their goals/match rate?
| Player | World Cup Goals (1970–2018) | Matches Played | Goals/Match |
|---|---|---|---|
| Miroslav Klose | 16 | 24 | 0.67 |
| Ronaldo | 15 | 19 | 0.79 |
| Gerd Müller | 14 | 13 | 1.08 |
| Jürgen Klinsmann | 11 | 17 | 0.65 |
| Gary Lineker | 10 | 12 | 0.83 |
| Gabriel Batistuta | 10 | 12 | 0.83 |
| Teófilo Cubillas | 10 | 13 | 0.77 |
| Thomas Müller | 10 | 16 | 0.63 |
| Grzegorz Lato | 10 | 20 | 0.50 |
| Christian Vieri | 9 | 9 | 1.00 |
| David Villa | 9 | 12 | 0.75 |
| Jairzinho | 9 | 13 | 0.69 |
| Paolo Rossi | 9 | 14 | 0.64 |
| Roberto Baggio | 9 | 16 | 0.56 |
| Karl-Heinz Rummenigge | 9 | 19 | 0.47 |
| Rivaldo | 8 | 14 | 0.57 |
| Rudi Völler | 8 | 15 | 0.53 |
| Diego Maradona | 8 | 21 | 0.38 |
| Careca | 7 | 9 | 0.78 |
| Andrzej Szarmach | 7 | 13 | 0.54 |
| Luis Suárez | 7 | 13 | 0.54 |
| Johnny Rep | 7 | 14 | 0.50 |
| Cristiano Ronaldo | 7 | 17 | 0.41 |
| Oleg Salenko | 6 | 3 | 2.00 |
| Harry Kane | 6 | 6 | 1.00 |
| Salvatore Schillaci | 6 | 7 | 0.86 |
| James Rodríguez | 6 | 8 | 0.75 |
| Davor Šuker | 6 | 8 | 0.75 |
| Neymar | 6 | 10 | 0.60 |
| Diego Forlán | 6 | 10 | 0.60 |
| Hristo Stoichkov | 6 | 10 | 0.60 |
| Asamoah Gyan | 6 | 11 | 0.55 |
| Dennis Bergkamp | 6 | 12 | 0.50 |
| Rob Rensenbrink | 6 | 13 | 0.46 |
| Bebeto | 6 | 15 | 0.40 |
| Arjen Robben | 6 | 15 | 0.40 |
| Rivellino | 6 | 15 | 0.40 |
| Zbigniew Boniek | 6 | 16 | 0.38 |
| Robin van Persie | 6 | 17 | 0.35 |
| Wesley Sneijder | 6 | 17 | 0.35 |
| Thierry Henry | 6 | 17 | 0.35 |
| Mario Kempes | 6 | 18 | 0.33 |
| Lionel Messi | 6 | 19 | 0.32 |
| Lothar Matthäus | 6 | 25 | 0.24 |
| Tomáš Skuhravý | 5 | 5 | 1.00 |
| Jon Dahl Tomasson | 5 | 6 | 0.83 |
| Fernando Morientes | 5 | 7 | 0.71 |
| Kennet Andersson | 5 | 7 | 0.71 |
| Alessandro Altobelli | 5 | 7 | 0.71 |
| Romário | 5 | 8 | 0.63 |
| Mario Mandžukić | 5 | 8 | 0.63 |
| Marc Wilmots | 5 | 8 | 0.63 |
| Emilio Butragueño | 5 | 9 | 0.56 |
| Tim Cahill | 5 | 9 | 0.56 |
| Roger Milla | 5 | 10 | 0.50 |
| Romelu Lukaku | 5 | 10 | 0.50 |
| Ivan Perišić | 5 | 10 | 0.50 |
| Hans Krankl | 5 | 10 | 0.50 |
| Raúl | 5 | 11 | 0.45 |
| Fernando Hierro | 5 | 12 | 0.42 |
| Zinedine Zidane | 5 | 12 | 0.42 |
| Landon Donovan | 5 | 12 | 0.42 |
| Johan Neeskens | 5 | 12 | 0.42 |
| Henrik Larsson | 5 | 13 | 0.38 |
| Gonzalo Higuaín | 5 | 14 | 0.36 |
| Edinson Cavani | 5 | 14 | 0.36 |
| Zico | 5 | 14 | 0.36 |
| Michel Platini | 5 | 14 | 0.36 |
| Lukas Podolski | 5 | 15 | 0.33 |
Most players expectedly scored under one goal/match, but five players stand out:
- Russia’s Oleg Salenko with an incredible 2 goals/match (6 goals in 3 matches).
- Germany’s Gerd Müller with 1.08 goals/match.
- Italy’s Christian Vieri, England’s Harry Kane, and the Czech Republic’s Tomáš Skuhravý with 1 goal/match.
Future Top Goal Scorers
With many players in Qatar 2022 vying for both the national championship and the Golden Boot, which is awarded to the tournament’s top goal scorer, the rankings are always ripe to change.
And future tournaments will likely offer more goal-scoring opportunities. The 2026 World Cup to be held in Canada, the U.S., and Mexico will be the first to feature 48 teams after FIFA voted to expand the tournament.
Which active players, or up-and-coming talents, will be next to climb the all-time goal scoring rankings?

This article was published as a part of Visual Capitalist's Creator Program, which features data-driven visuals from some of our favorite Creators around the world.


Misc
How Hard Is It to Get Into an Ivy League School?
We detail the admission rates and average annual cost for Ivy League schools, as well as the median SAT scores required to be accepted.


How Hard Is It to Get Into an Ivy League School?
This was originally posted on our Voronoi app. Download the app for free on iOS or Android and discover incredible data-driven charts from a variety of trusted sources.
Ivy League institutions are renowned worldwide for their academic excellence and long-standing traditions. But how hard is it to get into one of the top universities in the U.S.?
In this graphic, we detail the admission rates and average annual cost for Ivy League schools, as well as the median SAT scores required to be accepted. The data comes from the National Center for Education Statistics and was compiled by 24/7 Wall St.
Note that “average annual cost” represents the net price a student pays after subtracting the average value of grants and/or scholarships received.
Harvard is the Most Selective
The SAT is a standardized test commonly used for college admissions in the United States. It’s taken by high school juniors and seniors to assess their readiness for college-level academic work.
When comparing SAT scores, Harvard and Dartmouth are among the most challenging universities to gain admission to. The median SAT scores for their students are 760 for reading and writing and 790 for math. Still, Harvard has half the admission rate (3.2%) compared to Dartmouth (6.4%).
| School | Admission rate (%) | SAT Score: Reading & Writing | SAT Score: Math | Avg Annual Cost* |
|---|---|---|---|---|
| Harvard University | 3.2 | 760 | 790 | $13,259 |
| Columbia University | 3.9 | 750 | 780 | $12,836 |
| Yale University | 4.6 | 760 | 780 | $16,341 |
| Brown University | 5.1 | 760 | 780 | $26,308 |
| Princeton University | 5.7 | 760 | 780 | $11,080 |
| Dartmouth College | 6.4 | 760 | 790 | $33,023 |
| University of Pennsylvania | 6.5 | 750 | 790 | $14,851 |
| Cornell University | 7.5 | 750 | 780 | $29,011 |
*Costs after receiving federal financial aid.
Additionally, Dartmouth has the highest average annual cost at $33,000. Princeton has the lowest at $11,100.
While student debt has surged in the United States in recent years, hitting $1.73 trillion in 2023, the worth of obtaining a degree from any of the schools listed surpasses mere academics. This is evidenced by the substantial incomes earned by former students.
Harvard grads, for example, have the highest average starting salary in the country, at $91,700.

-

 Real Estate2 weeks ago
Visualizing America’s Shortage of Affordable Homes
-

 Technology1 week ago
Ranked: Semiconductor Companies by Industry Revenue Share
-

 Money1 week ago
Which States Have the Highest Minimum Wage in America?
-

 Real Estate1 week ago
Ranked: The Most Valuable Housing Markets in America
-

 Business1 week ago
Charted: Big Four Market Share by S&P 500 Audits
-

 AI1 week ago
The Stock Performance of U.S. Chipmakers So Far in 2024
-

 Misc2 weeks ago
Almost Every EV Stock is Down After Q1 2024
-

 Money2 weeks ago
Where Does One U.S. Tax Dollar Go?