Science
Mapped: The World’s Major Earthquakes from 1956‒2022
Article/Editing:
Click to view this graphic in a higher-resolution.
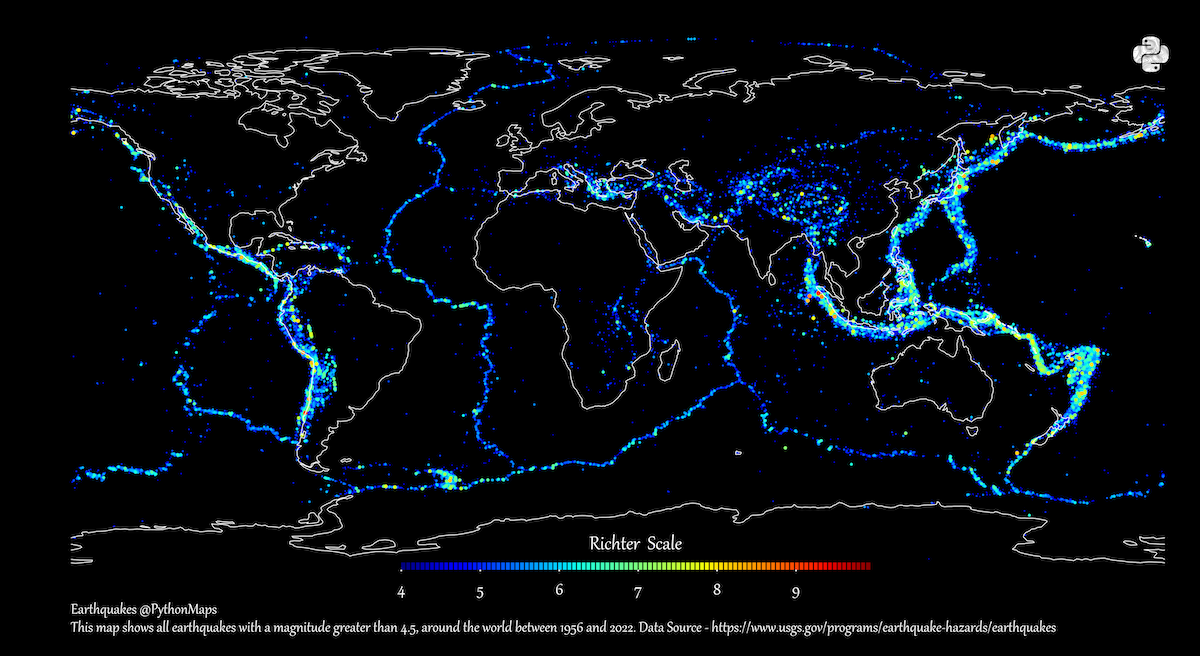
Mapping The World’s Major Earthquakes from 1956‒2022
Major earthquakes have occurred since time immemorial, but their observation and impact have not been evenly distributed around the globe.
On February 6, two earthquakes struck in Türkiye near the Syrian border. Both registered above a 7 on the Richter scale and have a combined death toll rapidly rising past 20,000 people.
And looking at the history of recent and ancient earthquakes, the location of these is no surprise. Using data from the United States Geological Survey (USGS), creator PythonMaps mapped earthquake epicenters between 1956 and 2022 that registered a 4.5 or higher on the Richter scale.
Tectonic Plate Movement and Earthquakes
Looking at the map, it’s easy to spot the concentration of earthquakes along the boundaries of Earth’s tectonic plates.
These massive moving slabs of rock fit together almost like puzzle pieces, making up the lithosphere or the upper crust. But as the edges of tectonic plates collide, slide against, and move away from each other, the crust cracks and folds and causes earthquakes.
Most of the earthquakes visualized on this map follow the boundaries of the seven major tectonic plates, along with the Philippine Plate (south of Japan) and the Nazca Plate (west of South America).
Here’s a list of the most earthquake-prone areas on the planet, according to the USGS.
| Earthquake Zones | Tectonic Plates | Locations |
|---|---|---|
| Ring of Fire | Pacific, North American, Philippine, Juan de Fuca, Cocos, Nazca | Rim of the Pacific Ocean. |
| Alpide Belt | Eurasian, African, Arabian, Indian | Java to Sumatra, through the Himalayas, west to the Mediterranean, and out into the Atlantic. |
| Mid-Atlantic Ridge | North American, Eurasian, South American, African | Deep underwater in the Atlantic, and directly underneath Iceland. |
According to academics, the recent earthquakes in Türkiye (part of the Alpide Belt) happened on multiple faults. The Arabian Plate likely moved northwards into the Eurasian Plate, pushing the Anatolian Plate (which Türkiye sits on) westward.
The Worst Earthquakes in History
Though earthquakes are spread around the world, major earthquakes seem even more tightly confined to specific regions.
These major earthquakes register highly on magnitude scales, such as the Richter scale (ML) and the newer and more commonly-used moment magnitude scale (Mw). These scales are logarithmic and ramp up quickly, so for the Richter scale, each whole number increase roughly corresponds to a 31.6-fold increase in energy released.
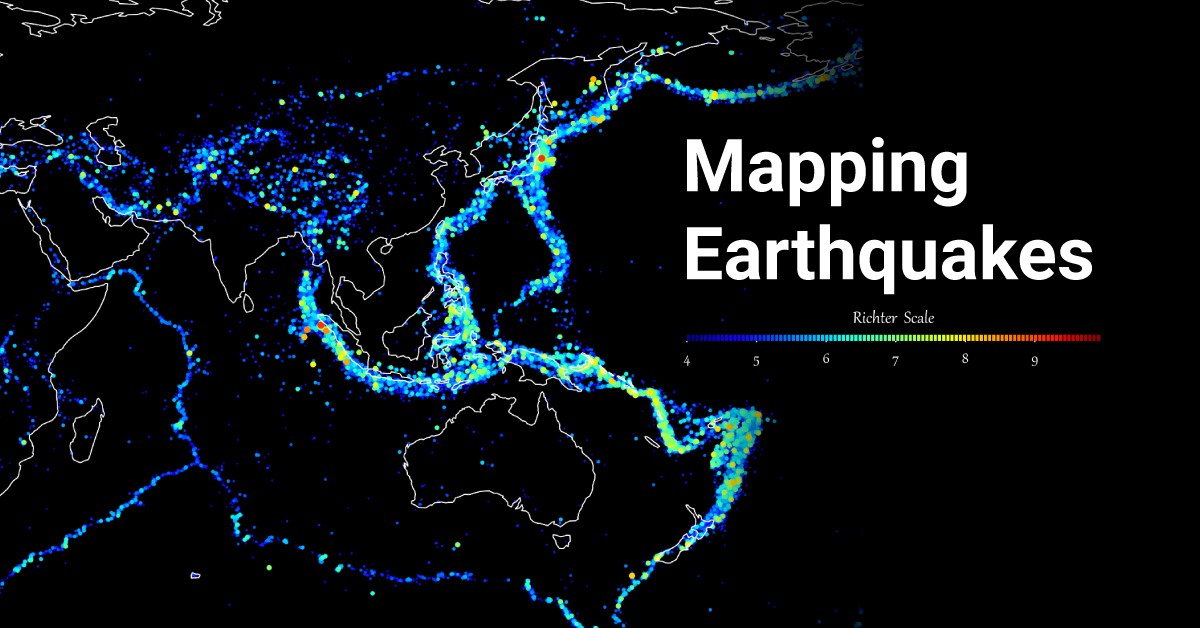
The map above sees a concentration of these bigger magnitude earthquakes congregating heavily around both sides of the Pacific Ocean. This border is also known colloquially as the “Ring of Fire” for its persistent volcanic activity, also caused by tectonic plate movement.
But the red points representing major earthquakes registering 9+ on the Richter scale are far and few between. Here’s a list of the 20 worst earthquakes in history, based on magnitude.
| Rank | Name | Magnitude | Location | Date (Y-M-D) |
|---|---|---|---|---|
| 1 | Valdivia Earthquake | 9.5 | Bio-Bio, Chile | 1960-05-22 |
| 2 | Good Friday Earthquake | 9.2 | Alaska, U.S. | 1964-03-28 |
| 3 | 2004 Indian Ocean Earthquake | 9.1 | Sumatra, Indonesia | 2004-12-26 |
| 4 | Tohoku Earthquake | 9.1 | Honshu, Japan | 2011-03-11 |
| 5 | 1952 Severo-Kurilsk Earthquake | 9.0 | Kamchatka, Russia | 1952-11-04 |
| 6 | Maule Earthquake | 8.8 | Bio-Bio, Chile | 2010-02-27 |
| 7 | 1906 Ecuador–Colombia Earthquake | 8.8 | Ecuador | 1906-01-31 |
| 8 | Rat Islands Earthquake | 8.7 | Alaska, U.S. | 1965-02-04 |
| 9 | Assam-Tibet Earthquake | 8.6 | Assam, Tibet | 1950-08-15 |
| 10 | 2012 Indian Ocean Earthquake | 8.6 | Sumatra, Indonesia | 2012-04-11 |
| 11 | Nias Earthquake | 8.6 | Sumatra, Indonesia | 2005-03-28 |
| 12 | 1957 Andreanof Islands Earthquake | 8.6 | Alaska, U.S. | 1957-03-09 |
| 13 | Unimak Island Earthquake, Alaska | 8.6 | Alaska, U.S. | 1946-04-01 |
| 14 | 1938 Banda Sea Earthquake | 8.5 | Banda Sea | 1938-02-01 |
| 15 | 1922 Vallenar Earthquake | 8.5 | Chile-Argentina Border | 1922-11-11 |
| 16 | 1963 Kuril Islands Earthquake | 8.5 | Kuril Islands, Russia | 1963-10-13 |
| 17 | 1923 Kamchatka Earthquake | 8.4 | Kamchatka, Russia | 1923-02-03 |
| 18 | September 2007 Sumatra Earthquakes | 8.4 | Sumatra, Indonesia | 2007-09-12 |
| 19 | Peru Earthquake | 8.4 | Southern Peru | 2001-06-23 |
| 20 | 1933 Sanriku Earthquake | 8.4 | Honshu, Japan | 1933-03-02 |
Areas near Indonesia, Russia, and Chile — all on tectonic plate boundaries — have seen half of the largest earthquakes recorded in history.
That said, there could have been earlier and larger earthquakes not recorded. Earlier civilizations lacked precise instruments to measure and document them and preserved written observations only, with some of the earliest records dating back nearly three millennia.
Can We Predict Major Earthquakes?
Despite the ability to measure both location and intensity of earthquakes (using a seismograph), scientists still cannot precisely predict exactly where, when, or at what magnitude an earthquake will occur.
However, they can measure the probability of an earthquake occurring, especially around fault zones. A famous example is “the big one” around the Cascadia subduction zone in North America which occurs every 200 to 800 years.
In areas that sit on fault lines between plates, earthquake preparedness can play a big role in mitigating risk.

This article was published as a part of Visual Capitalist's Creator Program, which features data-driven visuals from some of our favorite Creators around the world.


Science
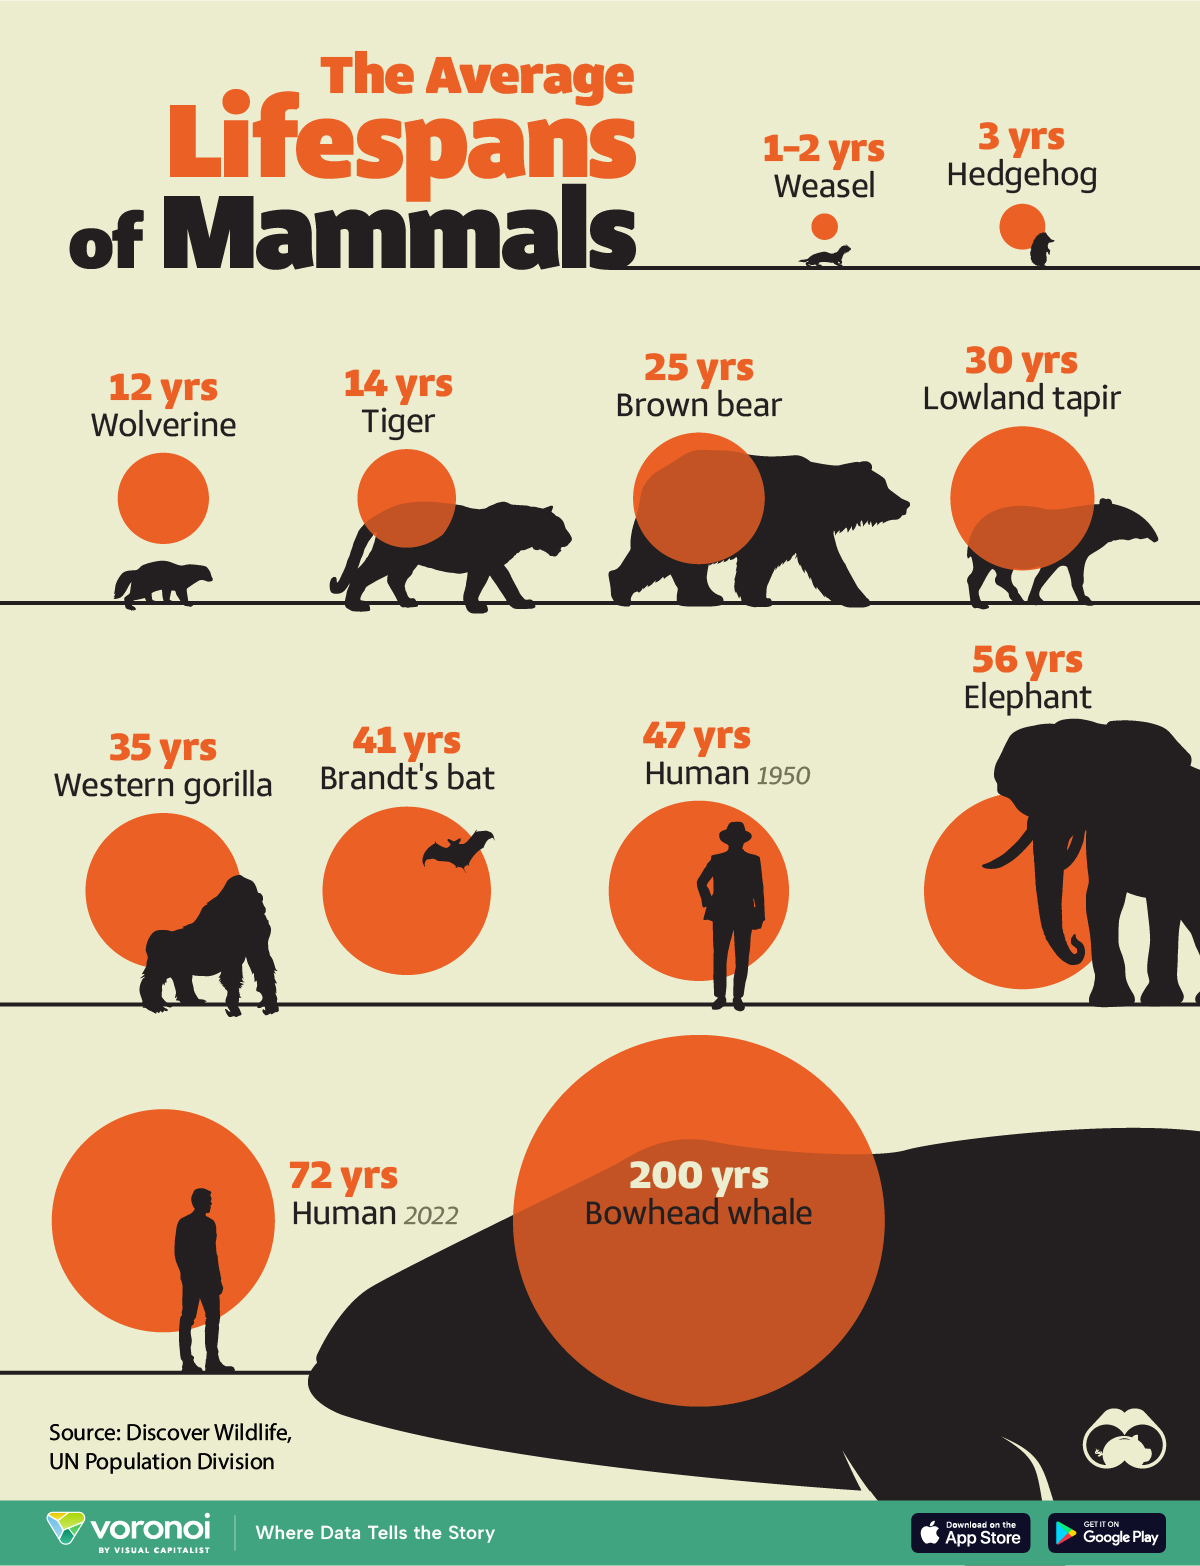
Visualizing the Average Lifespans of Mammals
While smaller animals such as weasels typically live 1-2 years, larger counterparts can thrive for decades.
Visualizing the Average Lifespans of Mammals
This was originally posted on our Voronoi app. Download the app for free on iOS or Android and discover incredible data-driven charts from a variety of trusted sources.
Mammals, though comprising a small fraction of Earth’s creatures, hold vital ecological roles globally. They are crucial for maintaining ecosystem health through services like pollination, seed dispersal, and predator-prey dynamics.
In this visualization, we depict the average lifespans of mammals, using data from Discover Wildlife and the United Nations.
Human Lifespans on the Rise
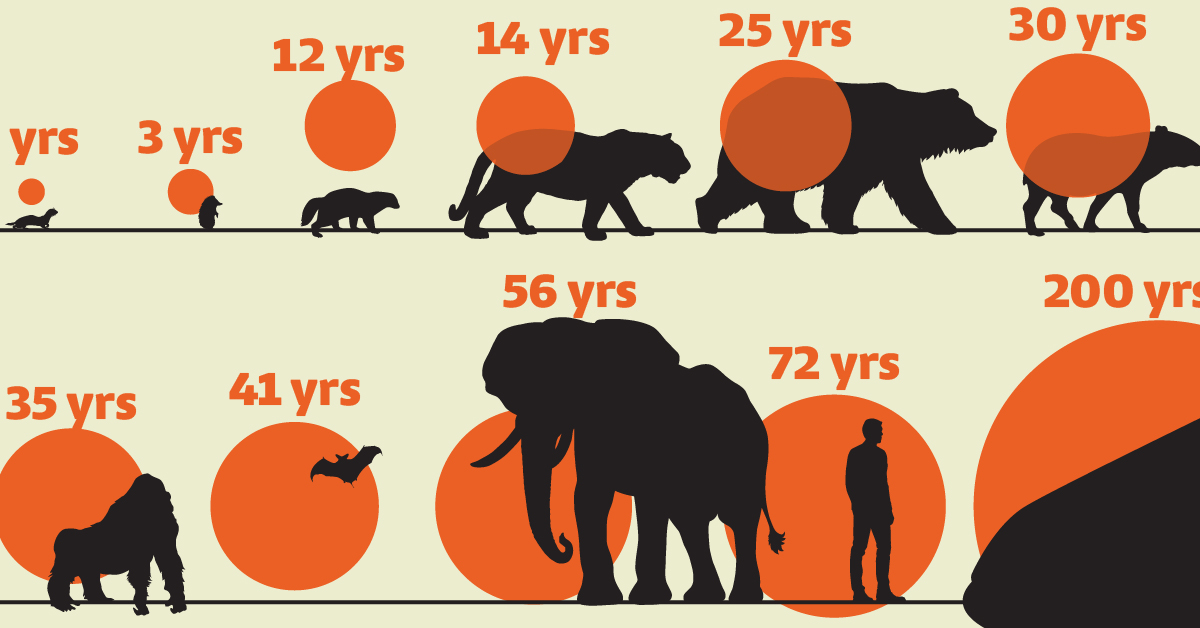
Defined as warm-blooded creatures with hair or fur, mammals nurse their young with milk from mammary glands. While smaller animals such as weasels typically live 1-2 years, larger counterparts like elephants can thrive for decades, and bowhead whales can live for 200 years, or even longer.
| Animal | Average lifespan (years) |
|---|---|
| Weasel | 1 to 2 |
| Hedgehog | 3 |
| Wolverine | 12 |
| Tiger | 14 |
| Brown bear | 25 |
| Lowland tapir | 30 |
| Western gorilla | 35 |
| Brandt's bat | 41 |
| Humans (1950) | 47 |
| Elephant | 56 |
| Humans (2022) | 72 |
| Bowhead whale | 200 |
Notably, human lifespans have experienced a remarkable surge. According to the UN Population Division, the global average life expectancy has surged from 47 years in 1950 to 72 years in 2022, marking a 25-year increase. This is attributed to advancements in nutrition, medication, and essential resources.
However, as human longevity flourishes, it can have an adverse effect on wildlife mammal populations. To put this into numbers, over the past 100,000 years, the surge in human population has precipitated an 85% reduction in wild mammal biomass.
Today, livestock dominates 62% of the world’s mammal biomass, with humans accounting for 34%, while wild mammals comprise only 4%.
Despite a decline in mammal diversity, the total biomass of terrestrial mammals has significantly increased, expanding approximately ninefold over the past 10,000 years.
Curious to learn more about mammals? Check out this graphic that shows the biomass of all the world’s mammals.

-

 Markets1 week ago
U.S. Debt Interest Payments Reach $1 Trillion
-

 Business2 weeks ago
Charted: Big Four Market Share by S&P 500 Audits
-

 Real Estate2 weeks ago
Ranked: The Most Valuable Housing Markets in America
-

 Money2 weeks ago
Which States Have the Highest Minimum Wage in America?
-

 AI2 weeks ago
Ranked: Semiconductor Companies by Industry Revenue Share
-

 Markets2 weeks ago
Ranked: The World’s Top Flight Routes, by Revenue
-

 Demographics2 weeks ago
Population Projections: The World’s 6 Largest Countries in 2075
-

 Markets2 weeks ago
The Top 10 States by Real GDP Growth in 2023