Maps
Mapped: Which is the Best U.S. City for Entry-Level Jobs by Pay?
Article/Editing:
Click to view this graphic in a higher-resolution.
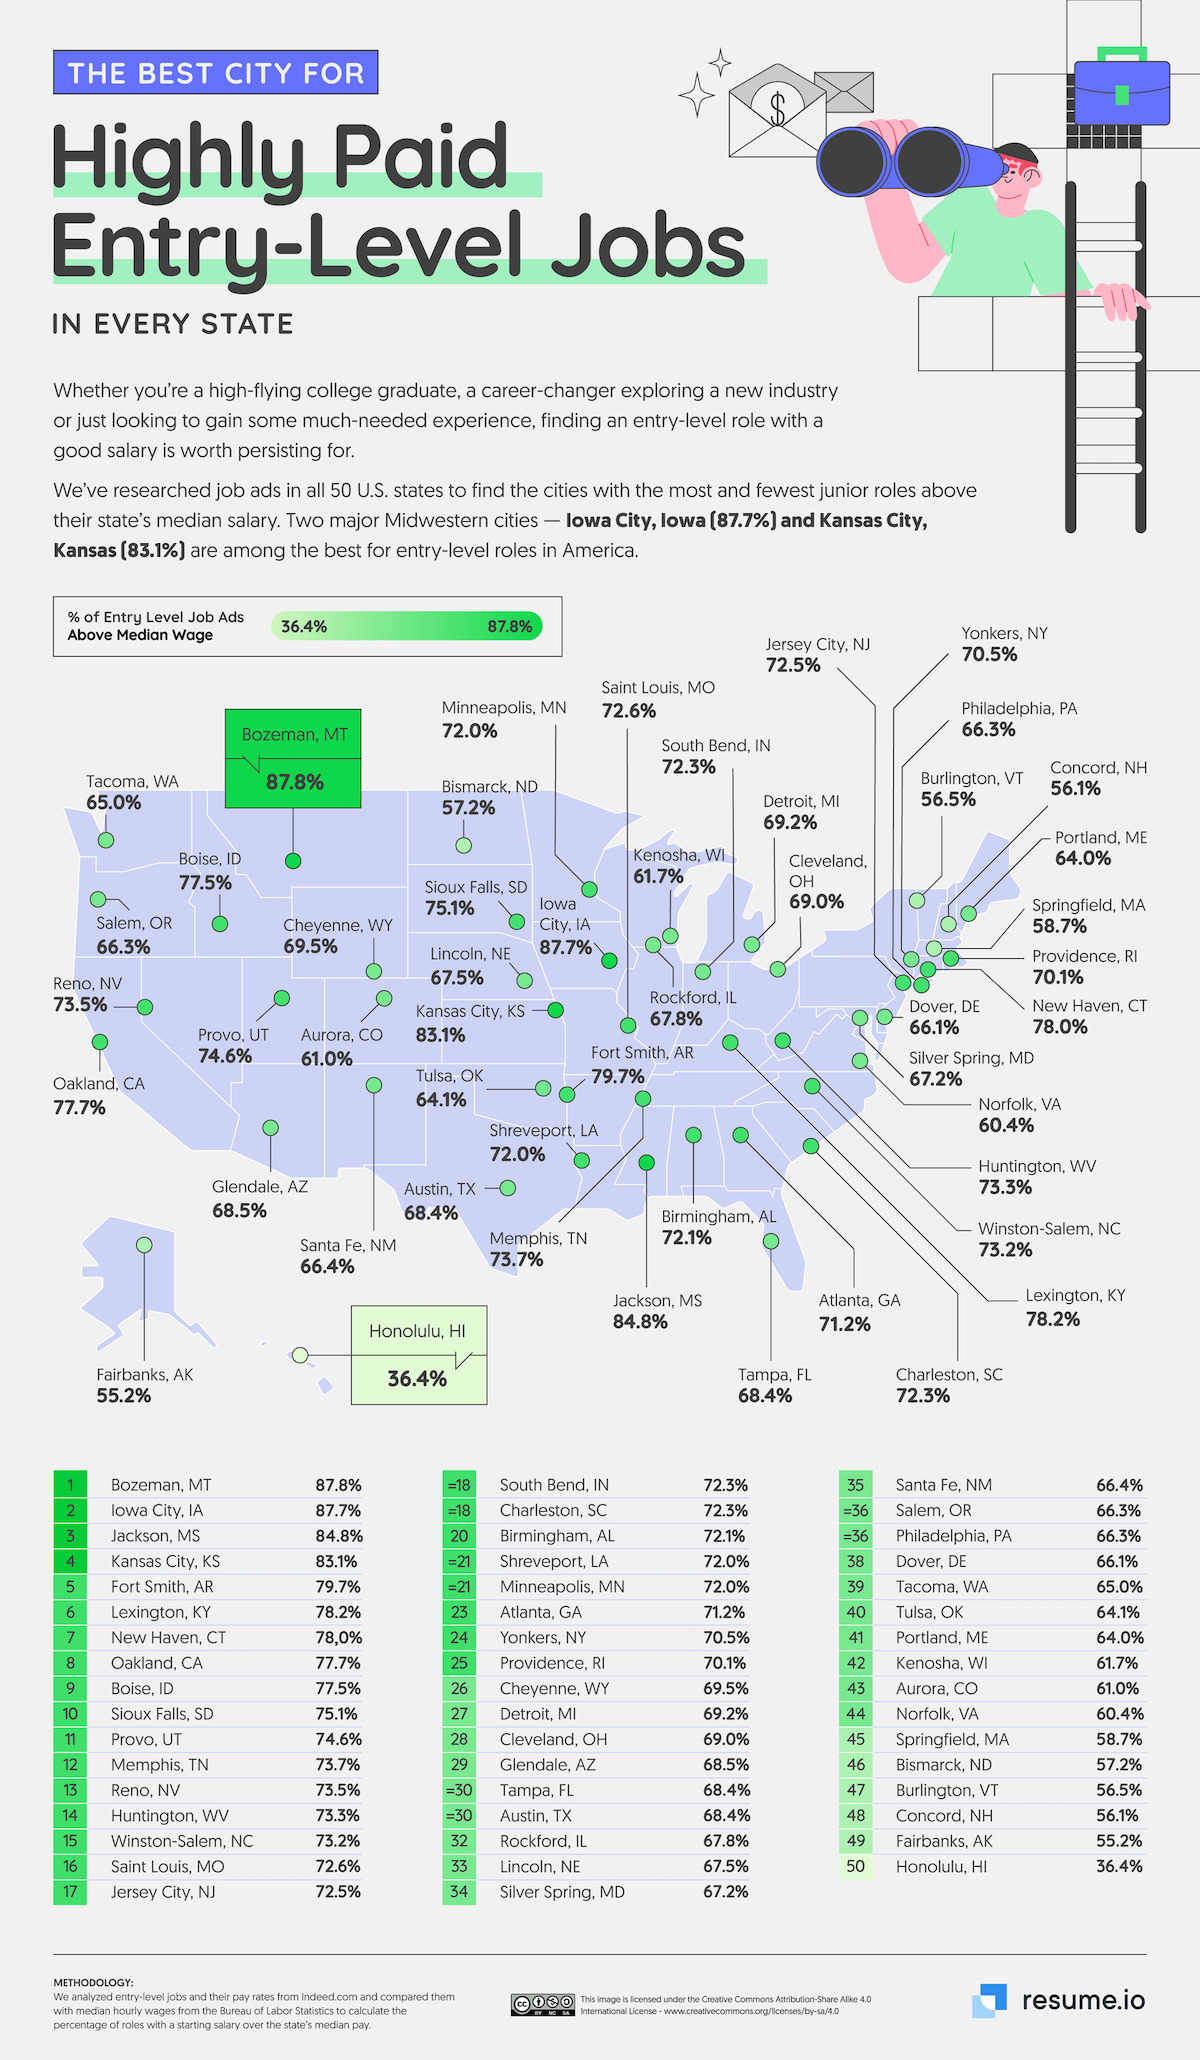
Which is the Best U.S. City for Well-Paid Entry-Level Jobs?
The anxieties around a first-job are immense: fear of the unknown, performance pressure, and the need to navigate new professional environments.
But good pay can help manage these worries. Lots and more has been written on which careers are the highest-paid, but how does geography factor into the equation?
To find the best U.S. city and state for well-paid entry-level jobs, NeoMam Studios visualizes data from Resume.io showing the percentage of local entry-level job listings that offer a salary above (and below) a city or state’s median hourly wages.
Ranked: 50 U.S. Cities By Entry-Level Job Pay
This dataset covers each U.S. state, as well as Washington, D.C. and 50 major cities. Median wage data is sourced from the Bureau of Labor Statistics, and the number of entry-level jobs and their pay rates from Indeed.com.
Bozeman, Montana (nicknamed “Boz Angeles” for its constant stream of celebrity visitors) and Iowa City both have nearly 88% of their entry-level jobs promising above their state’s median pay.
For an apples-to-apples comparison however, Iowa City’s median wage comes in slightly higher at $22.52/hour compared to Bozeman’s $20.71/hour.
Note: Toggle the embedded table between U.S. cities and states ranked by best entry-level jobs.
Another Midwestern urban center, Kansas City, ranked fourth, promises a high likelihood of above-media pay for first-job hunters (83.1%).
Generally, the more populous the city, the more jobs, and the higher the likelihood of beating median pay. However larger cities that are not the state capital also seem to do well on this metric: Fort Smith, Arkansas (ranked 5th), Lexington, Kentucky (6th), New Haven, Connecticut (7th), and Oakland, California (8th).
Ranked: U.S. States By Entry-Level Job Pay
Click to view this graphic in a higher-resolution.
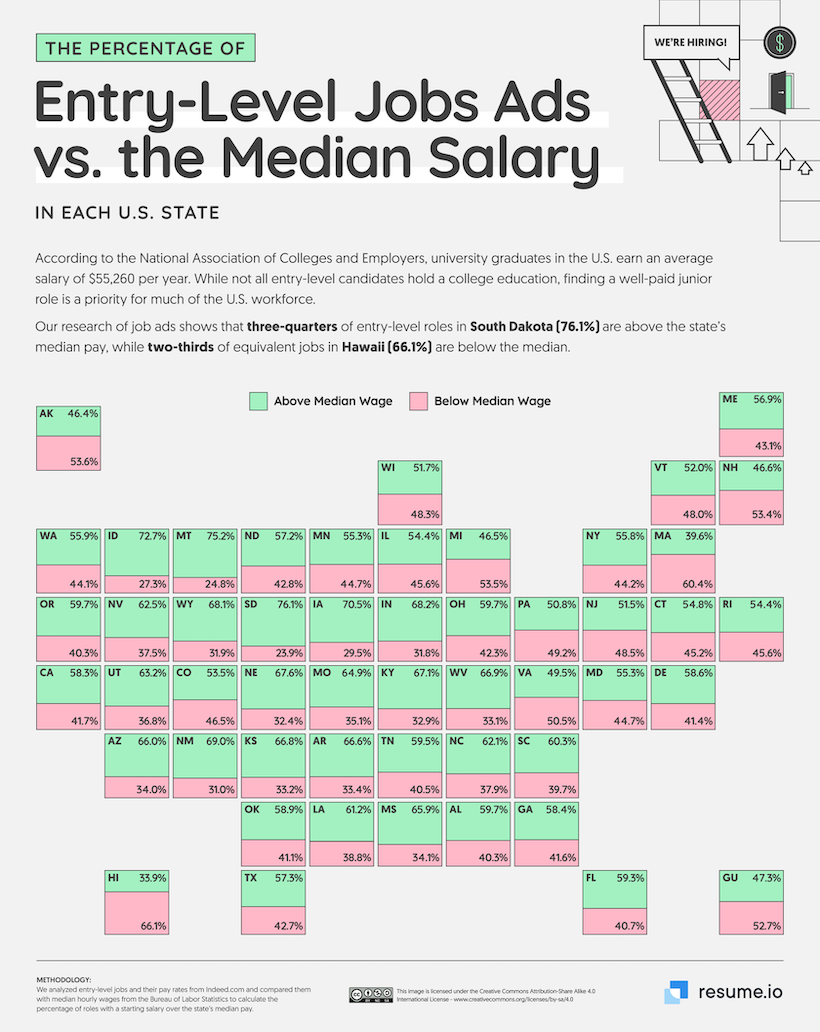
In South Dakota, and Montana, ranked first and second in the state by best entry-level pay ranks, more than three-quarters of junior role listings offer pay above the state’s median wage.
This works out more than $19.17/hour ($39,900/year) for South Dakota and $20.29/hour ($42,200/year) for Montana for their entry-level jobs.
In fact the first nine states on the ranks, where nearly 70% of the entry-level job listings offer above-state-median pay, are from the Midwest or West.
Kentucky, ranked 10th, has 67% of their starter job openings stating above median pay ($40,200/year), the highest from the American South.
Predictably, states with higher median pay (California, Connecticut, Massachusetts, Washington, New York) have lower numbers of entry-level job openings which promise pay above that level.
However, exceptions occur. For example, Wyoming’s median pay comes in around the same as Maine ($21.80/hour) but 68% of its entry-level job listings offer median-beating pay, compared to Maine’s 57%.
Hawaii is the worst state for a decent starting salary, with two-thirds of the analyzed listings offering below the median pay of $48,600/year. Most of the state’s jobs are concentrated in the tourism industry, part of the service sector, known for long hours, seasonal work, and low pay.

This article was published as a part of Visual Capitalist's Creator Program, which features data-driven visuals from some of our favorite Creators around the world.


Maps
Mapped: Median Income by State in 2024
This graphic shows median income by state in 2024, adjusted for cost of living. Can you guess where it’s the highest?
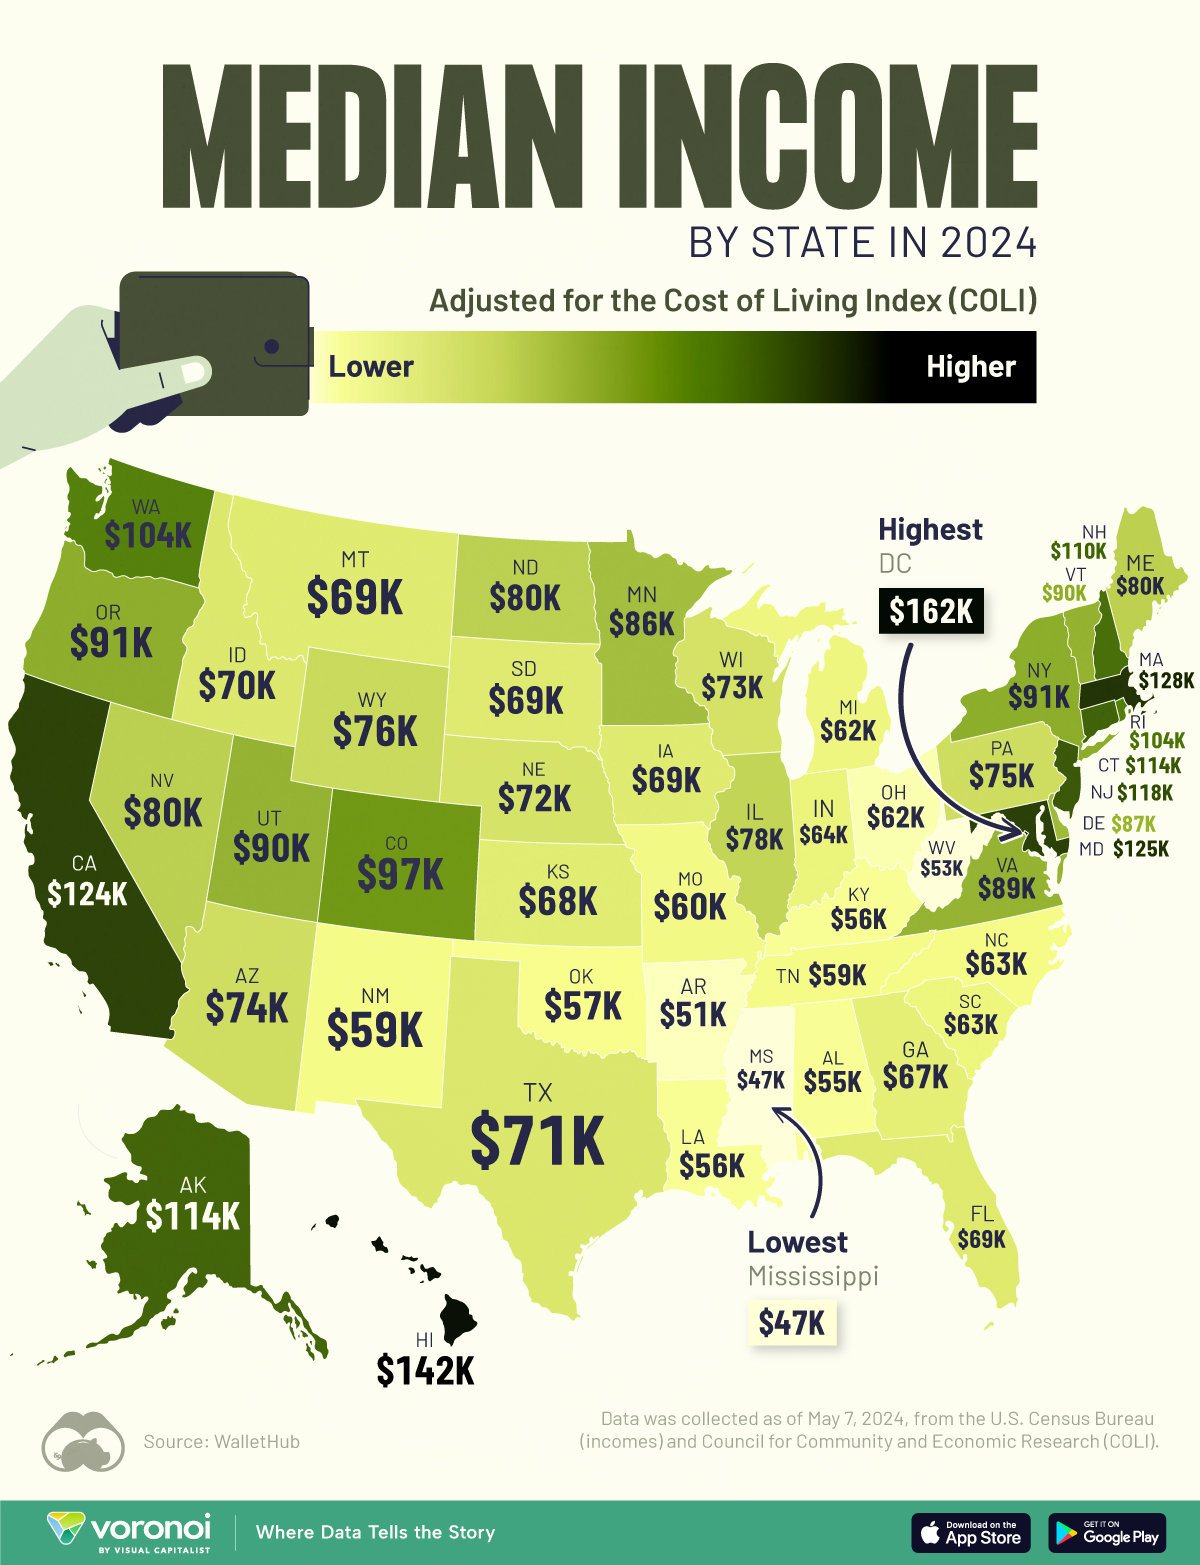
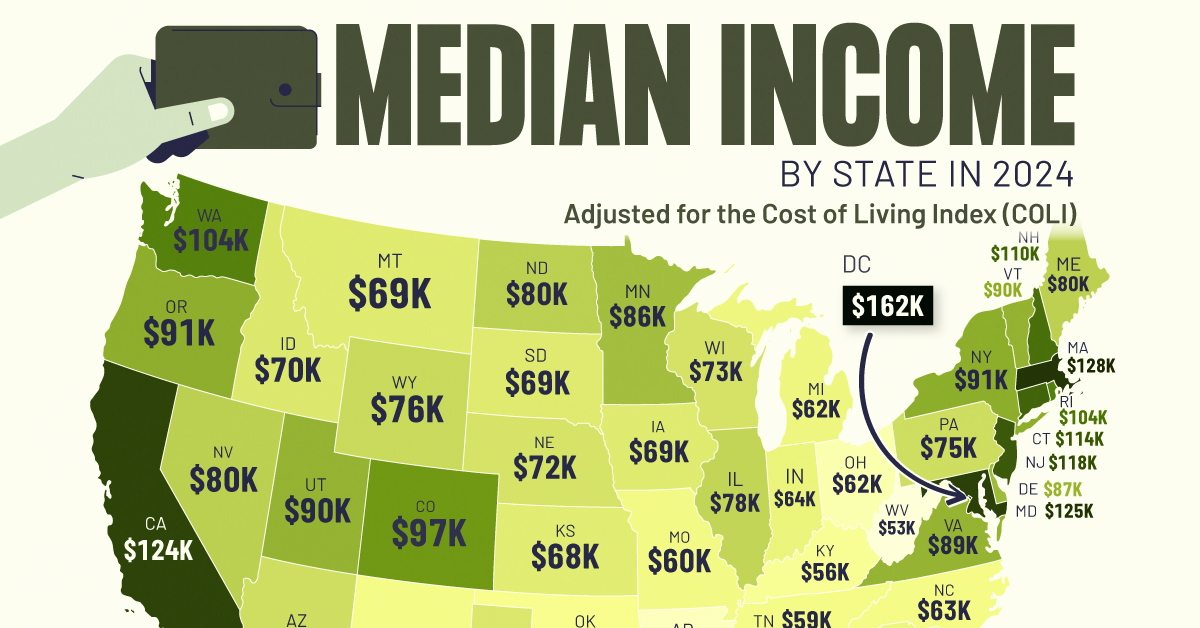
Median Income by State in 2024, Adjusted for Cost of Living
This was originally posted on our Voronoi app. Download the app for free on iOS or Android and discover incredible data-driven charts from a variety of trusted sources.
To gain insight into the U.S. economy, we’ve visualized the median income by state, as of May 2024. These figures come from WalletHub, which sourced income data from the U.S. Census Bureau and adjusted it for cost of living according to the Cost of Living Index (COLI).
Data and Key Takeaways
All of the numbers we used to create this graphic are listed in the table below.
| Rank | State | Median Annual Income (adjusted for cost of living) |
|---|---|---|
| 1 | DC | $162,265 |
| 2 | Hawaii | $141,832 |
| 3 | Massachusetts | $127,760 |
| 4 | Maryland | $124,693 |
| 5 | California | $123,988 |
| 6 | New Jersey | $117,847 |
| 7 | Connecticut | $114,156 |
| 8 | Alaska | $113,934 |
| 9 | New Hampshire | $110,205 |
| 10 | Rhode Island | $104,252 |
| 11 | Washington | $103,748 |
| 12 | Colorado | $97,301 |
| 13 | New York | $91,366 |
| 14 | Oregon | $91,100 |
| 15 | Utah | $89,786 |
| 16 | Vermont | $89,695 |
| 17 | Virginia | $89,393 |
| 18 | Delaware | $87,173 |
| 19 | Minnesota | $86,364 |
| 20 | Nevada | $80,366 |
| 21 | North Dakota | $79,874 |
| 22 | Maine | $79,800 |
| 23 | Illinois | $78,304 |
| 24 | Wyoming | $76,307 |
| 25 | Pennsylvania | $74,711 |
| 26 | Arizona | $74,375 |
| 27 | Wisconsin | $72,602 |
| 28 | Nebraska | $72,384 |
| 29 | Texas | $70,513 |
| 30 | Idaho | $70,041 |
| 31 | South Dakota | $69,266 |
| 32 | Iowa | $68,974 |
| 33 | Montana | $68,937 |
| 34 | Florida | $68,818 |
| 35 | Kansas | $68,489 |
| 36 | Georgia | $66,612 |
| 37 | Indiana | $64,170 |
| 38 | North Carolina | $63,025 |
| 39 | South Carolina | $62,909 |
| 40 | Michigan | $62,446 |
| 41 | Ohio | $61,904 |
| 42 | Missouri | $59,715 |
| 43 | Tennessee | $59,077 |
| 44 | New Mexico | $58,911 |
| 45 | Oklahoma | $57,215 |
| 46 | Louisiana | $56,282 |
| 47 | Kentucky | $55,629 |
| 48 | Alabama | $55,480 |
| 49 | West Virginia | $52,719 |
| 50 | Arkansas | $51,032 |
| 51 | Mississippi | $46,880 |
The Cost of Living Index, published by the Council for Community and Economic Research (C2ER), was established in 1968, and allows for consistent place-to-place cost comparisons.
The index considers six categories of spending: groceries, housing, utilities, transportation, health care, and miscellaneous.
After adjusting for COLI, the top three states by median income are the District of Columbia (DC) (technically a district), Hawaii, and Massachusetts.
In DC, federal government agencies are the biggest employers. Many of them offer high-paying jobs that require higher education and specialized skills. DC, like Hawaii, also has a relatively higher cost of living, which may push up the average salary.
In the case of Massachusetts, the state is home to many of the world’s most prestigious universities and research institutions, as well as high-earning sectors like healthcare and tech.
See More U.S. Maps From Visual Capitalist
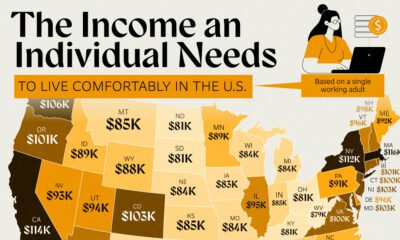
If you enjoyed this post, be sure to check out Mapped: The Income Needed to Live Comfortably in Every U.S. State

-

 Maps2 weeks ago
Mapped: The 10 Hottest and Coldest Countries in the World
-

 Retail1 week ago
Ranked: The 20 Top Retailers Worldwide, by Revenue
-

 Sports1 week ago
Ranked: Which NBA Team Takes Home the Most Revenue?
-

 Markets1 week ago
Charted: Stock Buybacks by the Magnificent Seven
-

 Millennials1 week ago
Visualizing the Wealth of Americans Under 40 (1989-2023)
-
 Culture1 week ago
Infographic: The Next Characters to Enter the Public Domain
-

 Economy1 week ago
Where Unemployment Benefits are the Highest, in OECD Countries
-

 Technology1 week ago
Ranked: The 20 Biggest Tech Companies by Market Cap