Technology
Apple’s Colossal Market Cap as it Hits $3 Trillion
Article/Editing:
Apple’s Colossal Market Cap in Context
In January of 2019, Apple’s market capitalization stood at $700 billion.
While this was perceived as a colossal figure at the time, when we fast forward to today, that valuation seems a lot more modest. Since then, Apple has surged to touch a $3 trillion valuation on January 3rd, 2022.
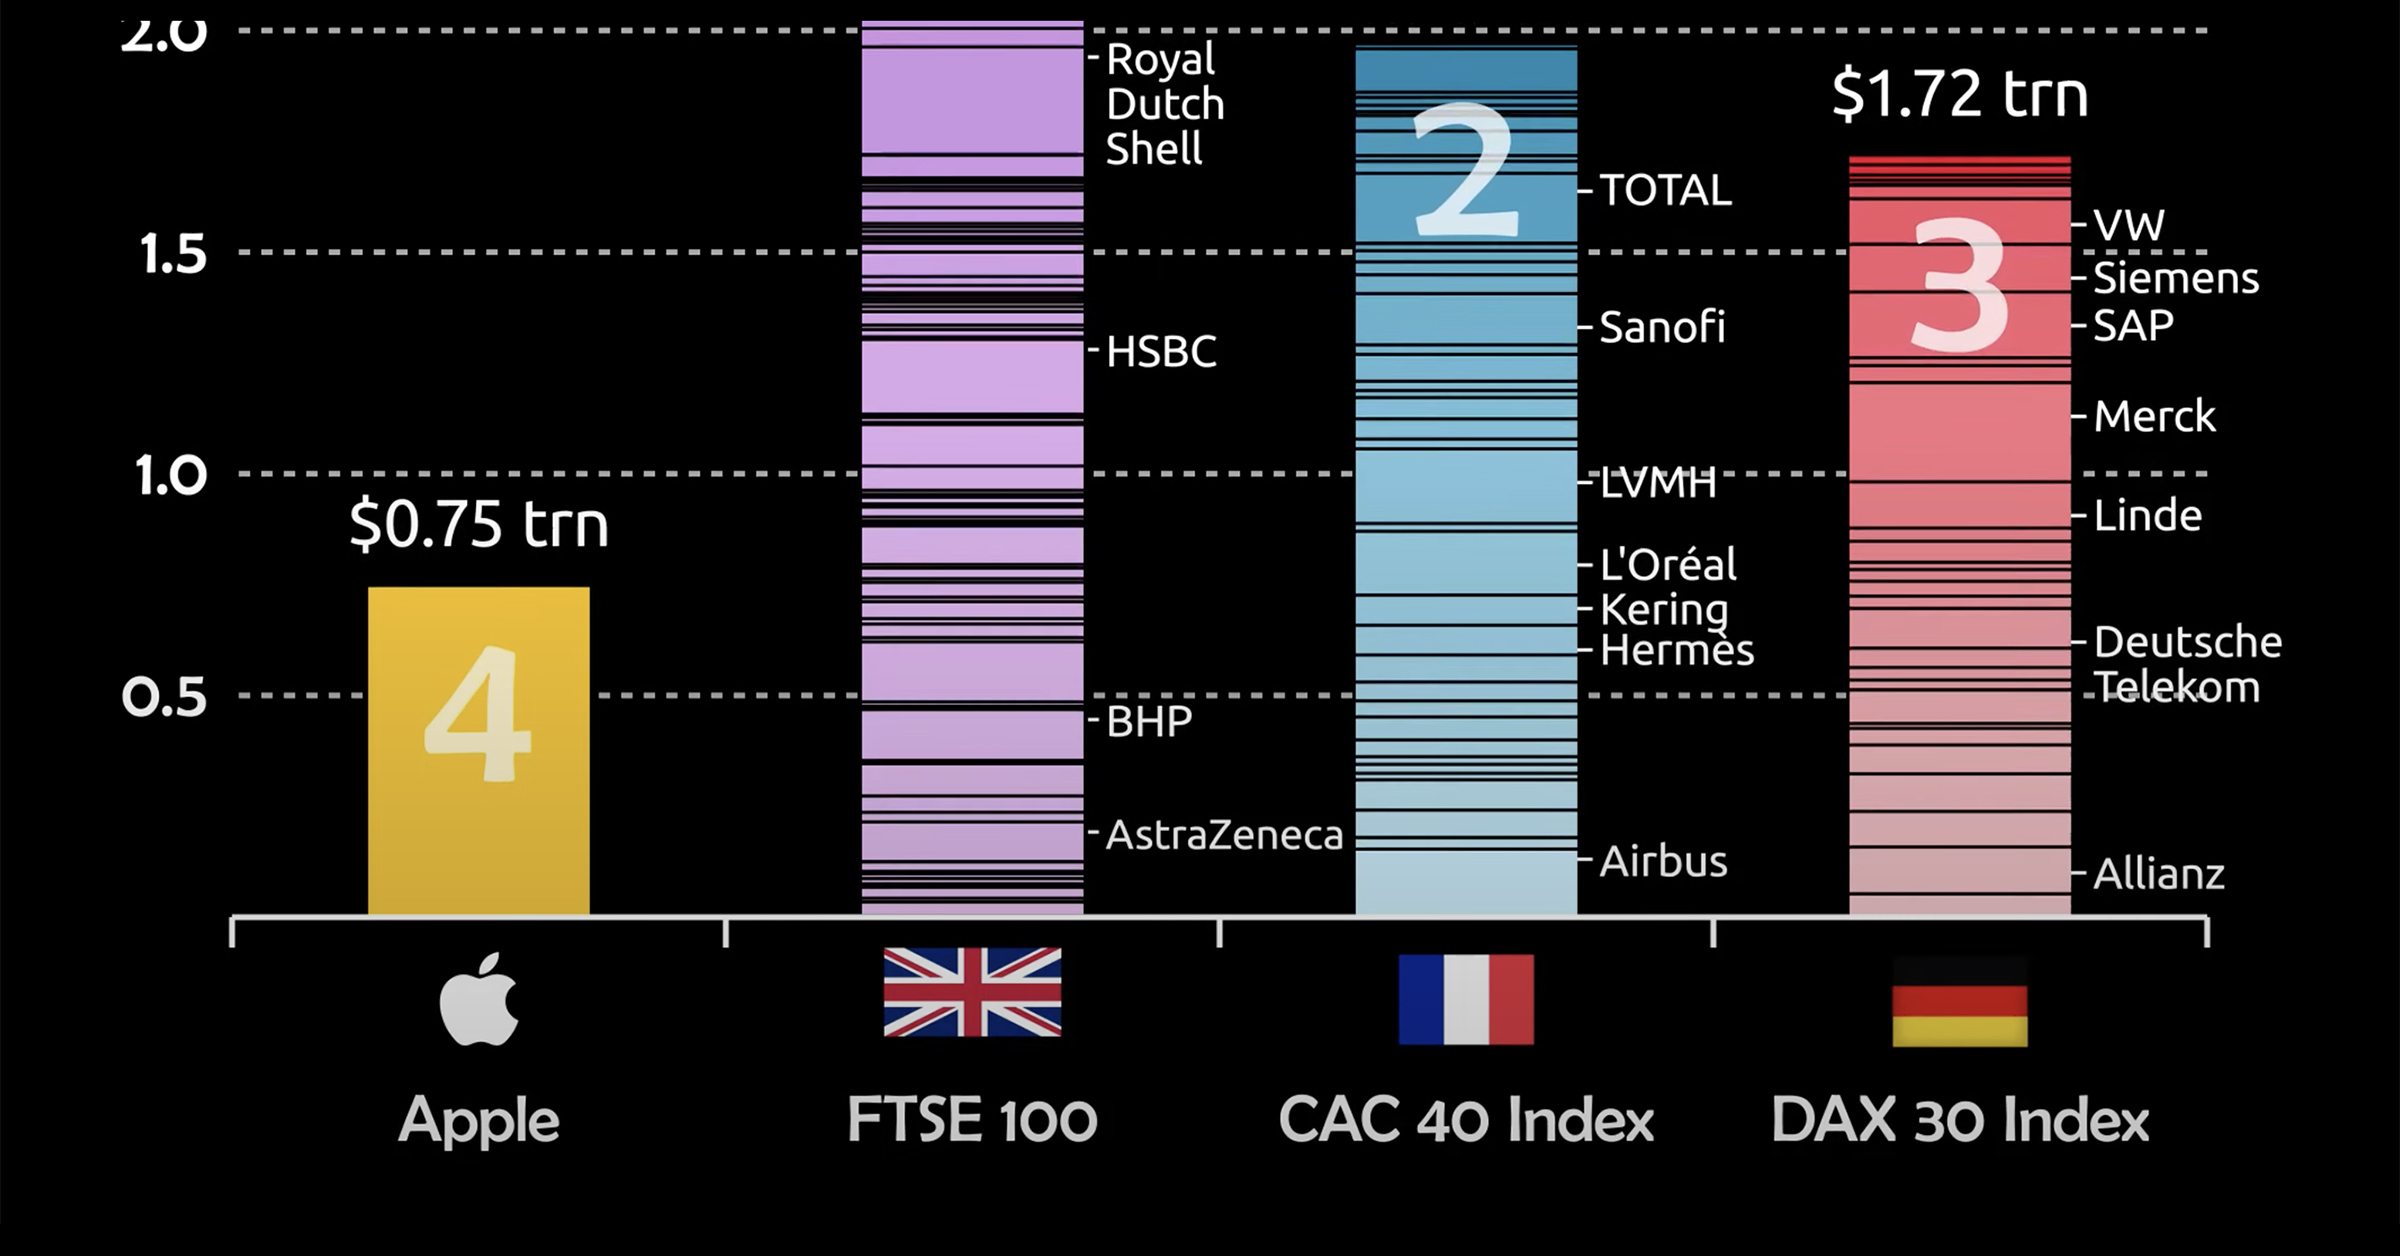
To gauge just how monstrous of a figure this is, consider that Apple is no longer comparable to just companies, but to countries and even entire stock indexes. This animation from James Eagle ranks the growth in Apple’s market cap alongside top indexes from the UK, France, and Germany.
Let’s take a closer look.
Apple Takes On Europe
The three indexes Apple is compared to are heavyweights in their own right.
The FTSE 100 consists of giants like HSBC and vaccine producer AstraZeneca, while the CAC 40 Index is home to LVMH, which made Bernard Arnault the richest man in the world for a period of time last year.
Nonetheless, Apple’s market cap exceeds that of the 100 companies in the FTSE, as well as the 40 in each of the CAC and DAX indexes.
| Stock/Index | Market Cap ($T) | Country of Origin |
|---|---|---|
| Apple | $3.00T | 🇺🇸 |
| FTSE 100 | $2.90T | 🇬🇧 |
| CAC 40 Index | $2.76T | 🇫🇷 |
| DAX 40 (Dax 30) Index* | $2.50T | 🇩🇪 |
*Germany’s flagship DAX Index expanded from 30 to 40 constituents in September 2021.
It’s important to note, that while Apple’s growth is stellar, European companies have simultaneously seen a decline in their share of the overall global stock market, which helps make these comparisons even more eye-catching.
For example, before 2005, publicly-traded European companies represented almost 30% of global stock market capitalization, but those figures have been cut in half to just 15% today.
Here are some other approaches to measure Apple’s dominance.
Apple’s Revenue Per Minute vs Other Tech Giants
Stepping away from market capitalization, another unique way to measure Apple’s success is in how much sales they generate on a per minute basis. In doing so, we see that they generate a massive $848,090 per minute.
Here’s how Apple revenue per minute compares to other Big Tech giants:
| Company | Revenue Per Minute |
|---|---|
| Amazon | $955,517 |
| Apple | $848,090 |
| Alphabet (Google) | $433,014 |
| Microsoft | $327,823 |
| $213,628 | |
| Tesla | $81,766 |
| Netflix | $50,566 |
Furthermore, Apple’s profits aren’t too shabby either: their $20.5 billion in net income last quarter equates to $156,000 in profits per minute.
How Apple Compares To Countries
Lastly, we can compare Apple’s market cap to the GDP of countries.
| Country (excluding Apple) | Total Value ($T) |
|---|---|
| Apple | $3.0T |
| Italy | $2.0T |
| Brazil | $1.8T |
| Canada | $1.7T |
| Russia | $1.7T |
| South Korea | $1.6T |
| Australia | $1.4T |
| Spain | $1.4T |
| Mexico | $1.3T |
| Indonesia | $1.1T |
What might be most impressive here is that Apple’s market cap eclipses the GDP of major developed economies, such as Canada and Australia. That means the company is more valuable than the entire economic production of these countries in a calendar year.
That’s some serious scale.

This article was published as a part of Visual Capitalist's Creator Program, which features data-driven visuals from some of our favorite Creators around the world.


Technology
Countries With the Highest Rates of Crypto Ownership
While the U.S. is a major market for cryptocurrencies, two countries surpass it in terms of their rates of crypto ownership.


Countries With the Highest Rates of Crypto Ownership
This was originally posted on our Voronoi app. Download the app for free on iOS or Android and discover incredible data-driven charts from a variety of trusted sources.
This graphic ranks the top 10 countries by their rate of cryptocurrency ownership, which is the percentage of the population that owns crypto. These figures come from crypto payment gateway, Triple-A, and are as of 2023.
Data and Highlights
The table below lists the rates of crypto ownership in the top 10 countries, as well as the number of people this amounts to.
| Country | % of Population Who Own Crypto | # of Crypto Owners |
|---|---|---|
| 🇦🇪 United Arab Emirates | 30.4 | 3M |
| 🇻🇳 Vietnam | 21.2 | 21M |
| 🇺🇸 U.S. | 15.6 | 53M |
| 🇮🇷 Iran | 13.5 | 12M |
| 🇵🇭 Philippines | 13.4 | 16M |
| 🇧🇷 Brazil | 12 | 26M |
| 🇸🇦 Saudi Arabia | 11.4 | 4M |
| 🇸🇬 Singapore | 11.1 | 665K |
| 🇺🇦 Ukraine | 10.6 | 4M |
| 🇻🇪 Venezuela | 10.3 | 3M |
Note that if we were to rank countries based on their actual number of crypto owners, India would rank first at 93 million people, China would rank second at 59 million people, and the U.S. would rank third at 52 million people.
The UAE Takes the Top Spot
The United Arab Emirates (UAE) boasts the highest rates of crypto ownership globally. The country’s government is considered to be very crypto friendly, as described in Henley & Partners’ Crypto Wealth Report 2023:
In the UAE, the Financial Services Regulatory Authority (FSRA-ADGM) was the first to provide rules and regulations regarding cryptocurrency purchasing and selling. The Emirates are generally very open to new technologies and have proposed zero taxes for crypto owners and businesses.
Vietnam leads Southeast Asia
According to the Crypto Council for Innovation, cryptocurrency holdings in Vietnam are also untaxed, making them an attractive asset.
Another reason for Vietnam’s high rates of ownership could be its large unbanked population (people without access to financial services). Cryptocurrencies may provide an alternative means of accessing these services without relying on traditional banks.
Learn More About Crypto From Visual Capitalist
If you enjoyed this post, be sure to check out The World’s Largest Corporate Holders of Bitcoin, which ranks the top 12 publicly traded companies by their Bitcoin holdings.

-

 Personal Finance1 week ago
Visualizing the Tax Burden of Every U.S. State
-

 Misc6 days ago
Visualized: Aircraft Carriers by Country
-

 Culture7 days ago
How Popular Snack Brand Logos Have Changed
-

 Mining1 week ago
Visualizing Copper Production by Country in 2023
-

 Misc1 week ago
Charted: How Americans Feel About Federal Government Agencies
-

 Healthcare1 week ago
Which Countries Have the Highest Infant Mortality Rates?
-

 Demographics1 week ago
Mapped: U.S. Immigrants by Region
-

 Maps1 week ago
Mapped: Southeast Asia’s GDP Per Capita, by Country