Technology
Countries Ranked by Their Economic Complexity
Countries Ranked by Their Economic Complexity
In the past, the trade between nations was a much simpler matter to grasp. Commodities and a few finished goods moved between a handful of countries in a straightforward way.
Today, around 6,000 officially classified products pass through the world’s ports, and digital products and services zip across country lines creating an extra layer of difficulty in measuring economic activity.
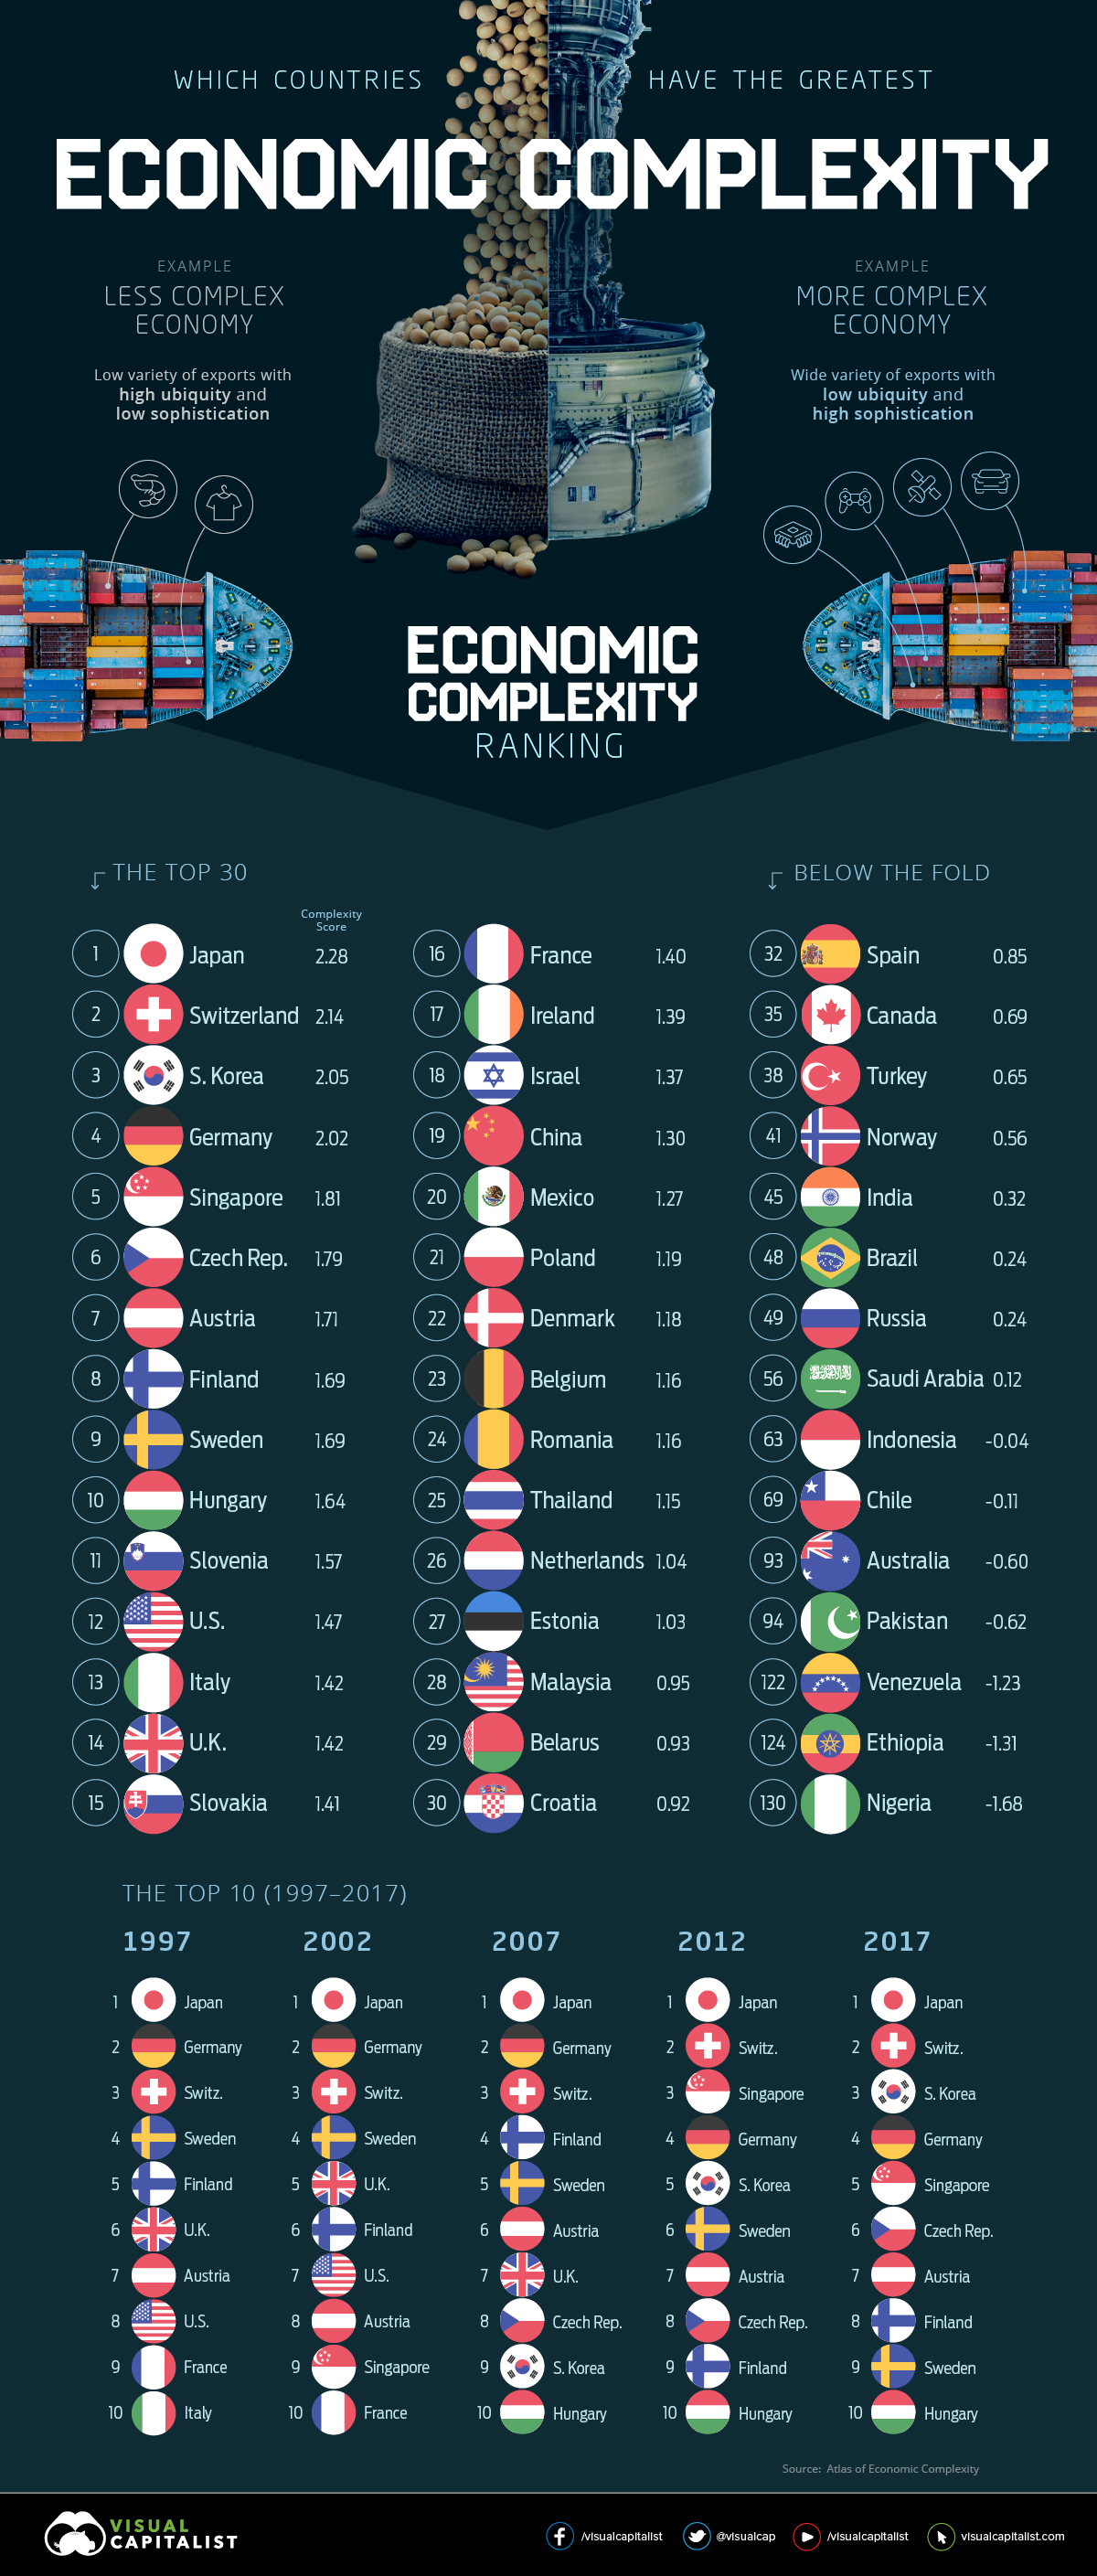
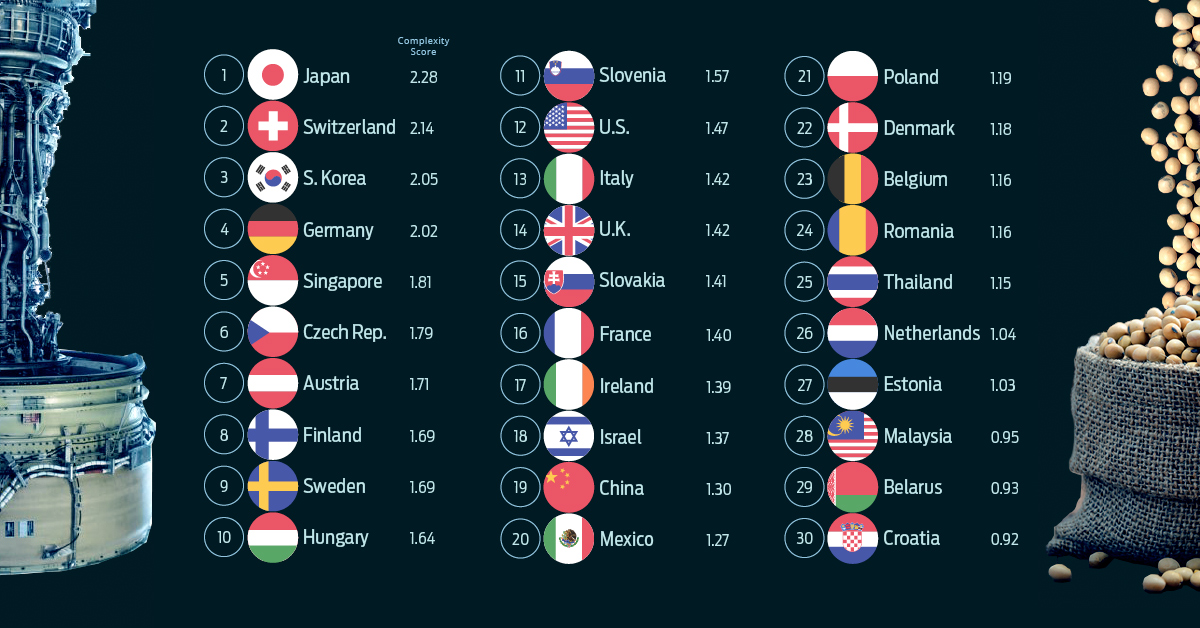
To try to understand this enormous level of economic complexity, the team at Harvard’s Growth Lab have created the Country Complexity Ranking. Here’s a look at the top 50 countries in the ranking:
| Rank | Country | Score | Top Export(s) |
|---|---|---|---|
| 1 | Japan | 2.28 | Cars, ICT (tech) |
| 2 | Switzerland | 2.14 | ICT, gold, packaged medicaments |
| 3 | South Korea | 2.05 | ICT, cars |
| 4 | Germany | 2.02 | Integrated circuits, ICT, cars |
| 5 | Singapore | 1.81 | ICT, cars |
| 6 | Czech Rep. | 1.79 | Cars, vehicle parts |
| 7 | Austria | 1.71 | ICT, tourism |
| 8 | Finland | 1.69 | ICT |
| 9 | Sweden | 1.67 | ICT |
| 10 | Hungary | 1.64 | ICT, cars |
| 11 | Slovenia | 1.57 | Cars, ICT |
| 12 | United States | 1.47 | ICT, tourism |
| 13 | Italy | 1.42 | ICT, tourism |
| 14 | United Kingdom | 1.42 | ICT, finance |
| 15 | Slovakia | 1.41 | Cars |
| 16 | France | 1.40 | ICT, tourism |
| 17 | Ireland | 1.39 | ICT |
| 18 | Israel | 1.37 | ICT, diamonds |
| 19 | China | 1.30 | Electronic equipment |
| 20 | Mexico | 1.27 | Cars |
| 21 | Poland | 1.19 | ICT |
| 22 | Denmark | 1.18 | Transport, ICT |
| 23 | Belgium | 1.16 | ICT |
| 24 | Romania | 1.16 | ICT, vehicle parts |
| 25 | Thailand | 1.15 | Tourism |
| 26 | Netherlands | 1.04 | ICT |
| 27 | Estonia | 1.03 | ICT, transport |
| 28 | Malaysia | 0.95 | Integrated circuits |
| 29 | Belarus | 0.93 | Refined oils, ICT |
| 30 | Croatia | 0.92 | Tourism, ICT |
| 31 | Lithuania | 0.85 | Transport, refined oils |
| 32 | Spain | 0.85 | Tourism, ICT |
| 33 | Philippines | 0.75 | Integrated circuits, ICT |
| 34 | Portugal | 0.72 | Tourism, ICT |
| 35 | Canada | 0.69 | Crude oil, cars, ICT |
| 36 | Bosnia and Herz. | 0.65 | Tourism, ICT |
| 37 | Serbia | 0.65 | ICT |
| 38 | Turkey | 0.65 | Tourism, transport |
| 39 | Latvia | 0.64 | Transport, ICT |
| 40 | Bulgaria | 0.62 | Tourism, ICT |
| 41 | Norway | 0.56 | Crude oil, petrol. gases |
| 42 | Ukraine | 0.42 | ICT, transport |
| 43 | Cyprus | 0.38 | Tourism, transport |
| 44 | Tunisia | 0.34 | Electrical wire, tourism |
| 45 | India | 0.32 | ICT |
| 46 | Costa Rica | 0.30 | ICT, tourism |
| 47 | Uruguay | 0.29 | Tourism, wood pulp |
| 48 | Brazil | 0.24 | Soya beans, iron ore |
| 49 | Russia | 0.24 | Crude oil, refined oils |
| 50 | Lebanon | 0.24 | Tourism, ICT |
Japan, Switzerland, and South Korea sit at the top of the ranking.
Czech Republic – which was recently ranked as the most attractive manufacturing destination in Europe – has a strong showing, ranking 6th in the world. The United States slipped out of the top 10 into 12th position.
The Power of Productive Knowledge
Highly ranked countries tend to have the following attributes:
-
• A high diversity of exported products
• Sophisticated and unique exported products (i.e. few other countries produce similar products)
In short, the ranking hinges on the concept of “productive knowledge” – or the tacit ability to produce a product.
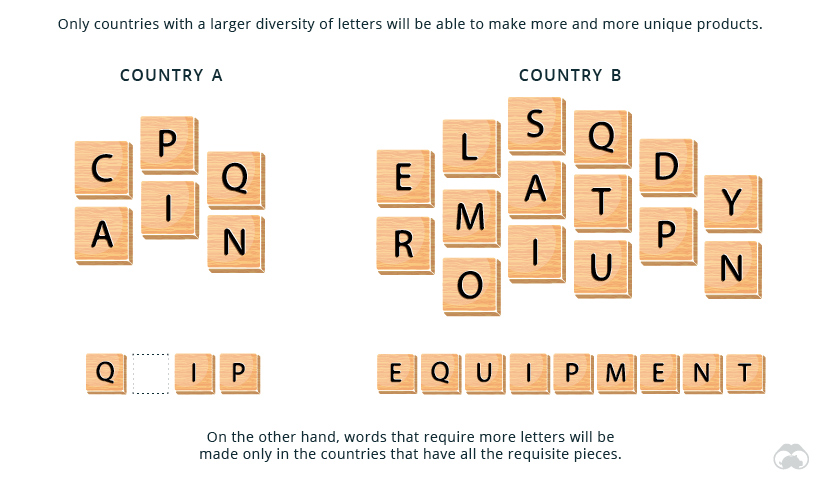
Muhammed Yildirim, of Harvard University, has thought up a useful analogy for thinking about the role of productive knowledge in the complexity of an economy:
“Suppose that each type of productive knowledge is a letter and each product is a word composed of these letters. Like the game of Scrabble, each country holds a set of letters with plenty of copies of each letter and tries to make words out of these letters. For instance, with letters like A, C and T, one can construct words like CAT or ACT. Then our problem of measuring economic complexity resembles interpreting how many different letters there are in each country’s portfolio. Some letters, like A and E, go in many words, whereas other letters, like X and Q, are used in very few. Extending this analogy to the countries and products, only those with a larger diversity of letters will be able to make more and more unique products. On the other hand, words that require more letters will be made only in the countries that have all the requisite pieces.”
Not All Exports are Created Equal
Much like the rack of letters in a Scrabble game, the elements of every export-driven economy can be broken down and quantified. The resulting categories encompass everything from rendered pig fat to integrated circuits, each contributing to the country’s overall score.
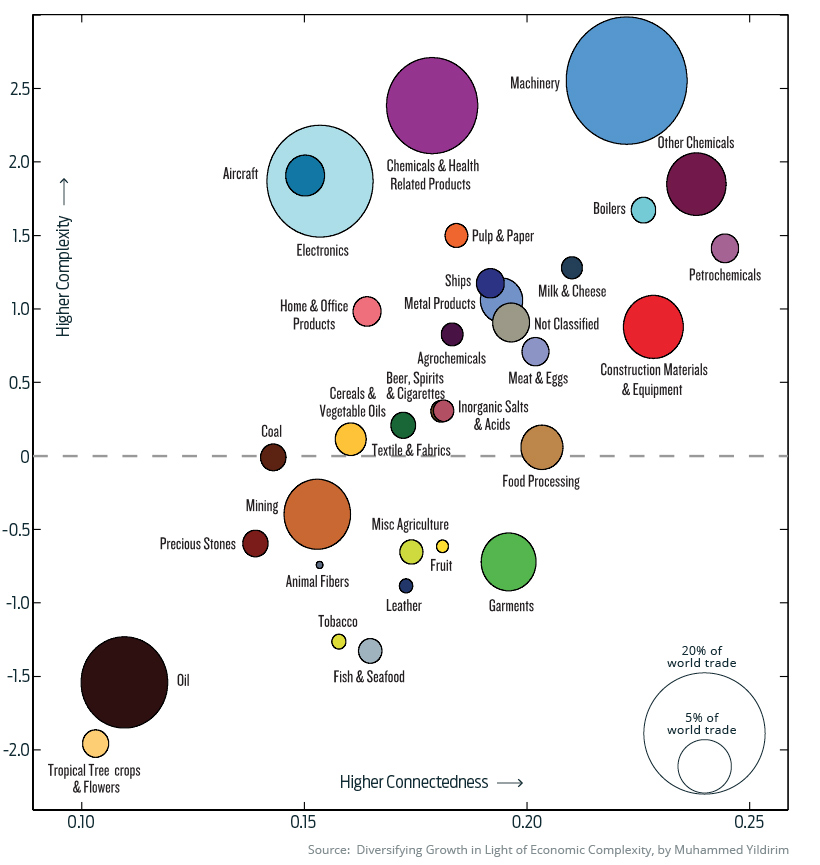
Agricultural and extractive industries tend to score lower on the complexity scale. Machinery can be highly complex to produce and is connected to many facets of the global economy.
Visualizing this overall mix of categories can provide a unique perspective beyond big picture numbers like GDP. Below are a few real world examples of export markets on both ends of the complexity spectrum.
Japan
Since this ranking began in the mid-1990s, Japan has never been bumped from the top spot.
Due to a restricted land mass and some ingenuity, Japan has become the prototypical example of a low-ubiquity, high-sophistication export economy.
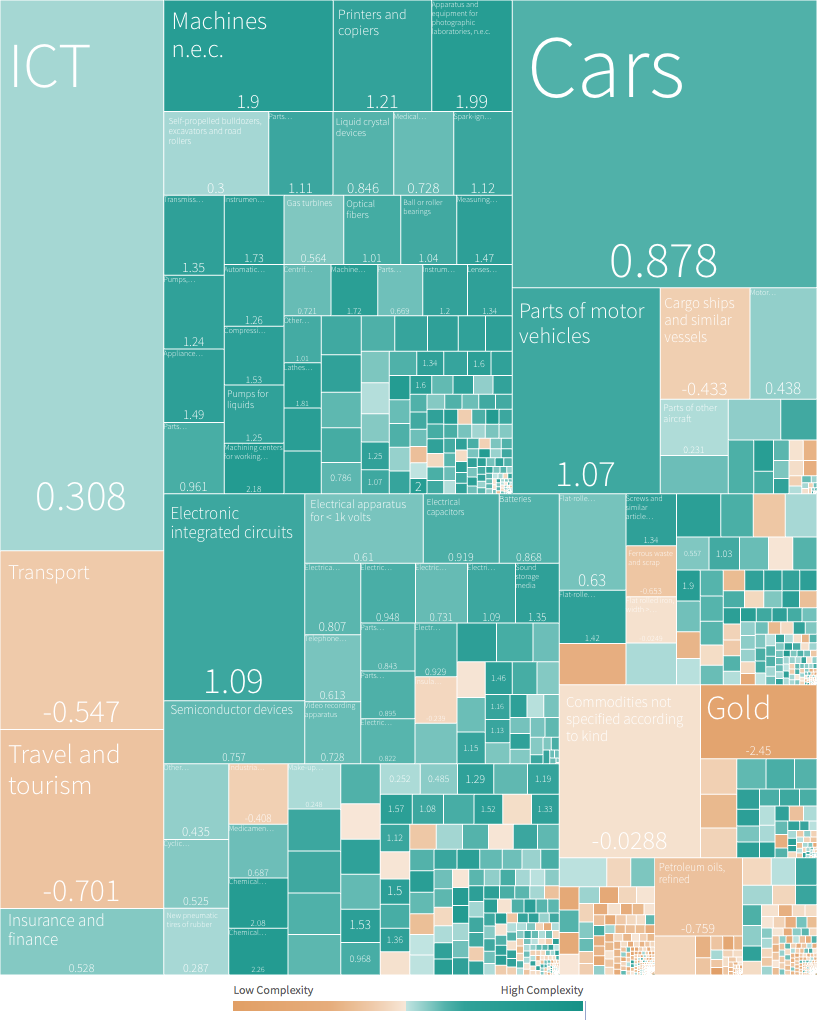
Cars and electronics are obvious standouts, but there numerous other high-value product categories in the mix as well. The country also has a wide variety of high value exports and trading partners, lowering the risk of a trade war or industry downturn crippling the country’s economy.
Australia
Many will be surprised to learn that Australia sits in the lower third of this complexity ranking.
Although Australia’s global ranking is high in a myriad of categories – household wealth per person, for example – its economic complexity score is -0.60, much lower than expected for its income level. Looking at the breakdown below, there are clues as to why this might be the case.
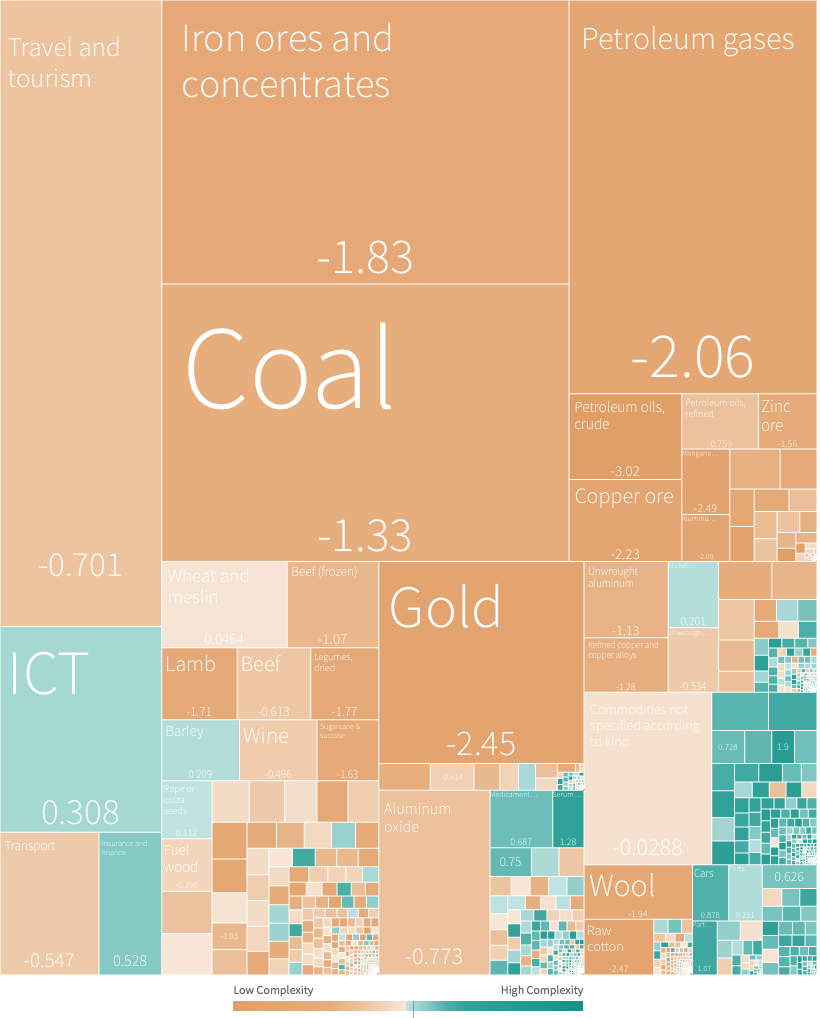
Australia’s largest exports are in low complexity categories, such as minerals and agriculture. To compound matters, the country’s economy is heavily linked to China’s. To underscore this point, a recent study found that a 5% drop in China’s GDP would result in a 2.5% dip in Australia’s.
Venezuela
It’s no secret that Venezuela has seen some tough times in recent years. The chart below shows just how reliant Venezuela was on oil exports to sustain its economy.
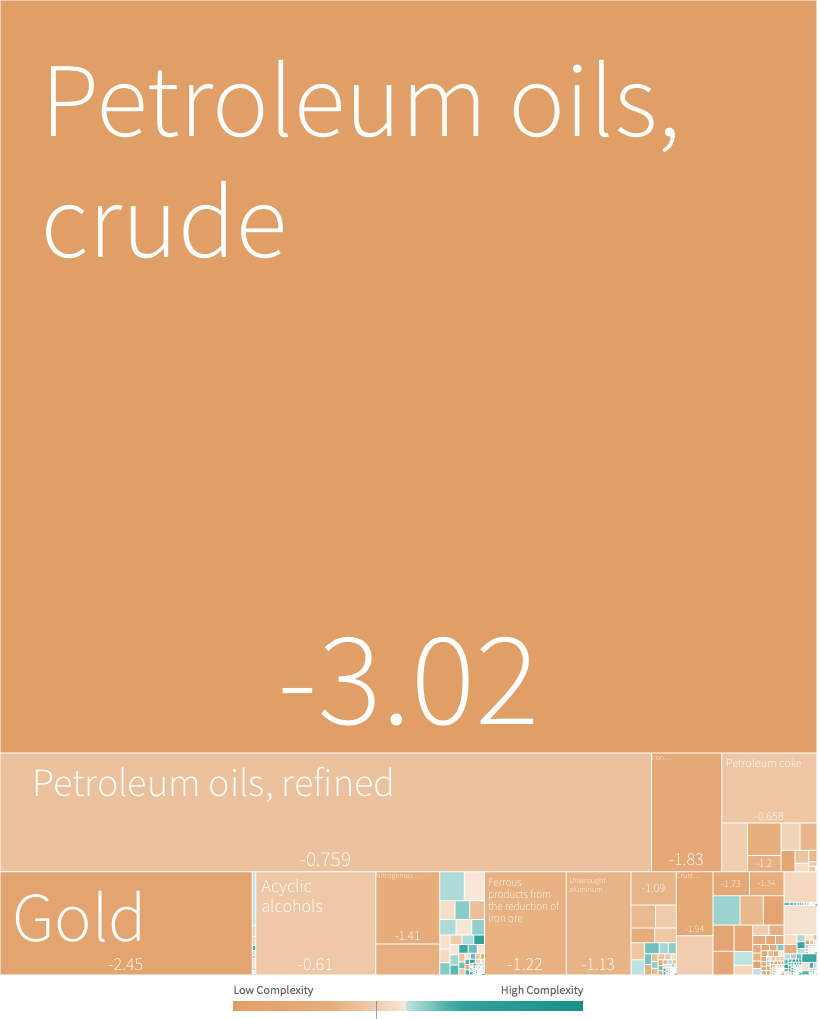
An over-reliance on a single export can leave a country extremely vulnerable in the event of price volatility or geopolitical events. In the case of Venezuela, three quarters of their export economy was comprised of crude oil – one of the lowest scoring product categories in the ranking.
The Rush to Diversify
A low level of economic complexity isn’t necessarily a problem. Many countries with middle-to-low scores in the ranking have great standards of living and a high level of wealth. Countries like Canada, Norway, and Australia were all well down the list.
On the other hand, some countries have made diversification a priority. SoftBank’s $100 billion Vision Fund is partially the result of Saudi Arabia’s push to develop a diversified, knowledge-based economy. Other oil-rich nations, such as Kazakhstan, are also pushing to diversify in the face of the world’s evolving energy mix.
As world economies evolve and the shift from fossil fuels continues, we will likely see economic complexity increase across the board.


Technology
Visualizing AI Patents by Country
See which countries have been granted the most AI patents each year, from 2012 to 2022.


Visualizing AI Patents by Country
This was originally posted on our Voronoi app. Download the app for free on iOS or Android and discover incredible data-driven charts from a variety of trusted sources.
This infographic shows the number of AI-related patents granted each year from 2010 to 2022 (latest data available). These figures come from the Center for Security and Emerging Technology (CSET), accessed via Stanford University’s 2024 AI Index Report.
From this data, we can see that China first overtook the U.S. in 2013. Since then, the country has seen enormous growth in the number of AI patents granted each year.
| Year | China | EU and UK | U.S. | RoW | Global Total |
|---|---|---|---|---|---|
| 2010 | 307 | 137 | 984 | 571 | 1,999 |
| 2011 | 516 | 129 | 980 | 581 | 2,206 |
| 2012 | 926 | 112 | 950 | 660 | 2,648 |
| 2013 | 1,035 | 91 | 970 | 627 | 2,723 |
| 2014 | 1,278 | 97 | 1,078 | 667 | 3,120 |
| 2015 | 1,721 | 110 | 1,135 | 539 | 3,505 |
| 2016 | 1,621 | 128 | 1,298 | 714 | 3,761 |
| 2017 | 2,428 | 144 | 1,489 | 1,075 | 5,136 |
| 2018 | 4,741 | 155 | 1,674 | 1,574 | 8,144 |
| 2019 | 9,530 | 322 | 3,211 | 2,720 | 15,783 |
| 2020 | 13,071 | 406 | 5,441 | 4,455 | 23,373 |
| 2021 | 21,907 | 623 | 8,219 | 7,519 | 38,268 |
| 2022 | 35,315 | 1,173 | 12,077 | 13,699 | 62,264 |
In 2022, China was granted more patents than every other country combined.
While this suggests that the country is very active in researching the field of artificial intelligence, it doesn’t necessarily mean that China is the farthest in terms of capability.
Key Facts About AI Patents
According to CSET, AI patents relate to mathematical relationships and algorithms, which are considered abstract ideas under patent law. They can also have different meaning, depending on where they are filed.
In the U.S., AI patenting is concentrated amongst large companies including IBM, Microsoft, and Google. On the other hand, AI patenting in China is more distributed across government organizations, universities, and tech firms (e.g. Tencent).
In terms of focus area, China’s patents are typically related to computer vision, a field of AI that enables computers and systems to interpret visual data and inputs. Meanwhile America’s efforts are more evenly distributed across research fields.
Learn More About AI From Visual Capitalist
If you want to see more data visualizations on artificial intelligence, check out this graphic that shows which job departments will be impacted by AI the most.

-

 Mining1 week ago
Gold vs. S&P 500: Which Has Grown More Over Five Years?
-

 Markets2 weeks ago
Ranked: The Most Valuable Housing Markets in America
-

 Money2 weeks ago
Which States Have the Highest Minimum Wage in America?
-

 AI2 weeks ago
Ranked: Semiconductor Companies by Industry Revenue Share
-

 Markets2 weeks ago
Ranked: The World’s Top Flight Routes, by Revenue
-

 Countries2 weeks ago
Population Projections: The World’s 6 Largest Countries in 2075
-

 Markets2 weeks ago
The Top 10 States by Real GDP Growth in 2023
-

 Demographics2 weeks ago
The Smallest Gender Wage Gaps in OECD Countries