Markets
Comparing the Speed of U.S. Interest Rate Hikes (1988-2022)
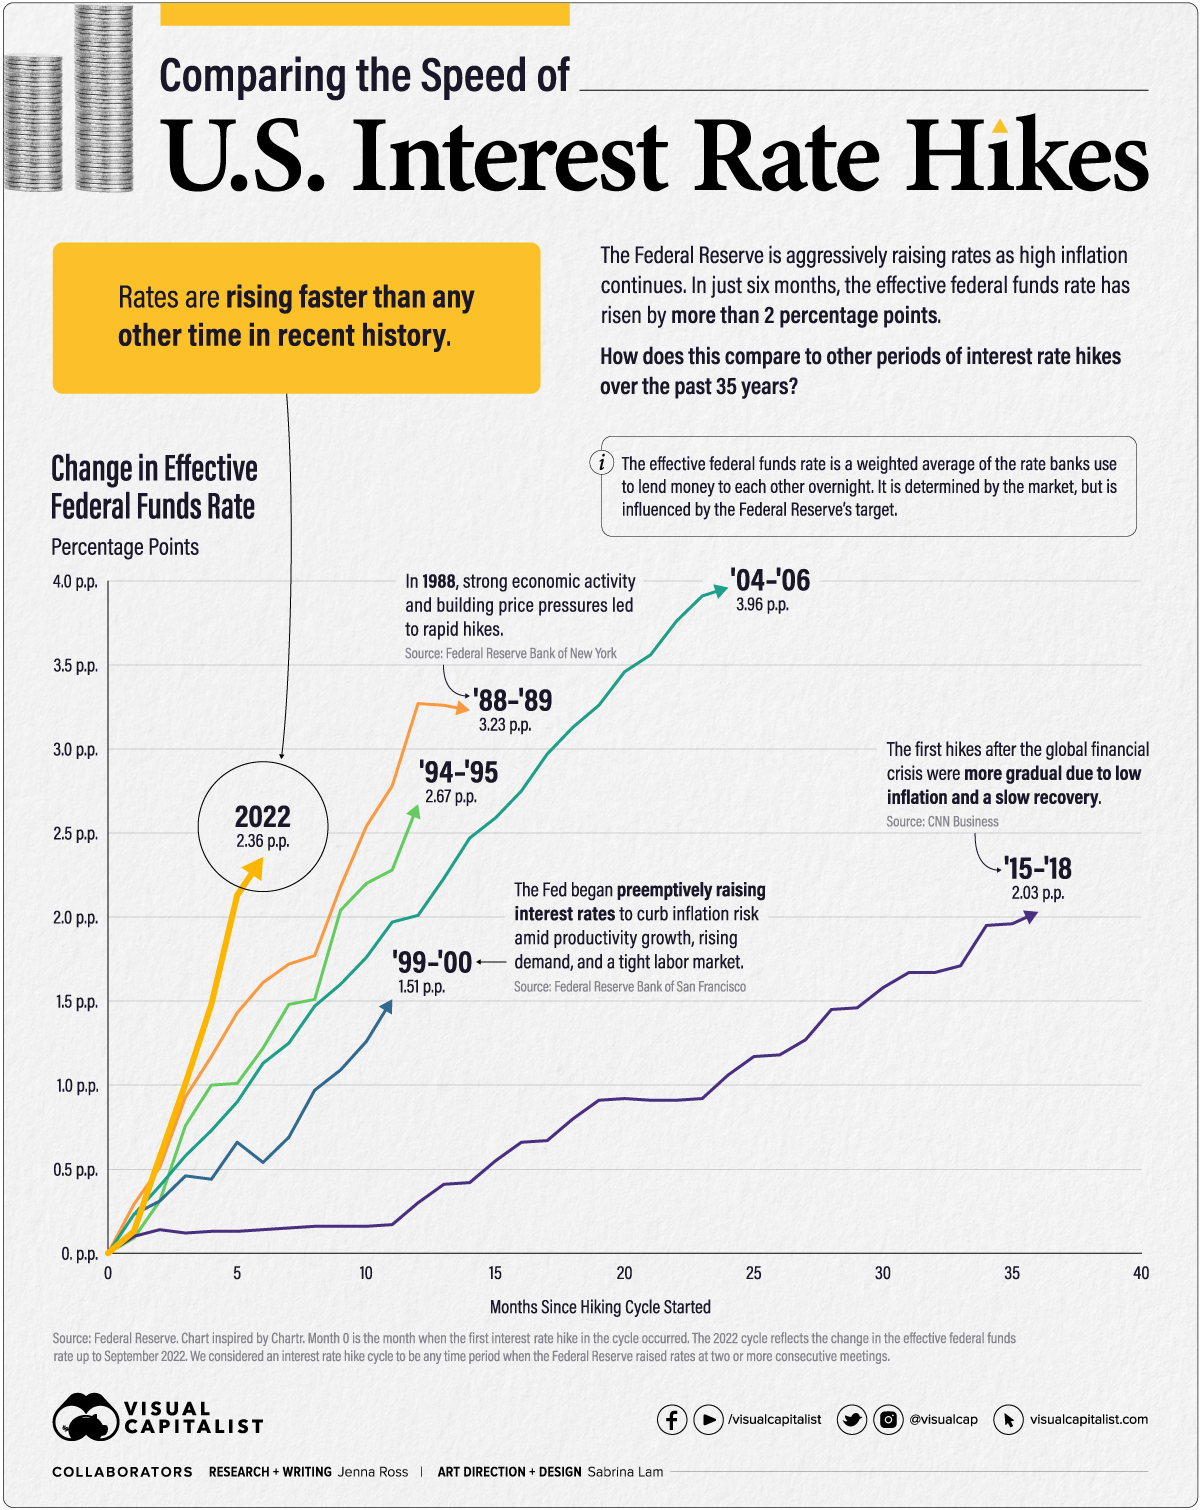


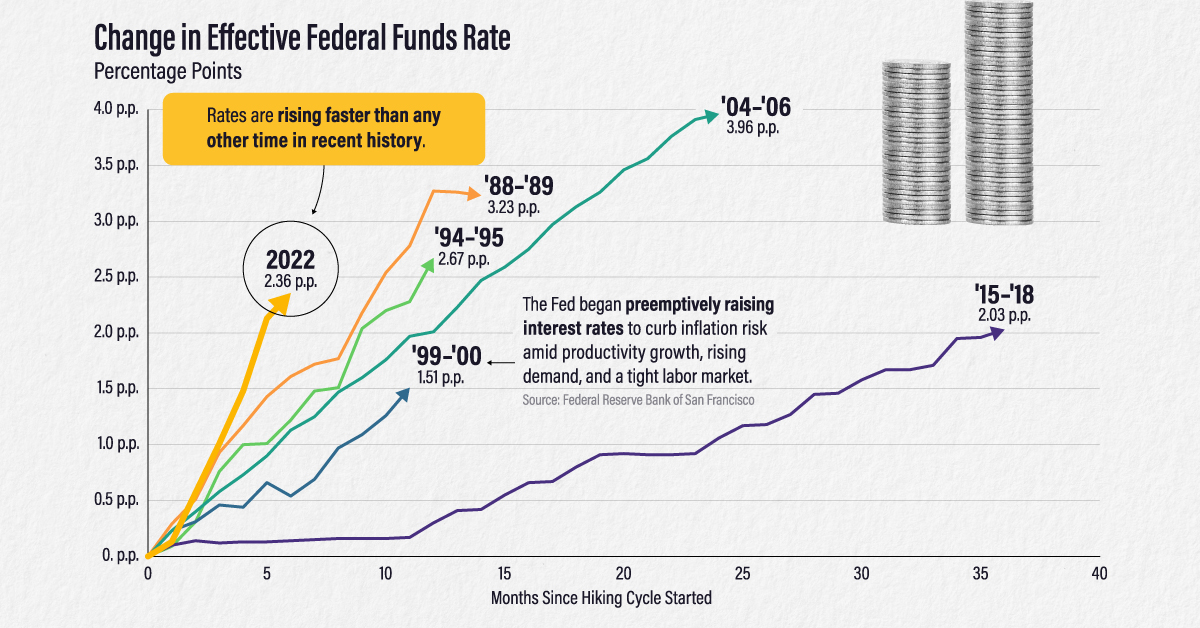
Comparing the Speed of U.S. Interest Rate Hikes
As U.S. inflation remains at multi-decade highs, the Federal Reserve has been aggressive with its interest rate hikes. In fact, rates have risen more than two percentage points in just six months.
In this graphic—which was inspired by a chart from Chartr—we compare the speed and severity of the current interest rate hikes to other periods of monetary tightening over the past 35 years.
Measuring Periods of Interest Rate Hikes
We used the effective federal funds rate (EFFR), which measures the weighted average of the rates that banks use to lend to each other overnight. It is determined by the market but influenced by the Fed’s target range. We considered the starting point for each cycle to be the EFFR during the month when the first rate hike took place.
Here is the duration and severity of each interest rate hike cycle since 1988.
| Time Period | Duration (Months) | Total Change in EFFR (Percentage Points) |
|---|---|---|
| Mar 1988 - May 1989 | 14 | 3.23 |
| Feb 1994 - Feb 1995 | 12 | 2.67 |
| Jun 1999 - May 2000 | 11 | 1.51 |
| Jun 2004 - Jun 2006 | 24 | 3.96 |
| Dec 2015 - Dec 2018 | 36 | 2.03 |
| Mar 2022 - Sep 2022 | 6 | 2.36 |
* We considered a rate hike cycle to be any time period when the Federal Reserve raised rates at two or more consecutive meetings. The 2022 rate hike cycle is ongoing with data as of September 2022.
The 2022 rate hike cycle is the fastest, reaching a 2.36 percentage point increase nearly twice as fast as the rate hike cycle of ‘88-‘89.
On the other hand, the most severe interest rate hikes occurred in the ‘04 – ‘06 cycle when the EFFR climbed by almost four percentage points. It took much longer to reach this level, however, with the hikes taking place over two years.
Timing Interest Rate Hikes
Why are 2022’s interest rate hikes so rapid? U.S. inflation far exceeds the Fed’s long-term target of 2%. In fact, when the hikes started in March 2022, inflation was the highest it’s ever been in the last six rate hike cycles.
| Time Period | Inflation Rate at Start of Cycle |
|---|---|
| Mar 1988 - May 1989 | 3.60% |
| Feb 1994 - Feb 1995 | 2.06% |
| Jun 1999 - May 2000 | 1.40% |
| Jun 2004 - Jun 2006 | 2.89% |
| Dec 2015 - Dec 2018 | 0.30% |
| Mar 2022 - Sep 2022 | 6.77% |
Inflation rate is the year-over-year change as measured by the Personal Consumption Expenditures (PCE) Index.
In contrast, three of the rate hike cycles started with inflation at or below the 2% target. Inflation was just 0.30% in December 2015 when the Fed announced its first rate hike since the global financial crisis.
Some criticized the Fed for raising rates prematurely, but the Fed’s rationale was that it can take up to three years or more for policy actions to affect economic conditions. By raising rates early and gradually, the Fed hoped to avoid surging inflation in the future.
Fast forward to today, and the picture couldn’t look more different. Inflation exceeded the 2% target for 12 months before the Fed began to raise rates. Initially, the Fed believed inflation was “transitory” or short-lived. Now, inflation is a top financial concern and there is a risk that it has gathered enough momentum that it will be difficult to bring down.
Balancing Inflation and Recession Risks
The Fed expects to raise its target rate to around 4.4% by the end of 2022, up from the current range of 3-3.25%. However, they don’t foresee inflation reaching their 2% target until 2025.
In the meantime, the rapid interest rate hikes could lead to an economic downturn. Risks of a global recession have increased as other central banks raise their rates too. The World Bank offers policymakers a number of suggestions to help avoid a recession:
- Central banks can communicate policy decisions clearly to secure inflation expectations and, hopefully, reduce how much they need to raise rates.
- Governments can carefully withdraw fiscal support, develop medium-term spending and tax policies, and provide targeted help to vulnerable households.
- Other economic policymakers can help relieve supply pressures through various measures. For instance, they can introduce policies to increase labor force participation, enhance global trade networks, and bring in measures to reduce energy consumption.
Will policymakers heed this advice and, if so, will it prove sufficient to avoid a global recession?


Markets
The Stocks Driving S&P 500 Returns in 2024
We show the top 10 S&P 500 stocks that are fueling the market’s rally as the index hovers near record-highs.

The Stocks Driving S&P 500 Returns in 2024
This was originally posted on our Voronoi app. Download the app for free on iOS or Android and discover incredible data-driven charts from a variety of trusted sources.
The S&P 500 is sitting at near-record highs, returning 15% year-to-date as of June 26, 2024.
Today, a limited number of stocks are powering the stock market’s rally as investors pour money into companies that are advancing AI technologies. As share prices skyrocket, many wonder if company valuations are overheated—or if they are supported by strong corporate fundamentals.
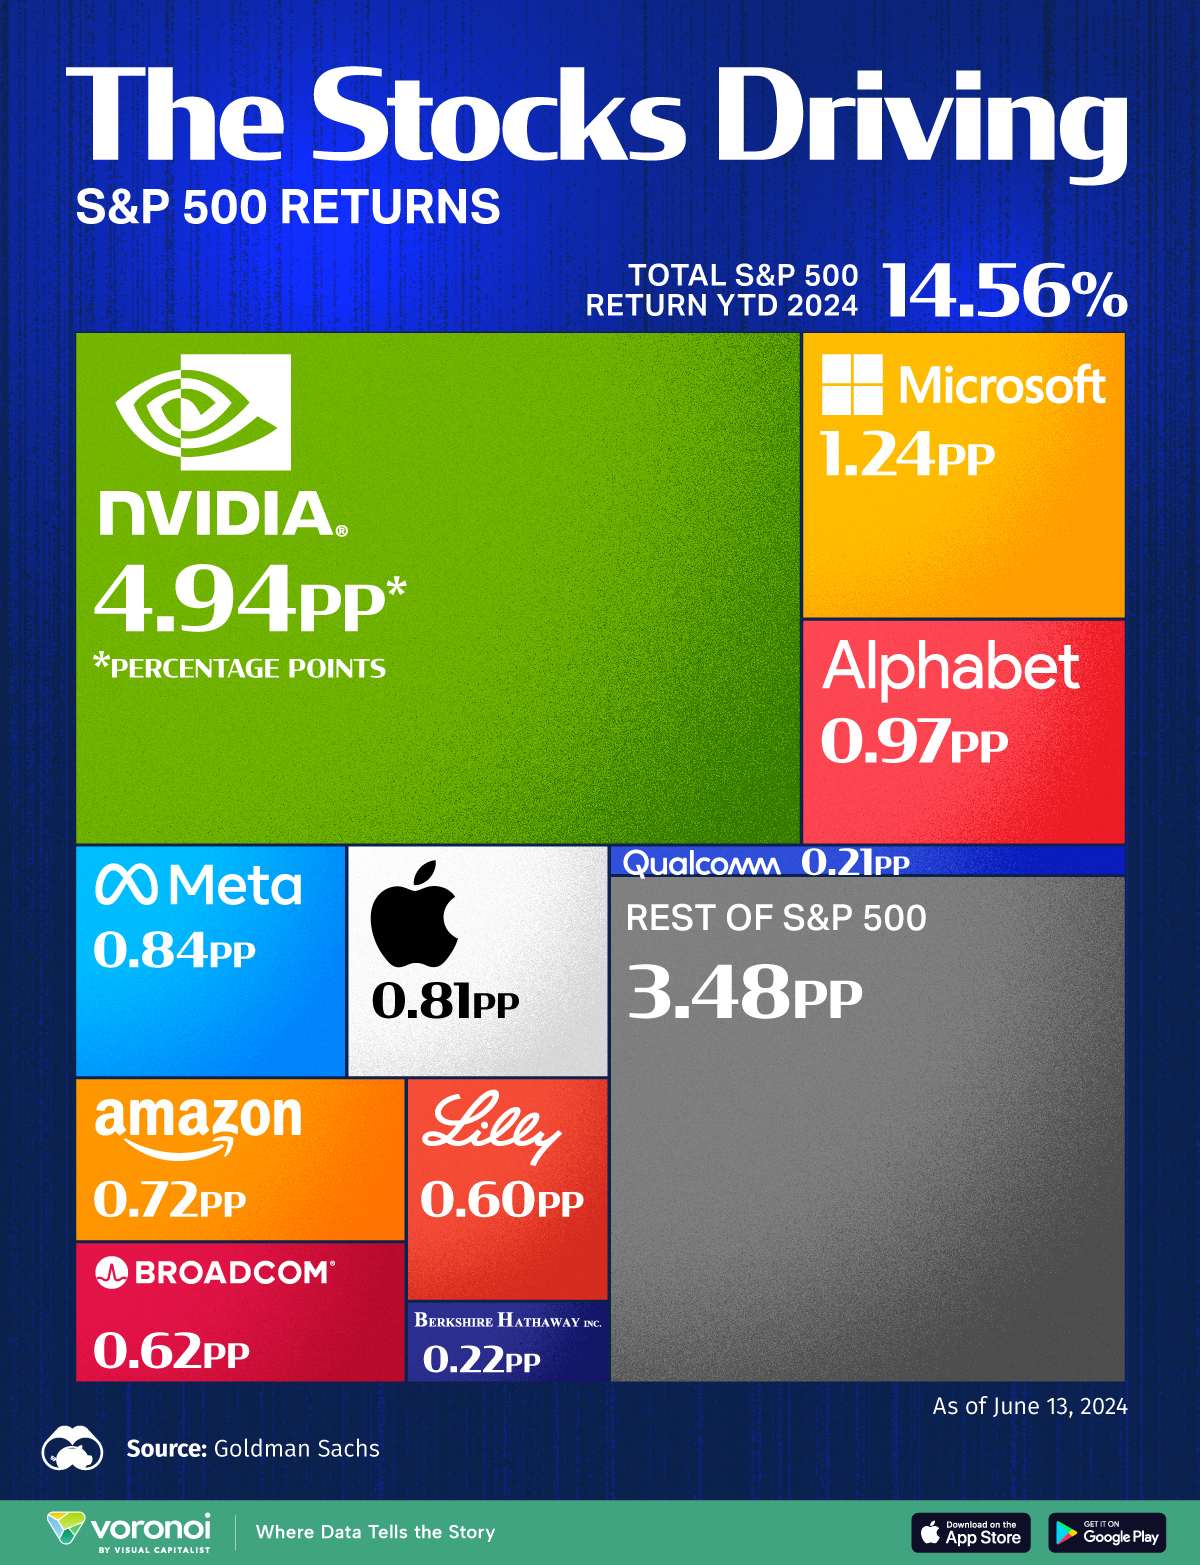
This graphic shows the top 10 S&P 500 stocks driving stock market returns in 2024, based on data from Goldman Sachs.
Big Tech Stocks Are Fueling Gains
Below, we show the companies making the largest contribution to the S&P 500’s rally:
| Rank | Company | Ticker | Contribution to S&P 500 Return YTD as of June 13, 2024 |
|---|---|---|---|
| 1 | Nvidia | NVDA | 4.94% |
| 2 | Microsoft | MSFT | 1.24% |
| 3 | Alphabet | GOOGL | 0.97% |
| 4 | Meta | META | 0.84% |
| 5 | Apple | AAPL | 0.81% |
| 6 | Amazon | AMZN | 0.72% |
| 7 | Broadcom | AVGO | 0.62% |
| 8 | Eli Lilly & Co. | LLY | 0.60% |
| 9 | Berkshire Hathaway | BRK.B | 0.22% |
| 10 | QUALCOMM | QCOM | 0.21% |
| Total S&P 500 Return YTD 2024 | 14.65% |
As of June 13, 2024.
Chipmaker Nvidia has driven over a third of S&P 500 returns this year, with its share price soaring 162% year-to-date as of June 13, 2024.
In June, Nvidia became the world’s most valuable firm, commanding an estimated 70% to 95% of the AI chip market. In the latest quarter, revenue surged by threefold compared to a year earlier amid high chip demand. Overall, big tech companies such as Meta, Amazon, and Microsoft made up roughly 45% of its data-center revenue, with Meta running a staggering 350,000 H100 chips to power its AI systems this year alone.
Falling in second is Microsoft, which has invested billions in AI startups including OpenAI and Wayve, a self-driving car firm. Microsoft is a cloud service provider for ChatGPT, the large language model built by OpenAI. As AI demand exceeds capacity, and other business segments see solid growth, Microsoft’s revenue increased 17% year-over-year as of the second quarter of 2024.
Google’s parent, Alphabet, ranks next, followed by Meta and Apple. Each of these companies is working on their own large language model which costs millions to train and run. Together, the top five stocks are driving about 60% of the S&P 500’s returns.
As we can see, just two of the top 10 S&P 500 stocks are not big tech names: pharmaceutical giant Eli Lilly and Berkshire Hathaway. This year, Eli Lilly’s share price is surging due to strong demand for its weight loss drug, Zepbound. During the first quarter of 2024, the newly-approved drug generated over $517 million in sales. Given its reported effectiveness, some analysts are forecasting it could be the best-selling drug ever in American history.

-
 Markets2 weeks ago
The Growth of $100 Invested in Jim Simons’ Medallion Fund
-

 Misc1 week ago
Chart: Which Countries Eat the Most Instant Noodles?
-
 Misc1 week ago
Ranked: The 10 Highest-Grossing Concert Tours of All Time
-

 Maps1 week ago
Charted: Unauthorized Immigrants in the U.S., by Country of Origin
-

 Misc1 week ago
Ranked: The Top 10 U.S. Pizza Chains by Market Share
-
 Maps1 week ago
Mapped: 15 Countries with the Highest Smoking Rates
-
 Markets1 week ago
Ranked: Which NHL Team Takes Home the Most Revenue?
-
 Maps2 weeks ago
Mapped: Highest and Lowest Doctor Density Around the World