Markets
How China Overtook the U.S. as the World’s Major Trading Partner
How China Overtook the U.S. As the World’s Trade Partner
In 2018, trade accounted for 59% of global GDP, up nearly 1.5 times since 1980.
Over this timeframe, international trade has transformed significantly—not just in terms of volume and composition, but also in terms of the countries that the rest of the world leans on for their most important trade relationships.
Now, a critical shift is occurring in the landscape, and it may surprise you to learn that China has already usurped the U.S. as the world’s most dominant trading partner.
Trading Places: A Global Shift
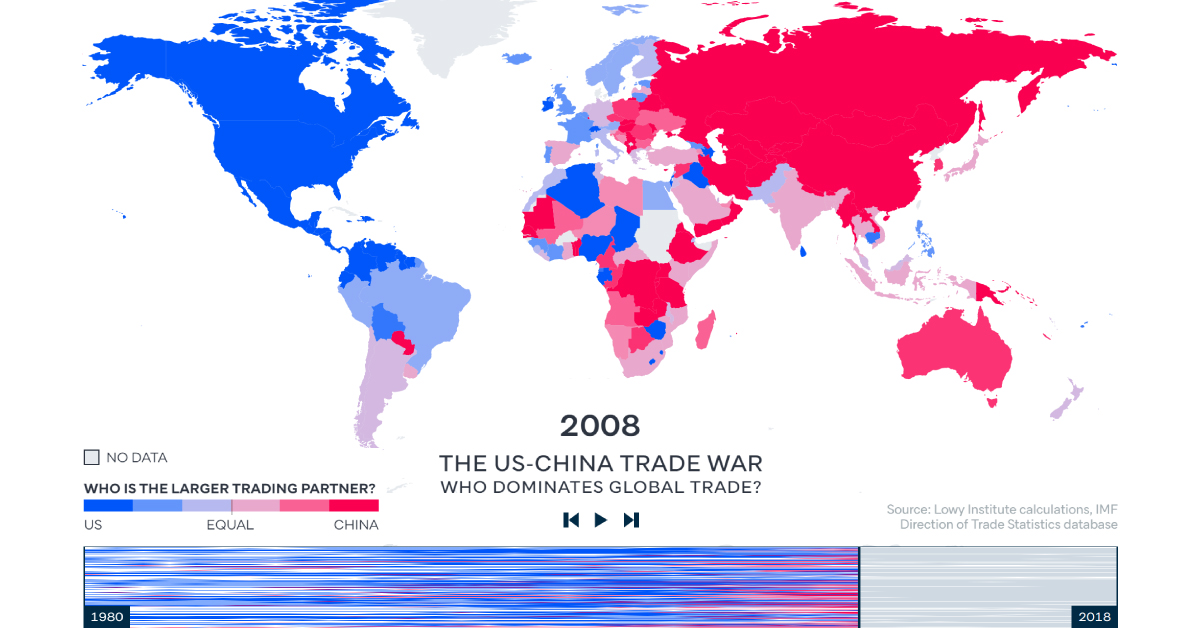
Today’s animation comes from the Lowy Institute, and it pulls data from the International Monetary Fund (IMF) database on bilateral trade flows, to determine whether the U.S. or China is a bigger trading partner for each country from 1980 to 2018.
The results are stark: before 2000, the U.S. was at the helm of global trade, as over 80% of countries traded with the U.S. more than they did with China. By 2018, that number had dropped sharply to just 30%, as China swiftly took top position in 128 of 190 countries.
The researchers pinpoint China’s 2001 entry into the World Trade Organization as a major turning point in China’s international trade relationships. The dramatic shift that followed is clearly demonstrated in the visualization above—between 2005 and 2010, a number of countries tipped towards Chinese influence, especially in Africa and Asia.
Over time, China’s dominance has grown dramatically. It’s no wonder then, that China and the U.S. have a contentious trade relationship themselves, as both nations battle it out for first place.
A Tale of Two Economies
The United States and China are competitors in many ways, but to be successful they must rely on each other for mutually beneficial trade. However, it’s also the major issue on which they are struggling to reach a common ground.
The U.S. has been vocal about negotiating more balanced trade agreements with China. In fact, a mid-2018 poll shows that 62% of Americans consider their trade relationship with China to be unfair.
Since 2018, both parties have faced a fraught relationship, imposing major tariffs on consumer and industrial goods—and retaliations are reaching greater and greater heights:
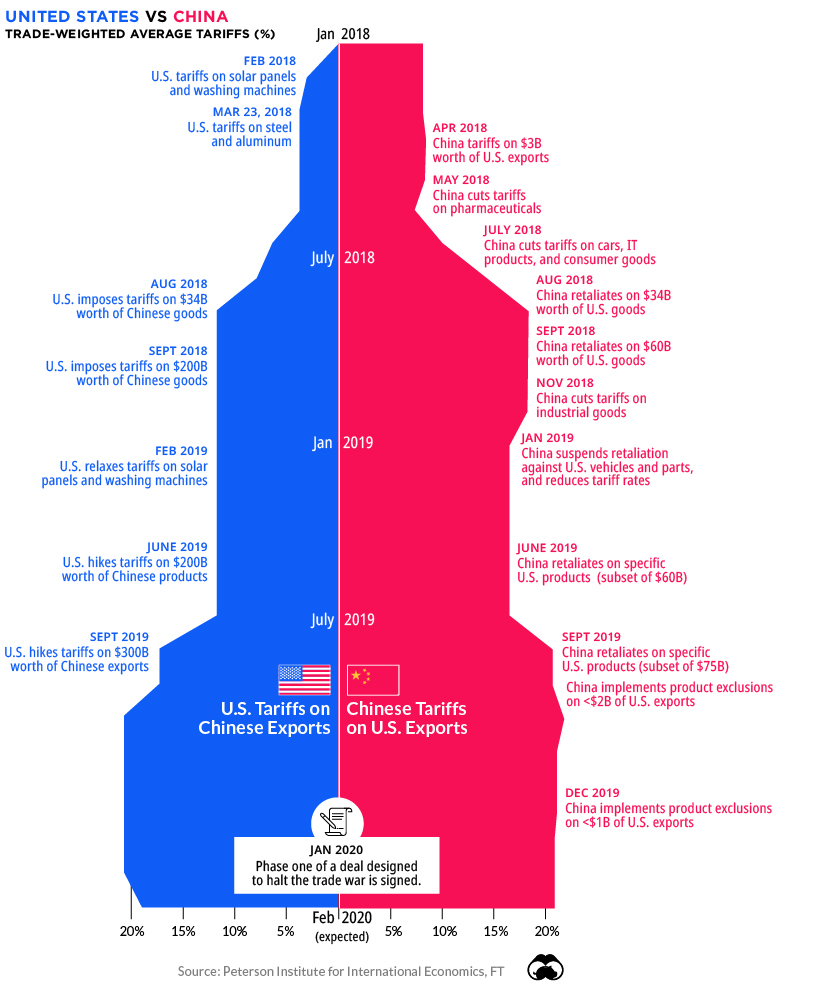
While a delicate truce has been reached at the moment, the trade war has caused a significant drag on global growth, and the World Bank estimates it will continue to have an effect into 2021.
At the same time, China’s sphere of influence continues to grow.
One Belt, One Road, One Trade Direction?
China seems to have a finger in every pie. The nation is financing a flurry of megaprojects across Asia and Africa—but one broader initiative stands above the rest.
China’s “One Belt, One Road” (OBOR) Initiative, planned for a 2049 completion, is advancing at a furious pace. In 2019 alone, Chinese companies signed contracts worth up to $128 billion to start Chinese large-scale infrastructure projects in various countries.
While building new highways and ports abroad is beneficial for Chinese financiers, OBOR is also about creating new markets and trade routes for Chinese goods in Asia. Recent research found that the OBOR program’s infrastructure expansion and logistics performance improvements led to positive effects on China’s exports.
Nevertheless, it’s clear the new infrastructure network is already transforming global trade, possibly cementing China’s position as the world’s major trading partner for years to come.


Markets
The European Stock Market: Attractive Valuations Offer Opportunities
On average, the European stock market has valuations that are nearly 50% lower than U.S. valuations. But how can you access the market?


European Stock Market: Attractive Valuations Offer Opportunities
Europe is known for some established brands, from L’Oréal to Louis Vuitton. However, the European stock market offers additional opportunities that may be lesser known.
The above infographic, sponsored by STOXX, outlines why investors may want to consider European stocks.
Attractive Valuations
Compared to most North American and Asian markets, European stocks offer lower or comparable valuations.
| Index | Price-to-Earnings Ratio | Price-to-Book Ratio |
|---|---|---|
| EURO STOXX 50 | 14.9 | 2.2 |
| STOXX Europe 600 | 14.4 | 2 |
| U.S. | 25.9 | 4.7 |
| Canada | 16.1 | 1.8 |
| Japan | 15.4 | 1.6 |
| Asia Pacific ex. China | 17.1 | 1.8 |
Data as of February 29, 2024. See graphic for full index names. Ratios based on trailing 12 month financials. The price to earnings ratio excludes companies with negative earnings.
On average, European valuations are nearly 50% lower than U.S. valuations, potentially offering an affordable entry point for investors.
Research also shows that lower price ratios have historically led to higher long-term returns.
Market Movements Not Closely Connected
Over the last decade, the European stock market had low-to-moderate correlation with North American and Asian equities.
The below chart shows correlations from February 2014 to February 2024. A value closer to zero indicates low correlation, while a value of one would indicate that two regions are moving in perfect unison.
| EURO STOXX 50 | STOXX EUROPE 600 | U.S. | Canada | Japan | Asia Pacific ex. China |
|
|---|---|---|---|---|---|---|
| EURO STOXX 50 | 1.00 | 0.97 | 0.55 | 0.67 | 0.24 | 0.43 |
| STOXX EUROPE 600 | 1.00 | 0.56 | 0.71 | 0.28 | 0.48 | |
| U.S. | 1.00 | 0.73 | 0.12 | 0.25 | ||
| Canada | 1.00 | 0.22 | 0.40 | |||
| Japan | 1.00 | 0.88 | ||||
| Asia Pacific ex. China | 1.00 |
Data is based on daily USD returns.
European equities had relatively independent market movements from North American and Asian markets. One contributing factor could be the differing sector weights in each market. For instance, technology makes up a quarter of the U.S. market, but health care and industrials dominate the broader European market.
Ultimately, European equities can enhance portfolio diversification and have the potential to mitigate risk for investors.
Tracking the Market
For investors interested in European equities, STOXX offers a variety of flagship indices:
| Index | Description | Market Cap |
|---|---|---|
| STOXX Europe 600 | Pan-regional, broad market | €10.5T |
| STOXX Developed Europe | Pan-regional, broad-market | €9.9T |
| STOXX Europe 600 ESG-X | Pan-regional, broad market, sustainability focus | €9.7T |
| STOXX Europe 50 | Pan-regional, blue-chip | €5.1T |
| EURO STOXX 50 | Eurozone, blue-chip | €3.5T |
Data is as of February 29, 2024. Market cap is free float, which represents the shares that are readily available for public trading on stock exchanges.
The EURO STOXX 50 tracks the Eurozone’s biggest and most traded companies. It also underlies one of the world’s largest ranges of ETFs and mutual funds. As of November 2023, there were €27.3 billion in ETFs and €23.5B in mutual fund assets under management tracking the index.
“For the past 25 years, the EURO STOXX 50 has served as an accurate, reliable and tradable representation of the Eurozone equity market.”
— Axel Lomholt, General Manager at STOXX
Partnering with STOXX to Track the European Stock Market
Are you interested in European equities? STOXX can be a valuable partner:
- Comprehensive, liquid and investable ecosystem
- European heritage, global reach
- Highly sophisticated customization capabilities
- Open architecture approach to using data
- Close partnerships with clients
- Part of ISS STOXX and Deutsche Börse Group
With a full suite of indices, STOXX can help you benchmark against the European stock market.
Learn how STOXX’s European indices offer liquid and effective market access.

-

 Economy2 days ago
Economic Growth Forecasts for G7 and BRICS Countries in 2024
The IMF has released its economic growth forecasts for 2024. How do the G7 and BRICS countries compare?
-

 Markets1 week ago
U.S. Debt Interest Payments Reach $1 Trillion
U.S. debt interest payments have surged past the $1 trillion dollar mark, amid high interest rates and an ever-expanding debt burden.
-

 United States2 weeks ago
Ranked: The Largest U.S. Corporations by Number of Employees
We visualized the top U.S. companies by employees, revealing the massive scale of retailers like Walmart, Target, and Home Depot.
-

 Markets2 weeks ago
The Top 10 States by Real GDP Growth in 2023
This graphic shows the states with the highest real GDP growth rate in 2023, largely propelled by the oil and gas boom.
-

 Markets2 weeks ago
Ranked: The World’s Top Flight Routes, by Revenue
In this graphic, we show the highest earning flight routes globally as air travel continued to rebound in 2023.
-

 Markets2 weeks ago
Ranked: The Most Valuable Housing Markets in America
The U.S. residential real estate market is worth a staggering $47.5 trillion. Here are the most valuable housing markets in the country.


-

 Energy1 week ago
The World’s Biggest Nuclear Energy Producers
-

 Money2 weeks ago
Which States Have the Highest Minimum Wage in America?
-

 Technology2 weeks ago
Ranked: Semiconductor Companies by Industry Revenue Share
-
Markets2 weeks ago
Ranked: The World’s Top Flight Routes, by Revenue
-

 Countries2 weeks ago
Population Projections: The World’s 6 Largest Countries in 2075
-
Markets2 weeks ago
The Top 10 States by Real GDP Growth in 2023
-

 Demographics2 weeks ago
The Smallest Gender Wage Gaps in OECD Countries
-

 United States2 weeks ago
Where U.S. Inflation Hit the Hardest in March 2024