Markets
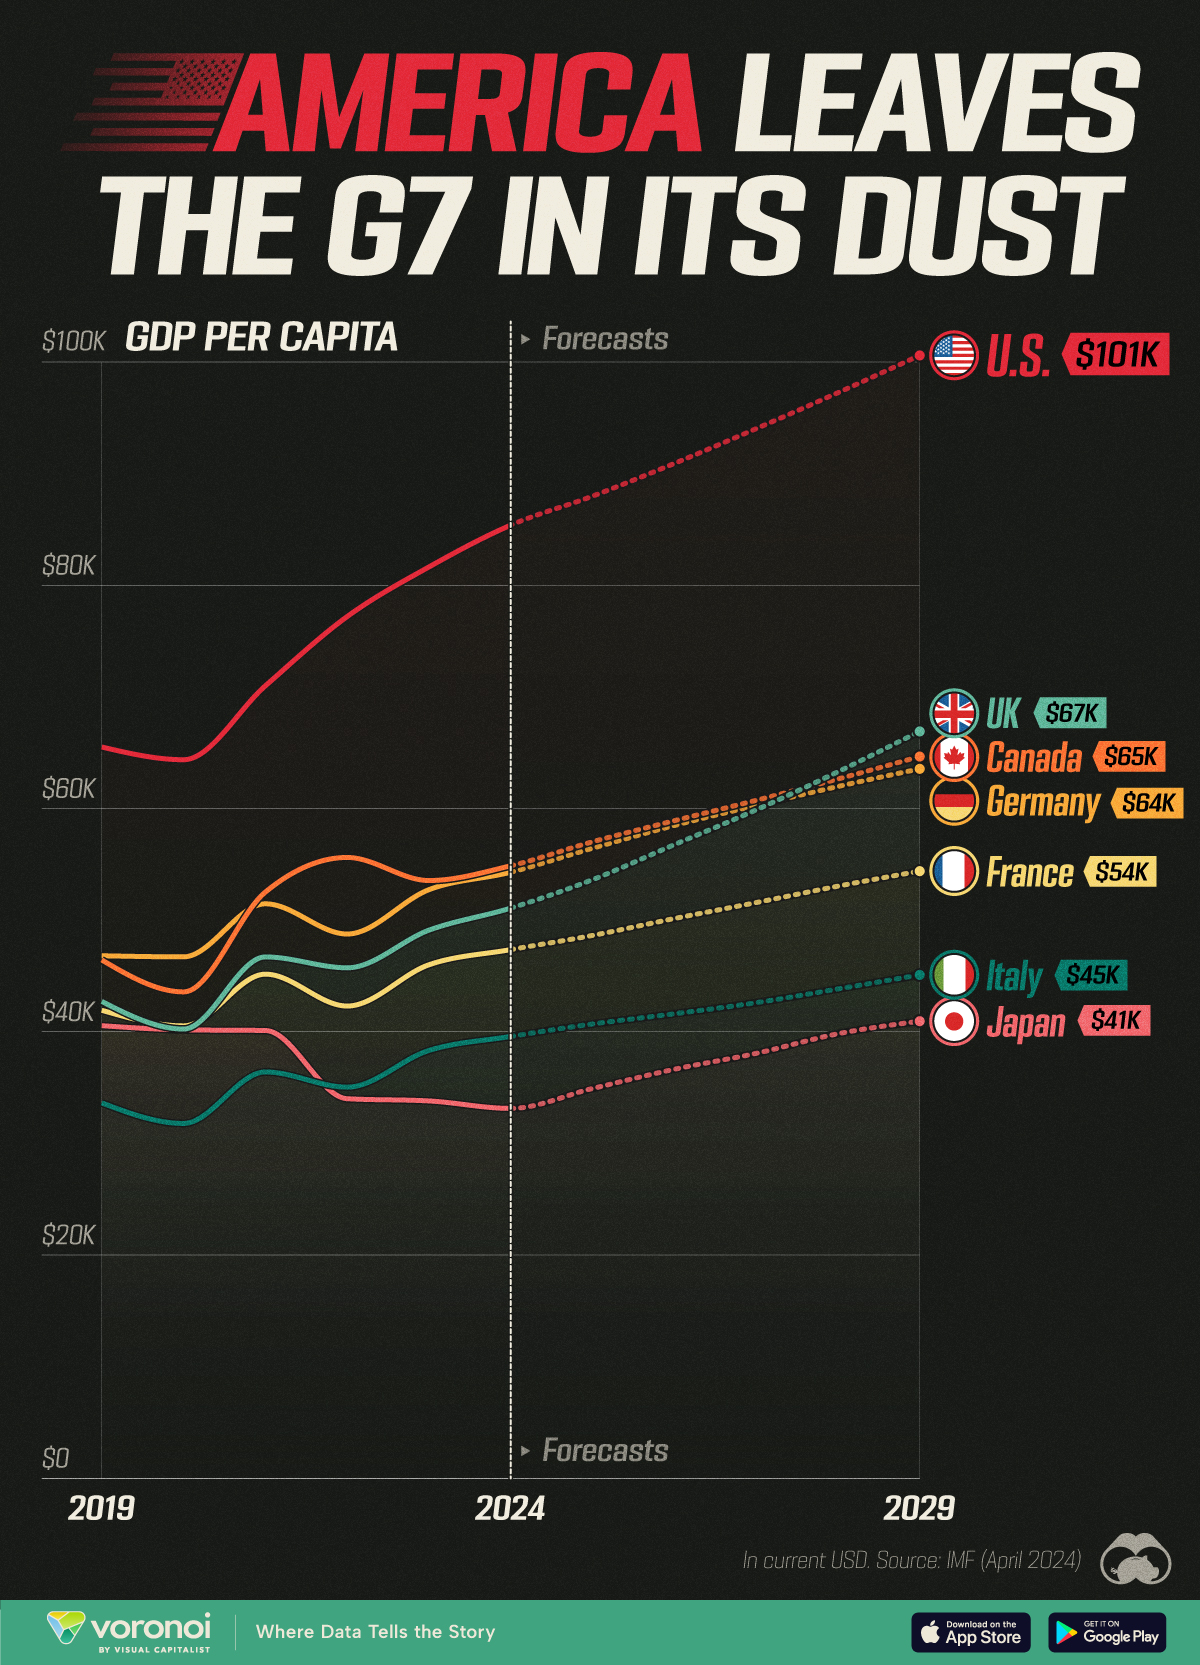
GDP Per Capita, by G7 Country (2019-2029F)
![]() See this visualization first on the Voronoi app.
See this visualization first on the Voronoi app.
GDP Per Capita Projections for the G7
This was originally posted on our Voronoi app. Download the app for free on iOS or Android and discover incredible data-driven charts from a variety of trusted sources.
GDP per capita takes the total economic output of a country in a year, and divides it by the total population, providing a measure of a country’s economic performance and living standards on a per person basis.
In this graphic, we’ve visualized GDP per capita for G7 nations, from 2019 to 2029 (forecasted). All figures come from the International Monetary Fund (IMF), and are as of April 2024.
Data and Key Takeaways
The data we used to create this graphic can also be found in the table below.
| GDP per capita (current USD) | Canada 🇨🇦 | France 🇫🇷 | Germany 🇩🇪 | Italy 🇮🇹 | Japan 🇯🇵 | UK 🇬🇧 | U.S. 🇺🇸 |
|---|---|---|---|---|---|---|---|
| 2019 | $46,431 | $41,925 | $46,810 | $33,628 | $40,548 | $42,713 | $65,505 |
| 2020 | $43,573 | $40,529 | $46,712 | $31,789 | $40,172 | $40,246 | $64,367 |
| 2021 | $52,521 | $45,161 | $51,461 | $36,402 | $40,114 | $46,704 | $70,996 |
| 2022 | $55,613 | $42,306 | $48,756 | $35,043 | $34,005 | $45,730 | $77,192 |
| 2023 | $53,548 | $46,001 | $52,727 | $38,326 | $33,806 | $49,099 | $81,632 |
| 2024F | $54,866 | $47,359 | $54,291 | $39,580 | $33,138 | $51,075 | $85,373 |
| 2025F | $57,021 | $48,631 | $56,439 | $40,701 | $34,922 | $53,627 | $87,978 |
| 2026F | $58,907 | $50,143 | $58,472 | $41,612 | $36,643 | $56,759 | $90,903 |
| 2027F | $60,729 | $51,571 | $60,264 | $42,604 | $38,065 | $59,870 | $94,012 |
| 2028F | $62,636 | $53,040 | $61,965 | $43,835 | $39,820 | $63,279 | $97,231 |
| 2029F | $64,653 | $54,388 | $63,551 | $45,096 | $40,949 | $66,911 | $100,580 |
From this data, we can see that the U.S. has managed a very strong post-COVID recovery relative to its G7 peers. While Canada also saw a strong resurgence in 2021 and 2022, its GDP per capita actually fell in 2023.
This is attributed to the country’s high levels of immigration in 2023, which helped boost population by 3.2% (1,271,000 people). Because this increase outpaced economic growth, Canada’s per capita output decreased.
Looking towards the future, the IMF believes that the U.S. will reach a GDP per capita of $101,000 by 2029, which is significantly higher than any other G7 nation. It also believes that the UK will perform well in the second half of this decade, climbing from fourth to second place among this peer group of countries.
Learn More About GDP from Visual Capitalist
If you enjoyed this post, be sure to check out Ranked: The Top 6 Economies by Share of Global GDP (1980-2024).


Markets
The Stocks Driving S&P 500 Returns in 2024
We show the top 10 S&P 500 stocks that are fueling the market’s rally as the index hovers near record-highs.

The Stocks Driving S&P 500 Returns in 2024
This was originally posted on our Voronoi app. Download the app for free on iOS or Android and discover incredible data-driven charts from a variety of trusted sources.
The S&P 500 is sitting at near-record highs, returning 15% year-to-date as of June 26, 2024.
Today, a limited number of stocks are powering the stock market’s rally as investors pour money into companies that are advancing AI technologies. As share prices skyrocket, many wonder if company valuations are overheated—or if they are supported by strong corporate fundamentals.
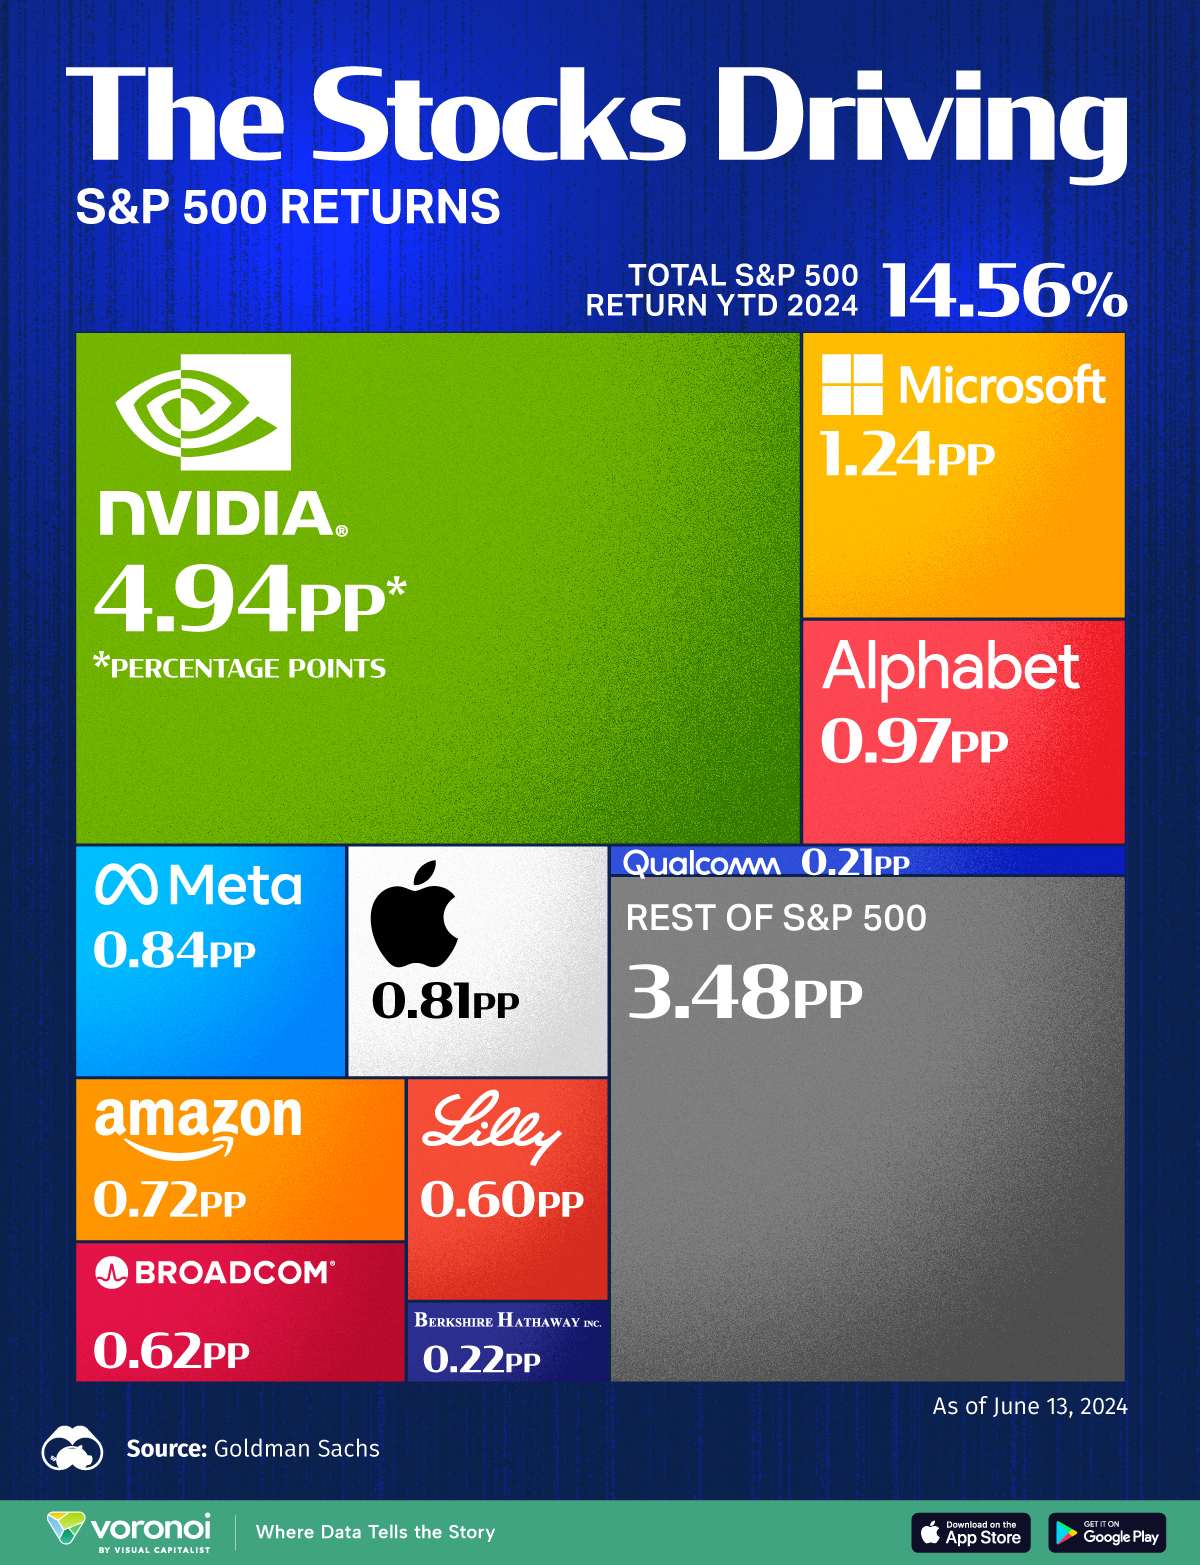
This graphic shows the top 10 S&P 500 stocks driving stock market returns in 2024, based on data from Goldman Sachs.
Big Tech Stocks Are Fueling Gains
Below, we show the companies making the largest contribution to the S&P 500’s rally:
| Rank | Company | Ticker | Contribution to S&P 500 Return YTD as of June 13, 2024 |
|---|---|---|---|
| 1 | Nvidia | NVDA | 4.94% |
| 2 | Microsoft | MSFT | 1.24% |
| 3 | Alphabet | GOOGL | 0.97% |
| 4 | Meta | META | 0.84% |
| 5 | Apple | AAPL | 0.81% |
| 6 | Amazon | AMZN | 0.72% |
| 7 | Broadcom | AVGO | 0.62% |
| 8 | Eli Lilly & Co. | LLY | 0.60% |
| 9 | Berkshire Hathaway | BRK.B | 0.22% |
| 10 | QUALCOMM | QCOM | 0.21% |
| Total S&P 500 Return YTD 2024 | 14.65% |
As of June 13, 2024.
Chipmaker Nvidia has driven over a third of S&P 500 returns this year, with its share price soaring 162% year-to-date as of June 13, 2024.
In June, Nvidia became the world’s most valuable firm, commanding an estimated 70% to 95% of the AI chip market. In the latest quarter, revenue surged by threefold compared to a year earlier amid high chip demand. Overall, big tech companies such as Meta, Amazon, and Microsoft made up roughly 45% of its data-center revenue, with Meta running a staggering 350,000 H100 chips to power its AI systems this year alone.
Falling in second is Microsoft, which has invested billions in AI startups including OpenAI and Wayve, a self-driving car firm. Microsoft is a cloud service provider for ChatGPT, the large language model built by OpenAI. As AI demand exceeds capacity, and other business segments see solid growth, Microsoft’s revenue increased 17% year-over-year as of the second quarter of 2024.
Google’s parent, Alphabet, ranks next, followed by Meta and Apple. Each of these companies is working on their own large language model which costs millions to train and run. Together, the top five stocks are driving about 60% of the S&P 500’s returns.
As we can see, just two of the top 10 S&P 500 stocks are not big tech names: pharmaceutical giant Eli Lilly and Berkshire Hathaway. This year, Eli Lilly’s share price is surging due to strong demand for its weight loss drug, Zepbound. During the first quarter of 2024, the newly-approved drug generated over $517 million in sales. Given its reported effectiveness, some analysts are forecasting it could be the best-selling drug ever in American history.

-

 Millennials2 weeks ago
Visualizing the Wealth of Americans Under 40 (1989-2023)
-
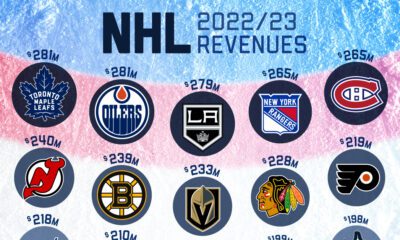
 Markets1 week ago
Ranked: Which NHL Team Takes Home the Most Revenue?
-

 Maps1 week ago
Mapped: Highest and Lowest Doctor Density Around the World
-

 Money1 week ago
Ranked: The World’s Top 10 Billionaires in 2024
-

 Stocks1 week ago
All of the World’s Trillion-Dollar Companies in One Chart
-
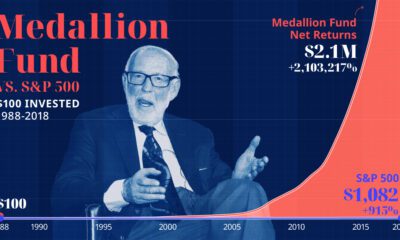
 Markets1 week ago
The Growth of $100 Invested in Jim Simons’ Medallion Fund
-

 Stocks1 week ago
Charted: Four Decades of U.S. Tech IPOs
-

 Retail1 week ago
Ranked: The 20 Top Retailers Worldwide, by Revenue