Chart of the Week
Chart: Which Universities Have the Richest Graduates?
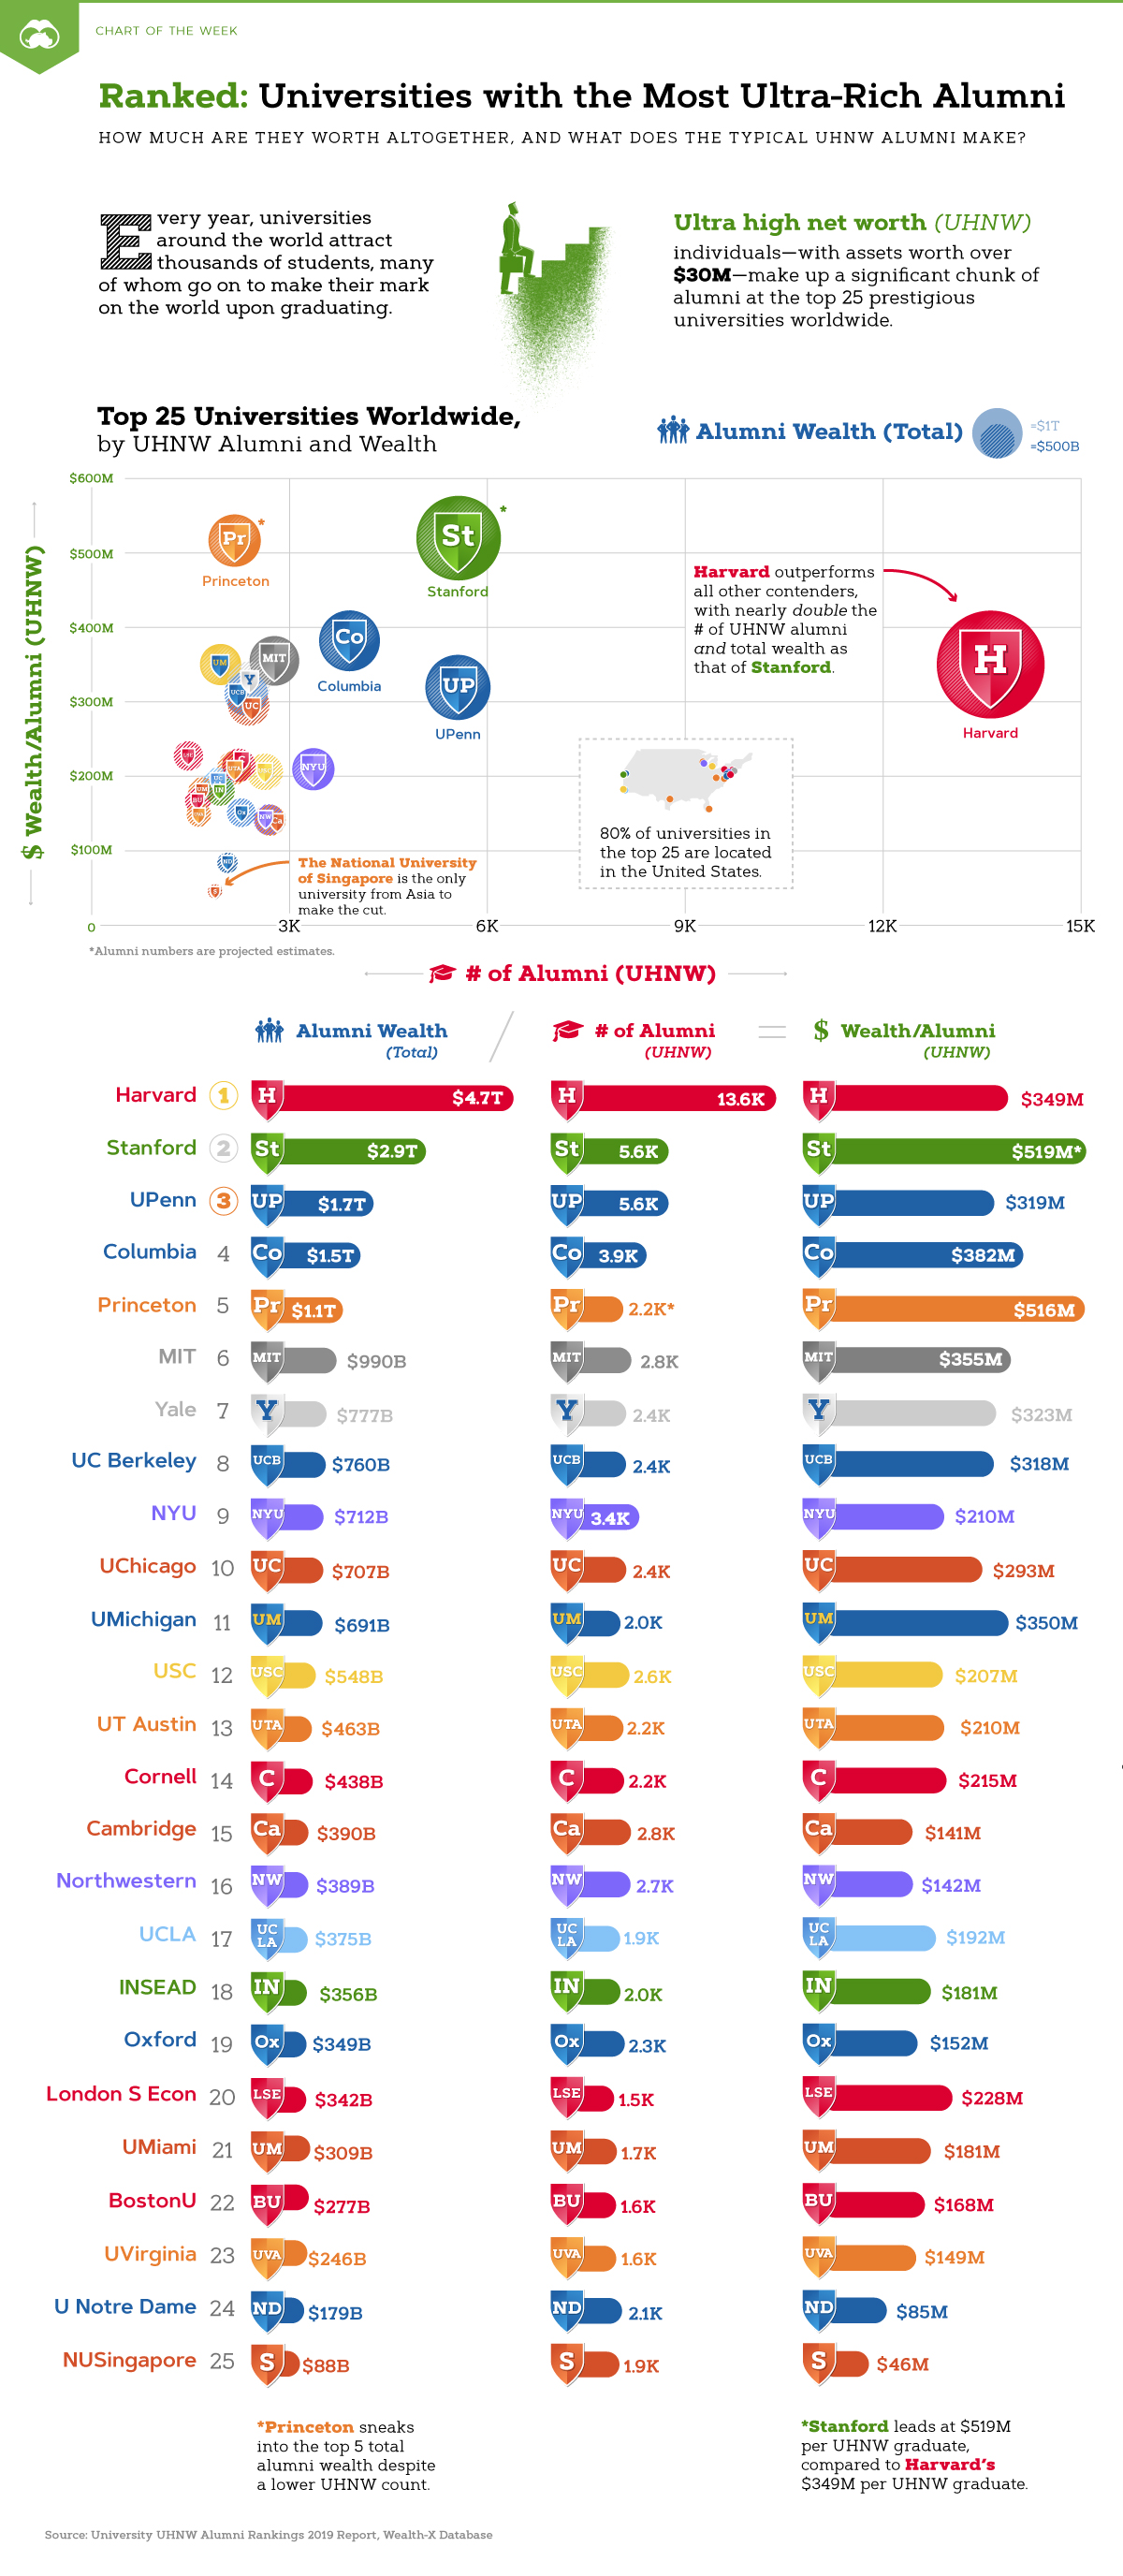
Chart: Which Universities Have the Richest Graduates?
Higher education is often considered the first rung in the ladder of success.
That’s why thousands of students flock to top-tier universities around the world, hoping to translate their degrees into financial outcomes. After all, a degree from specific institutions can often mean that a wealthy and secure future is in the books.
With a new fall term just around the corner, today’s chart relies on the third annual Wealth-X report ranking of global universities with the most ultra-high net worth (UHNW) alumni. We’ve also tracked their combined wealth, and how much each UHNW alumni makes on average.
Analyzing UHNW Riches
The Wealth-X database defines ultra-high net worth alumni as those who own at least $30 million in assets. In addition, the alumni figures are based on the actual known UHNW individuals from each university, then projected based on the sample size to predict total alumni within the global UHNW population.
One caveat to note is that both bachelor’s and master’s degree-holders have been considered, while UHNW individuals who may have attended more than one university have been counted twice. With that in mind, let’s dive in.
Upholding a Stellar Reputation
It’s immediately noticeable that a majority of universities on the list are located in the United States, with a high concentration on the East Coast—including the elite Ivy League.
Established in 1636, Harvard dwarfs all its Ivy League counterparts for the richest graduates. Its 13,650 UHNW alumni is double that of second-place Stanford (5,580 UHNW alumni), with twice the total wealth to boot.
One way that Harvard falls short is when average UHNW alumni wealth is considered in this chart, with Stanford beating it by a difference of $170 million per graduate. Regardless, it’s clear Harvard graduates go on to have a significant impact on the world. Notable alumni include political leaders such as former U.S. President Barack Obama, and billionaires such as Michael Bloomberg.
Interestingly, Princeton climbs the charts for total alumni wealth ($1.1 trillion), despite a lower UHNW alumni count of just over 2,000—but this also puts its wealth per graduate at a high of $516 million. Notable alumni from Princeton include Jeff Bezos and Steve Forbes. Meanwhile, Brown and Dartmouth are the only Ivy universities that don’t make the list at all.
Excellence Outside the U.S.
Zooming out, private universities dominate most of this list of richest graduates. In the United Kingdom, Cambridge, Oxford, and the London School of Economics and Political Science (LSE) have over 6,500 UHNW alumni combined. This represents a total of $1.08 trillion in wealth, an average of $174 million per UHNW grad.
Notable alumni and achievements from these institutions include:
- Cambridge: Isaac Newton, Charles Darwin, Stephen Hawking
- Oxford: 69 Nobel prize winners, Stephen Hawking, JRR Tolkien
- LSE: 18 Nobel prize winners, including political leaders
*LSE’s label has been misrepresented in the original report as #26 instead of the actual #25.
Nearby in France, the graduate business school Institut Européen d’Administration des Affaires (INSEAD) has a total of 1,956 UHNW alumni and $356 billion in combined wealth—contributed by CEOs of companies like Credit Suisse, Royal Dutch Shell, Ericsson, and Lego.
It’s impressive that the National University of Singapore (NUS) enters the list, with 1,890 UHNW alumni and an average of $46.6 million to their name. Graduates from NUS have gone on to become Singaporean prime ministers and presidents, as well as high-ranking officials in the WHO and UN Security Council.
Here are the full statistics for the top 25 universities worldwide—does yours make the cut?
| Rank | University | Total Wealth | UHNW Alumni | Wealth per UHNW Graduate |
|---|---|---|---|---|
| 1 | 🇺🇸 Harvard University | $4.7T | 13,650 | $349M |
| 2 | 🇺🇸 Stanford University | $2.9T | 5,580 | $519M |
| 3 | 🇺🇸 University of Pennsylvania | $1.8T | 5,575 | $319M |
| 4 | 🇺🇸 Columbia University | $1.5T | 3,925 | $382M |
| 5 | 🇺🇸 Princeton University | $1.1T | 2,180 | $516M |
| 6 | 🇺🇸 Massachusetts Institute of Technology | $990B | 2,785 | $355M |
| 7 | 🇺🇸 Yale University | $777B | 2,400 | $323M |
| 8 | 🇺🇸 University of California Berkeley | $760B | 2,385 | $318M |
| 9 | 🇺🇸 New York University | $712B | 3,380 | $210M |
| 10 | 🇺🇸 The University of Chicago | $707B | 2,405 | $293M |
| 11 | 🇺🇸 The University of Michigan | $691B | 1,970 | $350M |
| 12 | 🇺🇸 The University of Southern California | $548B | 2,645 | $207M |
| 13 | 🇺🇸 Cornell University | $483B | 2,245 | $215M |
| 14 | 🇺🇸 The University of Texas at Austin | $463B | 2,195 | $210M |
| 15 | 🇬🇧 University of Cambridge | $390B | 2,760 | $141M |
| 16 | 🇺🇸 Northwestern University | $389B | 2,725 | $142M |
| 17 | 🇺🇸 The University of California Los Angeles | $375B | 1,945 | $192M |
| 18 | 🇫🇷 Institut Européen d'Administration des Affaires | $356B | 1,965 | $181M |
| 19 | 🇬🇧 University of Oxford | $349B | 2,290 | $152M |
| 20 | 🇬🇧 London School of Economics and Political Science | $342B | 1,495 | $228M |
| 21 | 🇺🇸 University of Miami | $309B | 1,700 | $181M |
| 22 | 🇺🇸 Boston University | $277B | 1,640 | $168M |
| 23 | 🇺🇸 University of Virginia | $246B | 1,650 | $149M |
| 24 | 🇺🇸 The University of Notre Dame | $179B | 2,085 | $85M |
| 25 | 🇸🇬 National University of Singapore | $88B | 1,890 | $46M |
Where’s the Money, Really?
According to the report, a majority of UHNW alumni from these universities are “self-made” millionaires, who became successful through their own efforts rather than relying on family fortune or social status.
Of course, the name of a university is one step to climb on the ladder. What’s often glossed over is how steep the tuition fees at private institutions are, which can rack up significant student debt over time.
Graduates from Boston University, Columbia University, and Northwestern University relied the most on inheritance for their wealth, between 10-12%. A combination of both self-made and inherited wealth sources are also common for UHNW alumni—and it’s not a stretch to say that it helped them pay off debts before focusing on their wealth creation.
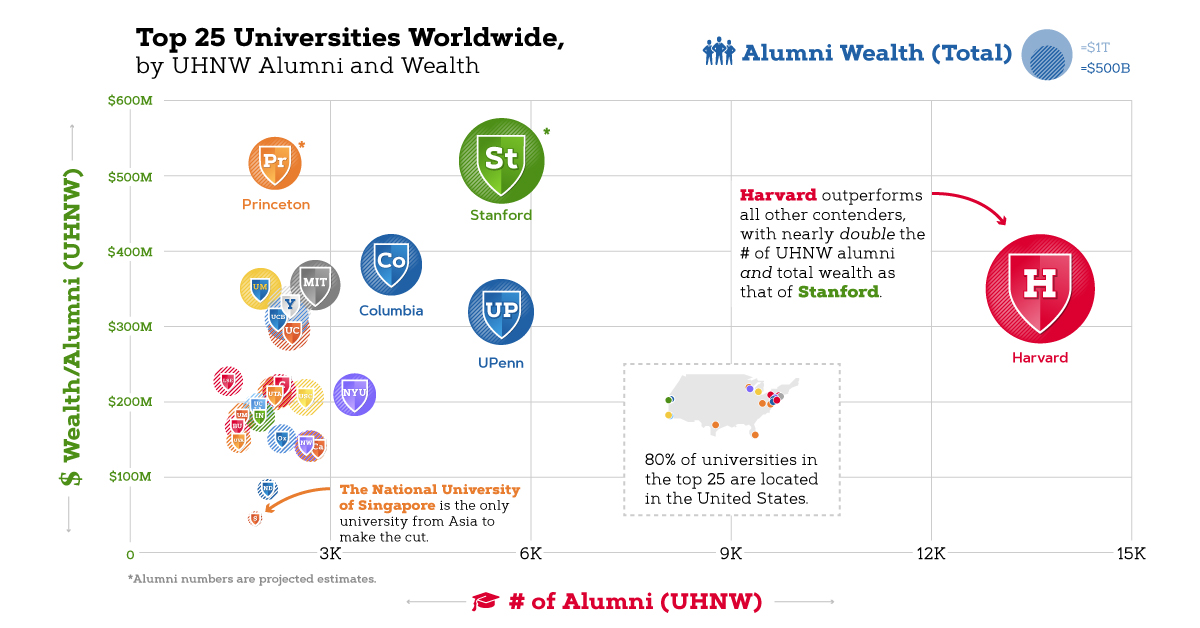


Chart of the Week
The Road to Recovery: Which Economies are Reopening?
We look at mobility rates as well as COVID-19 recovery rates for 41 economies, to see which countries are reopening for business.

The Road to Recovery: Which Economies are Reopening?
COVID-19 has brought the world to a halt—but after months of uncertainty, it seems that the situation is slowly taking a turn for the better.
Today’s chart measures the extent to which 41 major economies are reopening, by plotting two metrics for each country: the mobility rate and the COVID-19 recovery rate:
- Mobility Index
This refers to the change in activity around workplaces, subtracting activity around residences, measured as a percentage deviation from the baseline. - COVID-19 Recovery Rate
The number of recovered cases in a country is measured as the percentage of total cases.
Data for the first measure comes from Google’s COVID-19 Community Mobility Reports, which relies on aggregated, anonymous location history data from individuals. Note that China does not show up in the graphic as the government bans Google services.
COVID-19 recovery rates rely on values from CoronaTracker, using aggregated information from multiple global and governmental databases such as WHO and CDC.
Reopening Economies, One Step at a Time
In general, the higher the mobility rate, the more economic activity this signifies. In most cases, mobility rate also correlates with a higher rate of recovered people in the population.
Here’s how these countries fare based on the above metrics.
| Country | Mobility Rate | Recovery Rate | Total Cases | Total Recovered |
|---|---|---|---|---|
| Argentina | -56% | 31.40% | 14,702 | 4,617 |
| Australia | -41% | 92.03% | 7,150 | 6,580 |
| Austria | -100% | 91.93% | 16,628 | 15,286 |
| Belgium | -105% | 26.92% | 57,849 | 15,572 |
| Brazil | -48% | 44.02% | 438,812 | 193,181 |
| Canada | -67% | 52.91% | 88,512 | 46,831 |
| Chile | -110% | 41.58% | 86,943 | 36,150 |
| Colombia | -73% | 26.28% | 25,366 | 6,665 |
| Czechia | -29% | 70.68% | 9,140 | 6,460 |
| Denmark | -93% | 88.43% | 11,512 | 10,180 |
| Finland | -93% | 81.57% | 6,743 | 5,500 |
| France | -100% | 36.08% | 186,238 | 67,191 |
| Germany | -99% | 89.45% | 182,452 | 163,200 |
| Greece | -32% | 47.28% | 2,906 | 1,374 |
| Hong Kong | -10% | 97.00% | 1,067 | 1,035 |
| Hungary | -49% | 52.31% | 3,816 | 1,996 |
| India | -65% | 42.88% | 165,386 | 70,920 |
| Indonesia | -77% | 25.43% | 24,538 | 6,240 |
| Ireland | -79% | 88.92% | 24,841 | 22,089 |
| Israel | -31% | 87.00% | 16,872 | 14,679 |
| Italy | -52% | 64.99% | 231,732 | 150,604 |
| Japan | -33% | 84.80% | 16,683 | 14,147 |
| Malaysia | -53% | 80.86% | 7,629 | 6,169 |
| Mexico | -69% | 69.70% | 78,023 | 54,383 |
| Netherlands | -97% | 0.01% | 45,950 | 3 |
| New Zealand | -21% | 98.01% | 1,504 | 1,474 |
| Norway | -100% | 91.87% | 8,411 | 7,727 |
| Philippines | -87% | 23.08% | 15,588 | 3,598 |
| Poland | -36% | 46.27% | 22,825 | 10,560 |
| Portugal | -65% | 58.99% | 31,596 | 18,637 |
| Singapore | -105% | 55.02% | 33,249 | 18,294 |
| South Africa | -74% | 52.44% | 27,403 | 14,370 |
| South Korea | -4% | 91.15% | 11,344 | 10,340 |
| Spain | -67% | 69.11% | 284,986 | 196,958 |
| Sweden | -93% | 13.91% | 35,727 | 4,971 |
| Switzerland | -101% | 91.90% | 30,796 | 28,300 |
| Taiwan | 4% | 95.24% | 441 | 420 |
| Thailand | -36% | 96.08% | 3,065 | 2,945 |
| U.S. | -56% | 28.20% | 1,768,346 | 498,720 |
| United Kingdom | -82% | 0.05% | 269,127 | 135 |
| Vietnam | 15% | 85.02% | 327 | 278 |
Mobility data as of May 21, 2020 (Latest available). COVID-19 case data as of May 29, 2020.
In the main scatterplot visualization, we’ve taken things a step further, assigning these countries into four distinct quadrants:
1. High Mobility, High Recovery
High recovery rates are resulting in lifted restrictions for countries in this quadrant, and people are steadily returning to work.
New Zealand has earned praise for its early and effective pandemic response, allowing it to curtail the total number of cases. This has resulted in a 98% recovery rate, the highest of all countries. After almost 50 days of lockdown, the government is recommending a flexible four-day work week to boost the economy back up.
2. High Mobility, Low Recovery
Despite low COVID-19 related recoveries, mobility rates of countries in this quadrant remain higher than average. Some countries have loosened lockdown measures, while others did not have strict measures in place to begin with.
Brazil is an interesting case study to consider here. After deferring lockdown decisions to state and local levels, the country is now averaging the highest number of daily cases out of any country. On May 28th, for example, the country had 24,151 new cases and 1,067 new deaths.
3. Low Mobility, High Recovery
Countries in this quadrant are playing it safe, and holding off on reopening their economies until the population has fully recovered.
Italy, the once-epicenter for the crisis in Europe is understandably wary of cases rising back up to critical levels. As a result, it has opted to keep its activity to a minimum to try and boost the 65% recovery rate, even as it slowly emerges from over 10 weeks of lockdown.
4. Low Mobility, Low Recovery
Last but not least, people in these countries are cautiously remaining indoors as their governments continue to work on crisis response.
With a low 0.05% recovery rate, the United Kingdom has no immediate plans to reopen. A two-week lag time in reporting discharged patients from NHS services may also be contributing to this low number. Although new cases are leveling off, the country has the highest coronavirus-caused death toll across Europe.
The U.S. also sits in this quadrant with over 1.7 million cases and counting. Recently, some states have opted to ease restrictions on social and business activity, which could potentially result in case numbers climbing back up.
Over in Sweden, a controversial herd immunity strategy meant that the country continued business as usual amid the rest of Europe’s heightened regulations. Sweden’s COVID-19 recovery rate sits at only 13.9%, and the country’s -93% mobility rate implies that people have been taking their own precautions.
COVID-19’s Impact on the Future
It’s important to note that a “second wave” of new cases could upend plans to reopen economies. As countries reckon with these competing risks of health and economic activity, there is no clear answer around the right path to take.
COVID-19 is a catalyst for an entirely different future, but interestingly, it’s one that has been in the works for a while.
Without being melodramatic, COVID-19 is like the last nail in the coffin of globalization…The 2008-2009 crisis gave globalization a big hit, as did Brexit, as did the U.S.-China trade war, but COVID is taking it to a new level.
—Carmen Reinhart, incoming Chief Economist for the World Bank
Will there be any chance of returning to “normal” as we know it?

-

 Real Estate2 weeks ago
Visualizing America’s Shortage of Affordable Homes
-

 Technology1 week ago
Ranked: Semiconductor Companies by Industry Revenue Share
-

 Money1 week ago
Which States Have the Highest Minimum Wage in America?
-

 Real Estate1 week ago
Ranked: The Most Valuable Housing Markets in America
-

 Business2 weeks ago
Charted: Big Four Market Share by S&P 500 Audits
-

 AI2 weeks ago
The Stock Performance of U.S. Chipmakers So Far in 2024
-

 Misc2 weeks ago
Almost Every EV Stock is Down After Q1 2024
-

 Money2 weeks ago
Where Does One U.S. Tax Dollar Go?