Energy
Breaking Down the Cost of an EV Battery Cell
![]() Subscribe to the Elements free mailing list for more like this
Subscribe to the Elements free mailing list for more like this


Breaking Down the Cost of an EV Battery Cell
This was originally posted on Elements. Sign up to the free mailing list to get beautiful visualizations on natural resource megatrends in your email every week.
As electric vehicle (EV) battery prices keep dropping, the global supply of EVs and demand for their batteries are ramping up.
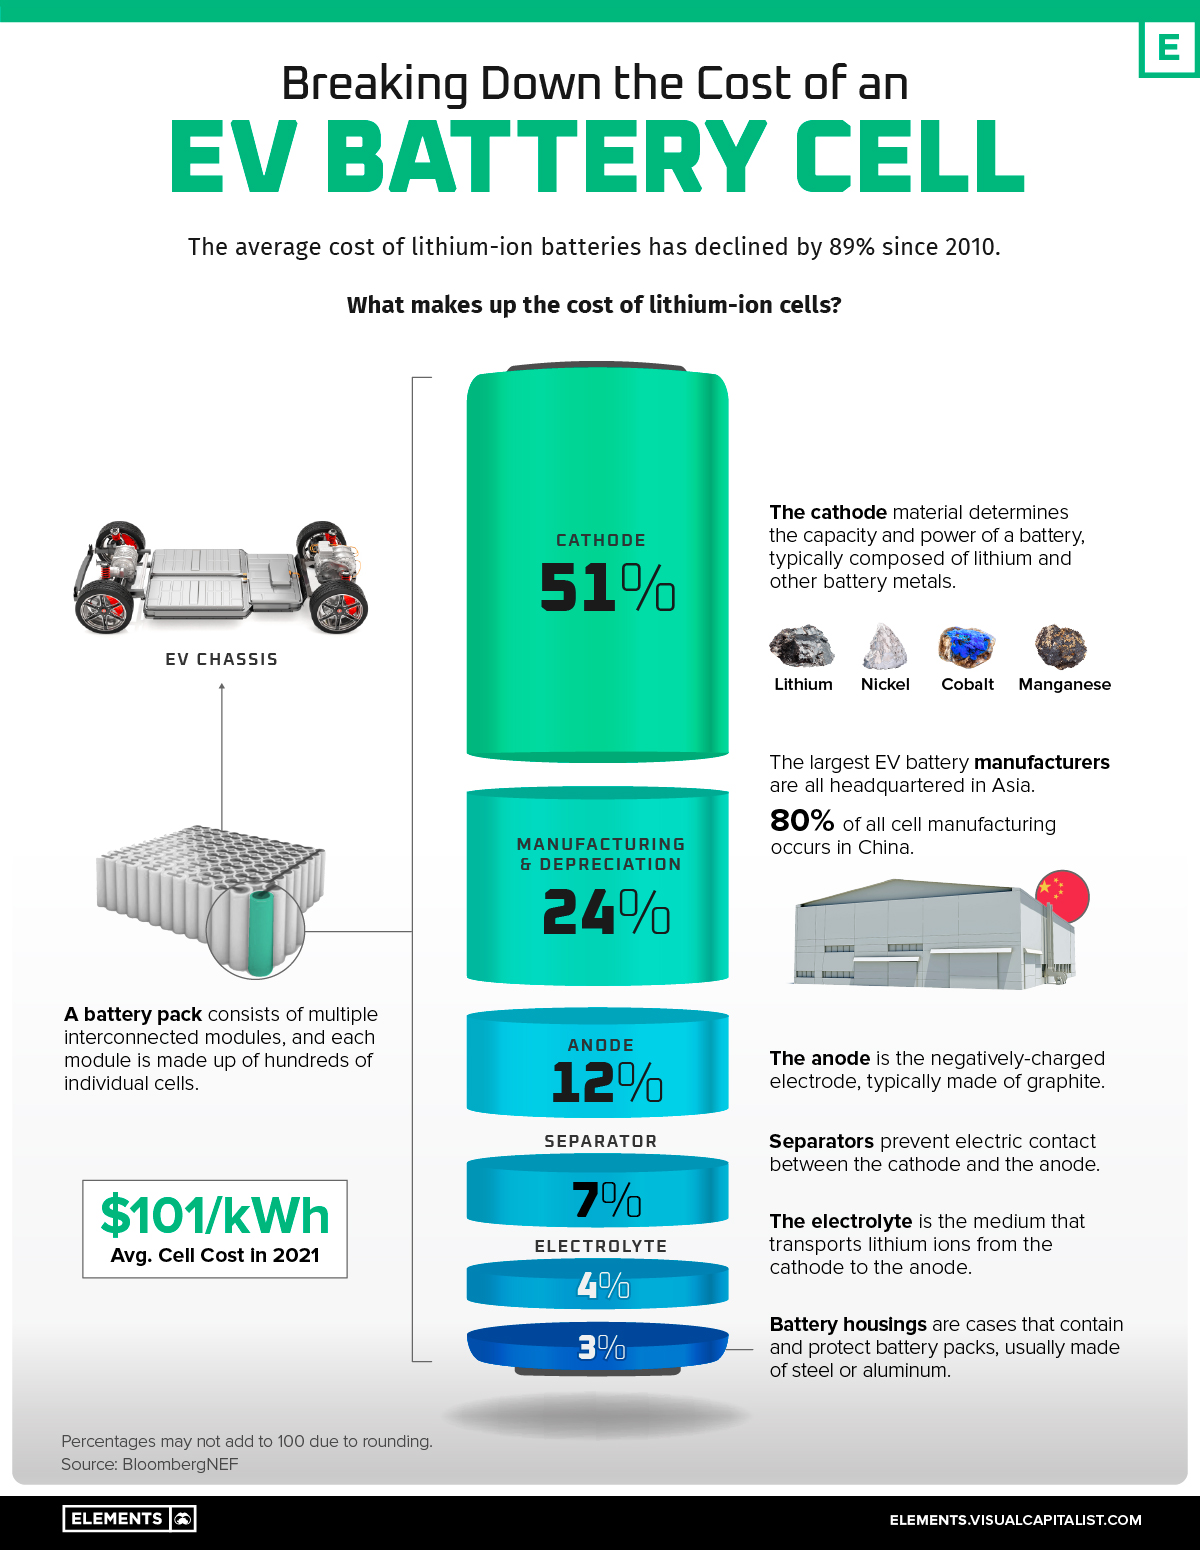
Since 2010, the average price of a lithium-ion (Li-ion) EV battery pack has fallen from $1,200 per kilowatt-hour (kWh) to just $132/kWh in 2021.
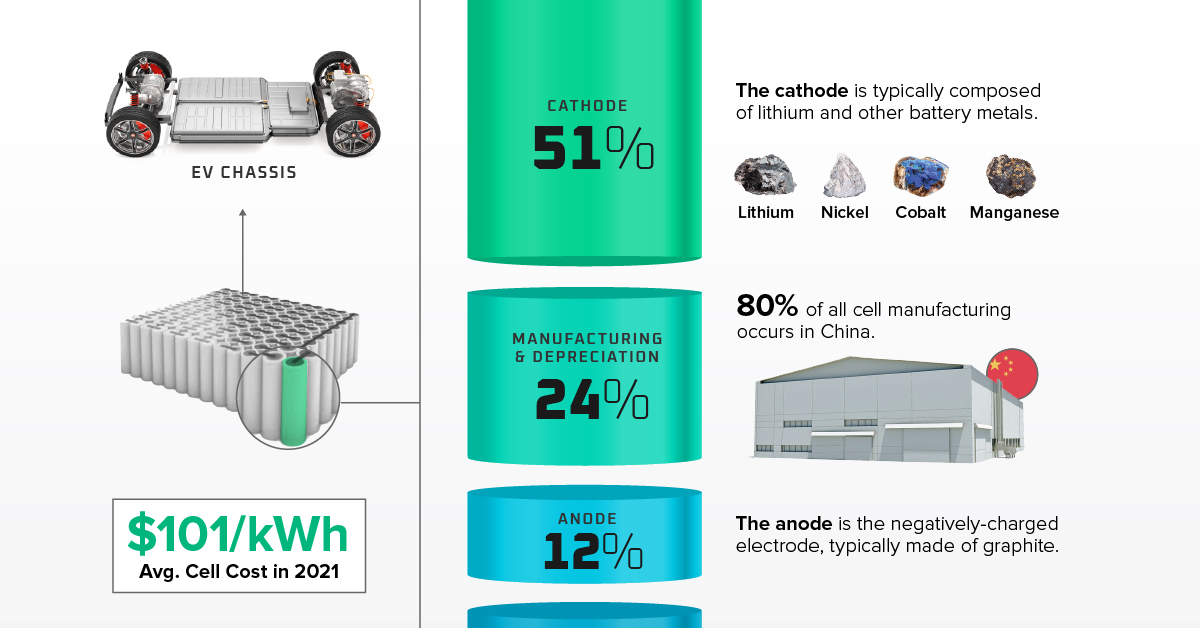
Inside each EV battery pack are multiple interconnected modules made up of tens to hundreds of rechargeable Li-ion cells. Collectively, these cells make up roughly 77% of the total cost of an average battery pack, or about $101/kWh.
So, what drives the cost of these individual battery cells?
The Cost of a Battery Cell
According to data from BloombergNEF, the cost of each cell’s cathode adds up to more than half of the overall cell cost.
| EV Battery Cell Component | % of Cell Cost |
|---|---|
| Cathode | 51% |
| Manufacturing and depreciation | 24% |
| Anode | 12% |
| Separator | 7% |
| Electrolyte | 4% |
| Housing and other materials | 3% |
Percentages may not add to 100% due to rounding.
Why Are Cathodes so Expensive?
The cathode is the positively charged electrode of the battery. When a battery is discharged, both electrons and positively-charged molecules (the eponymous lithium ions) flow from the anode to the cathode, which stores both until the battery is charged again.
That means that cathodes effectively determine the performance, range, and thermal safety of a battery, and therefore of an EV itself, making them one of the most important components.
They are composed of various metals (in refined forms) depending on cell chemistry, typically including lithium and nickel. Common cathode compositions in modern use include:
- Lithium iron phosphate (LFP)
- Lithium nickel manganese cobalt (NMC)
- Lithium nickel cobalt aluminum oxide (NCA)
The battery metals that make up the cathode are in high demand, with automakers like Tesla rushing to secure supplies as EV sales charge ahead. In fact, the commodities in the cathode, along with those in other parts of the cell, account for roughly 40% of the overall cell cost.
Other EV Battery Cell Components
Components outside of the cathode make up the other 49% of a cell’s cost.
The manufacturing process, which involves producing the electrodes, assembling the different components, and finishing the cell, makes up 24% of the total cost.
The anode is another significant component of the battery, and it makes up 12% of the total cost—around one-fourth of the cathode’s share. The anode in a Li-ion cell is typically made of natural or synthetic graphite, which tends to be less expensive than other battery commodities.
Although battery costs have been declining since 2010, the recent surge in prices of key battery metals like lithium has cast a shadow of doubt over their future. How will EV battery prices evolve going forward?


Energy
Mapped: The Age of Energy Projects in Interconnection Queues, by State
This map shows how many energy projects are in interconnection queues by state and how long these projects have been queued up, on average.


Age of Energy Projects in Interconnection Queues, by State
This was originally posted on our Voronoi app. Download the app for free on iOS or Android and discover incredible data-driven charts from a variety of trusted sources.
By the end of 2023, more than 11,000 energy projects were in interconnection queues in the United States, waiting for a green-light from regional grid operators to proceed with construction.
This map, created in partnership with the National Public Utilities Council, maps out the average age of active energy projects in interconnection queues by state, using data from Berkeley Lab.
Interconnection Queues, Explained
Interconnection queues are lists of energy projects that have made interconnection requests to their regional grid operators. Once submitted, these requests formally initiate the impact study process that each project goes through before grid connection, forming waiting lists for approval known as interconnection queues.
In recent years, both the number and generation capacity of queued projects have surged in the United States, along with the length of time spent in queue.
According to Berkeley Lab, the amount of generation capacity entering queues each year has risen by more than 550% from 2015 to 2023, with average queue duration rising from 3 years to 5 years the same period.
As a result of the growing backlog, a large proportion of projects ultimately withdraw from queues, leading to only 19% of applications reaching commercial operations.
The Backlog: Number of Projects and Average Wait Times
Of the 11,000 active projects in U.S. queues at the end of 2023, Texas, California, and Virginia had the most in queue; 1,208, 947, and 743, respectively.
When looking at the average ages of these projects, all three states hovered around the national average of 34 months (2.83 years), with Texas sporting 28 months, California 33, and Virginia 34.
Vermont, Minnesota, Wisconsin, and Florida, on the other hand, had the highest average queue durations; 54, 49, 47, and 46 months, respectively.
Average Queue Duration by Project Type
At the end of 2023, more than 95% of the generation capacity in active interconnection queues was for emission-free resources. The table below provides a breakdown.
| Project Type | Average Queue Duration (As of 12/31/2023) | Number of Projects in Queue |
|---|---|---|
| Wind | 40 months | 841 |
| Solar | 34 months | 4,506 |
| Wind+Battery | 34 months | 76 |
| Solar+Battery | 27 months | 2,377 |
| Battery | 24 months | 2,818 |
Wind projects had the highest wait times at the end of 2023 with an average age of 40 months (3.33 years). Solar projects, on the other hand, made up more than 40% of projects in queue.
Overall, reducing the time that these renewable energy projects spend in queues can accelerate the transition to a low-carbon energy future.
According to the U.S. Department of Energy, enhancing data transparency, streamlining approval processes, promoting economic efficiency, and maintaining a reliable grid are some of the ways this growing backlog can be mitigated.

-

 Wealth6 days ago
Charted: Which City Has the Most Billionaires in 2024?
-

 Mining2 weeks ago
Gold vs. S&P 500: Which Has Grown More Over Five Years?
-

 Uranium2 weeks ago
The World’s Biggest Nuclear Energy Producers
-

 Education2 weeks ago
How Hard Is It to Get Into an Ivy League School?
-

 Debt2 weeks ago
How Debt-to-GDP Ratios Have Changed Since 2000
-

 Sports2 weeks ago
The Highest Earning Athletes in Seven Professional Sports
-

 Science2 weeks ago
Visualizing the Average Lifespans of Mammals
-

 Brands1 week ago
How Tech Logos Have Evolved Over Time