Technology
The Outlook for Automation and Manufacturing Jobs in Seven Charts
View a high resolution version of this graphic.
The Outlook for Automation and Manufacturing in Seven Charts
View the high resolution version of today’s graphic by clicking here.
Over the last decade, the prospect of mass automation has seemingly shifted from a vague possibility to an inescapable reality.
While it’s still incredibly difficult to estimate the ultimate impact of automation and AI on the economy, the picture is starting to become a bit clearer as projections begin to converge.
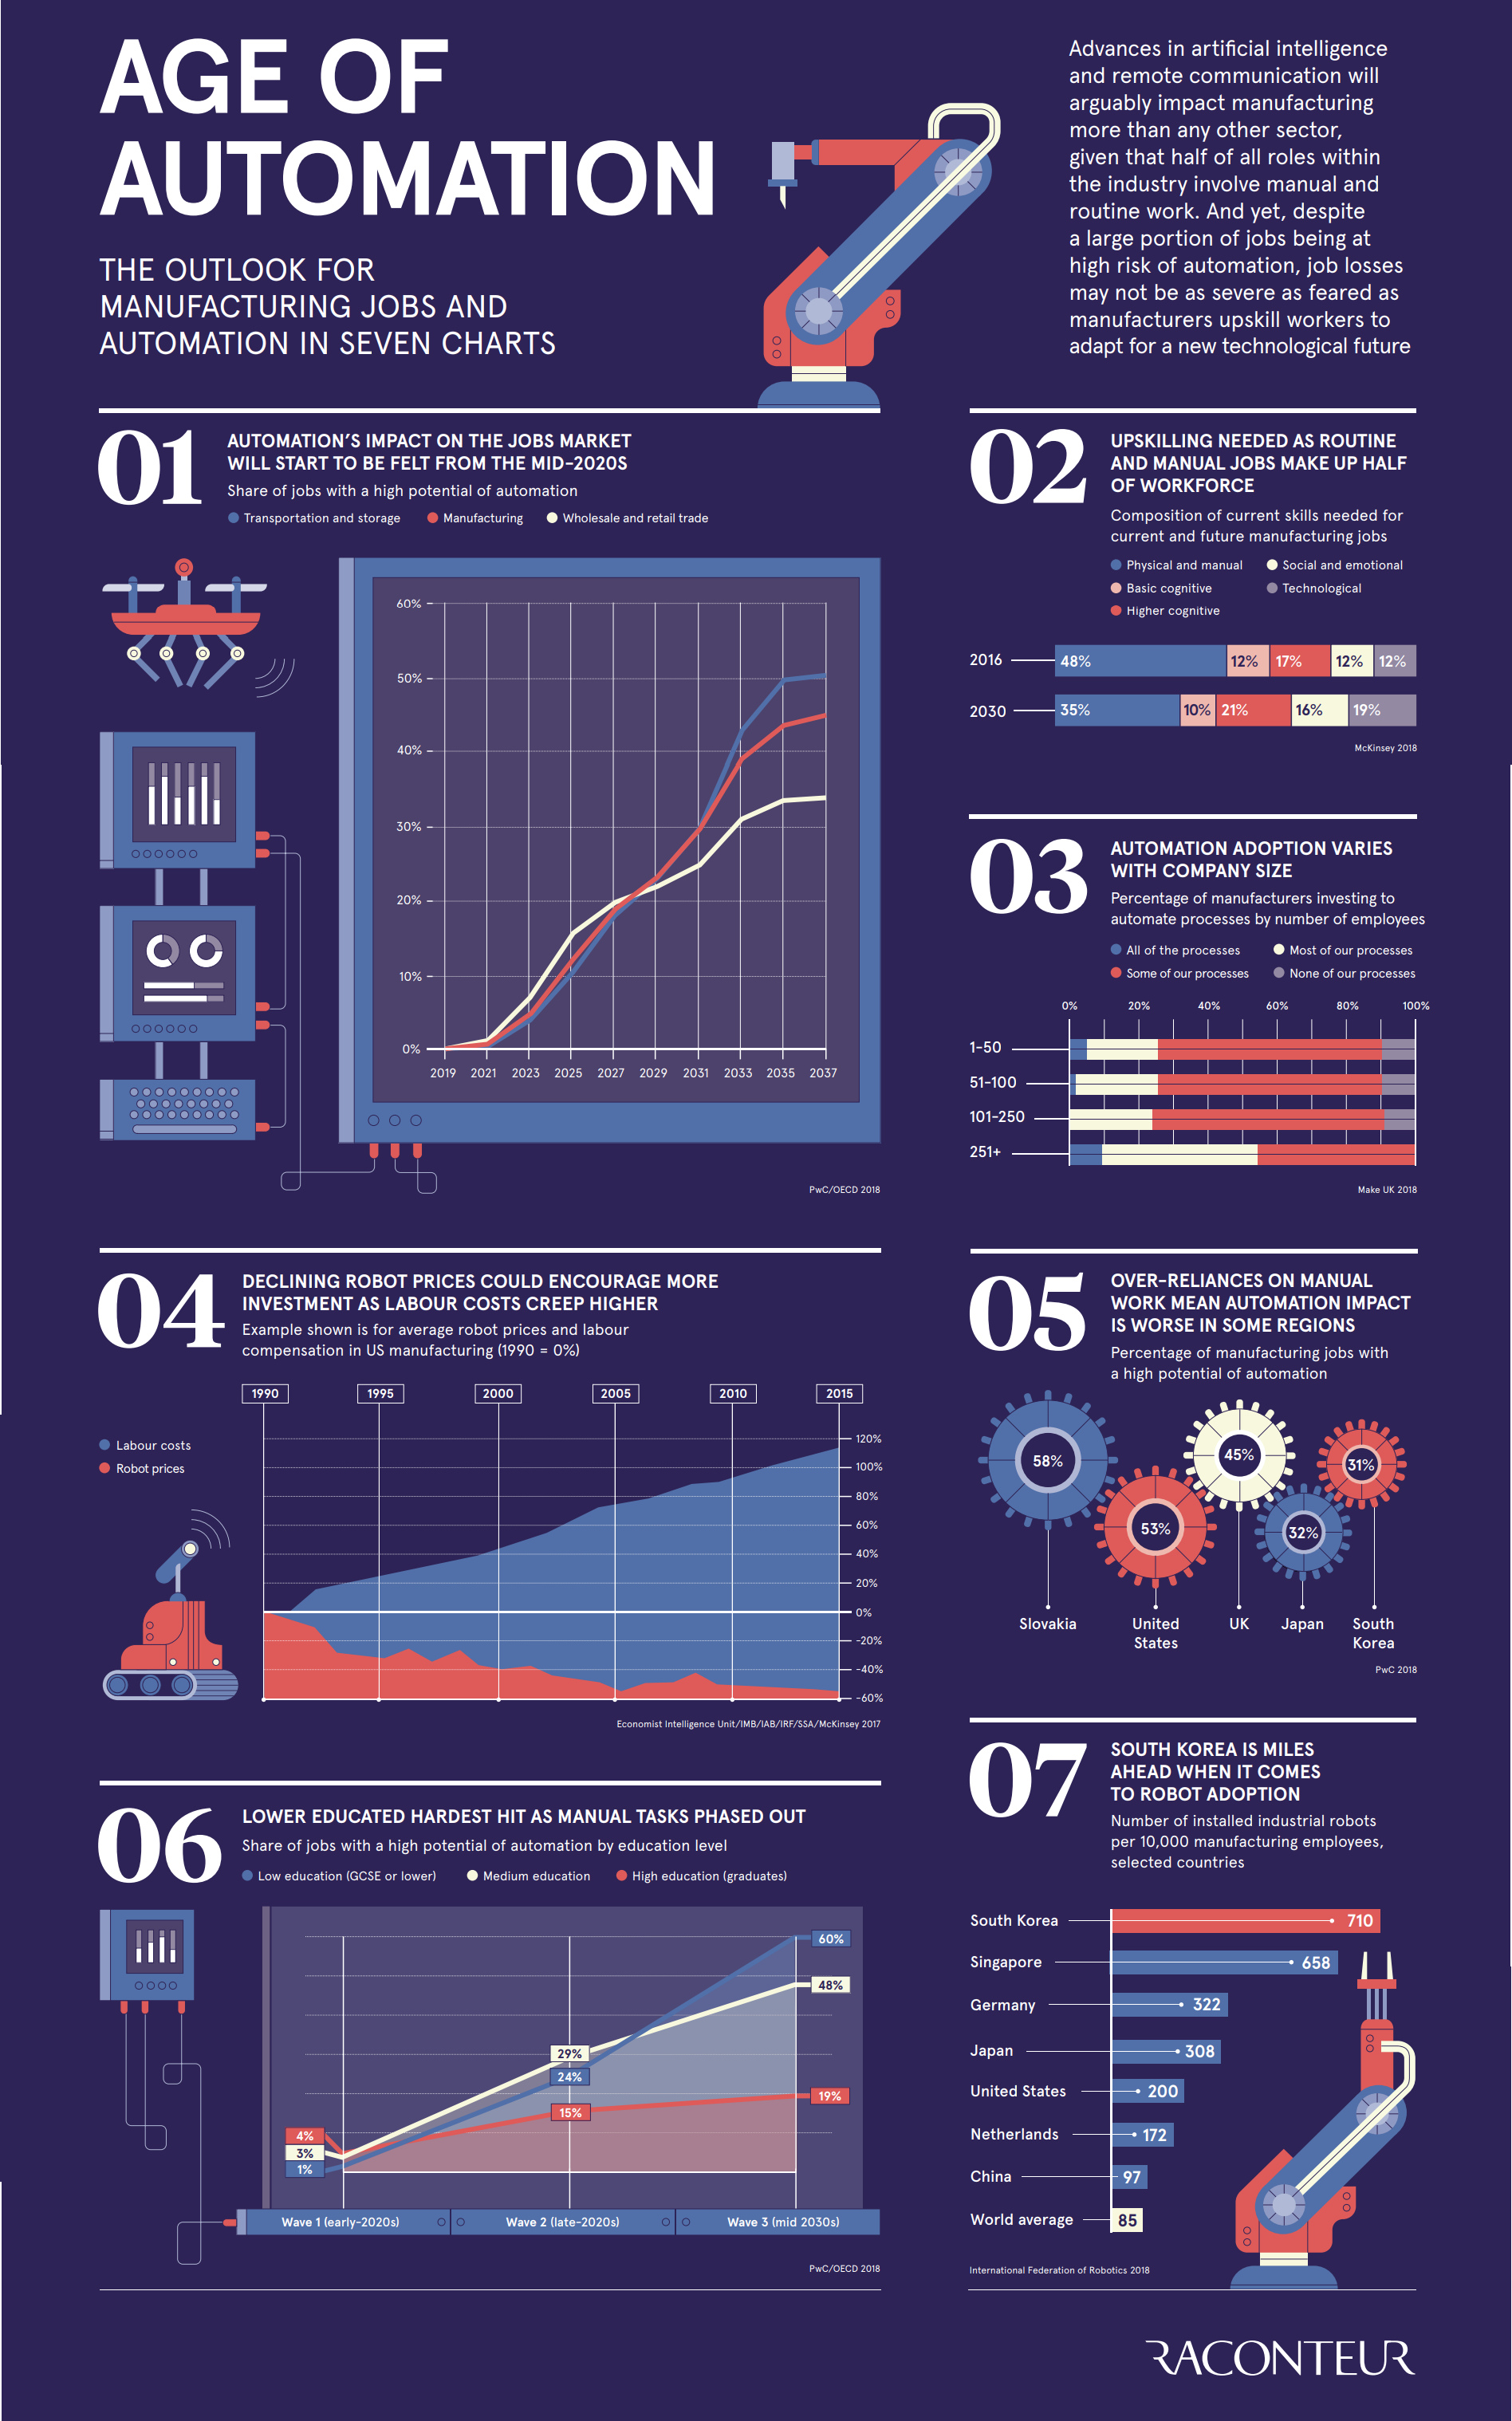
Today’s infographic comes to us from Raconteur, and it highlights seven different charts that show us how automation is shaping the world – and in particular, the future outlook for manufacturing jobs.
The Age of Automation
The precise details are up to debate, but here are a few key areas that many experts agree on with respect to the coming age of automation:
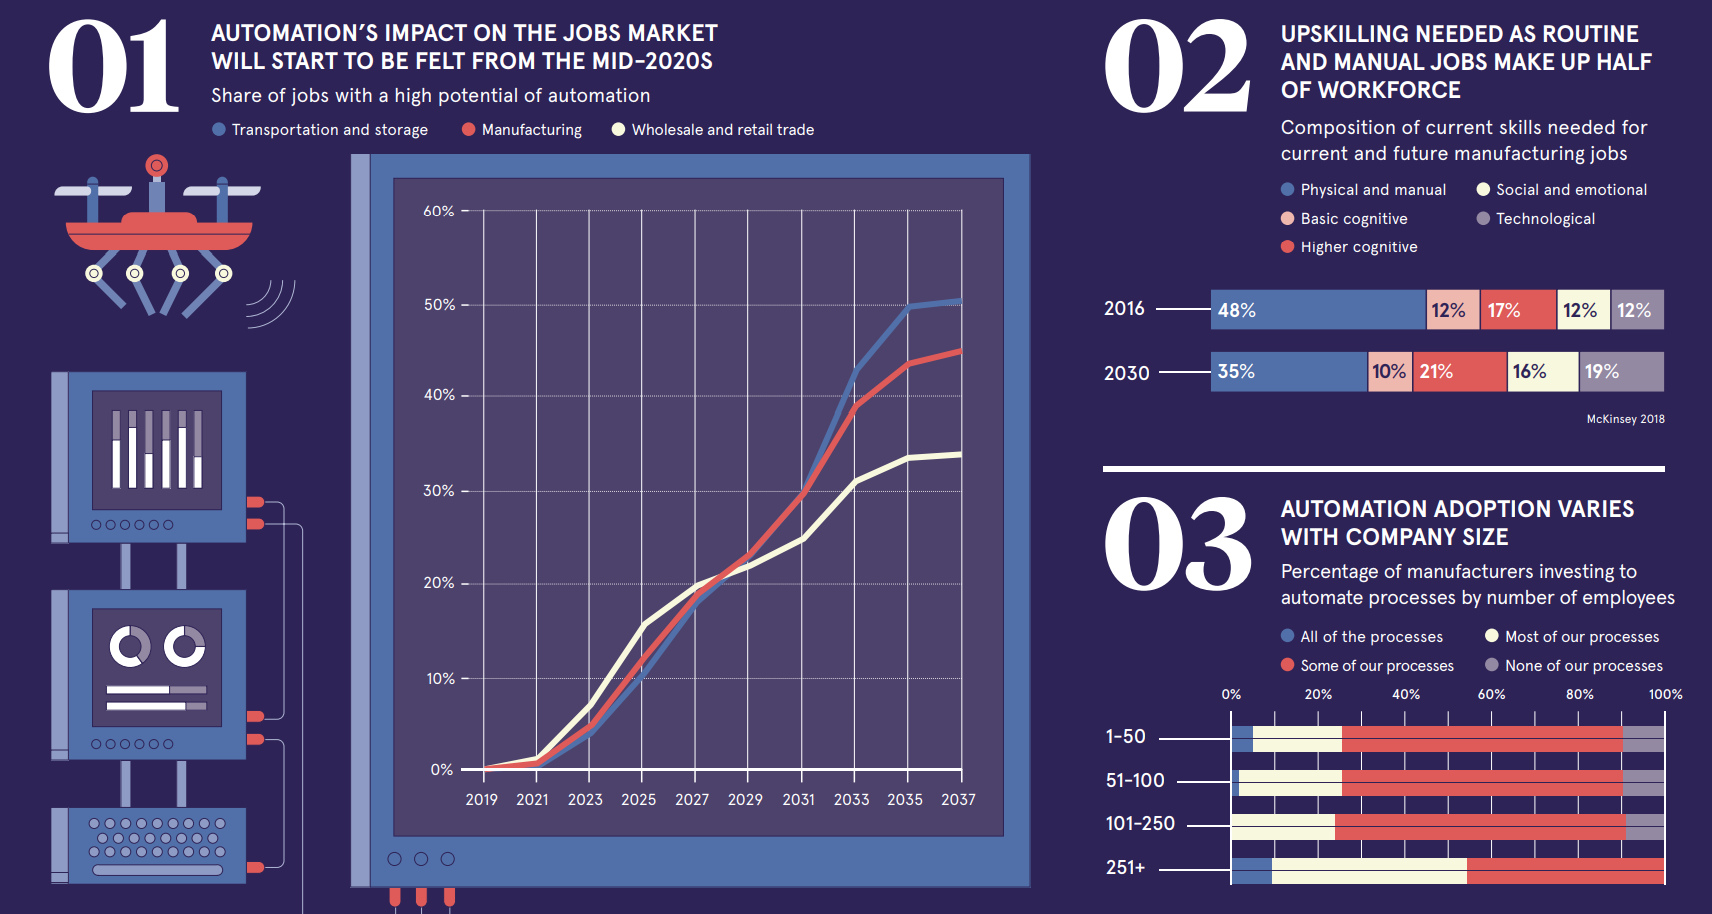
Half of manufacturing hours worked today are spent on manual jobs.
- In an analysis of North American and European manufacturing jobs, it was found that roughly 48% of hours primarily relied on the use of manual or physical labor.
- By the year 2030, it’s estimated that only 35% of time will be spent on such routine work.
Automation’s impact will be felt by the mid-2020s.
- According to a recent report from PwC, the impact on OECD jobs will start to be felt in the mid-2020s.
- By 2025, for example, it’s projected that 10-15% of jobs in three sectors (manufacturing, transportation and storage, and wholesales and retail trade) will have high potential for automation.
- By 2035, the range of jobs with high automation potential will be closer to 35-50% for those sectors.
Industrial robot prices are decreasing.
- Industrial robot sales are sky high, mainly the result of falling industry costs.
- This trend is expected to continue, with the cost of robots falling by 65% between 2015 and 2025.
- With the cost of labor generally rising, this makes it more difficult to keep low-skilled jobs.
Technology simultaneously creates jobs, but how many?
- One bright spot is that automation and AI will also create jobs, likely in functions that are difficult for us to conceive of today.
- Historically, technology has created more jobs than it has destroyed.
- AI alone is expected to have an economic impact of $15.7 trillion by 2030.
Unfortunately, although experts agree that jobs will be created by these technologies, they disagree considerably on how many. This important discrepancy is likely the biggest x-factor in determining the ultimate impact that these technologies will have in the coming years, especially on the workforce.


Technology
Visualizing AI Patents by Country
See which countries have been granted the most AI patents each year, from 2012 to 2022.


Visualizing AI Patents by Country
This was originally posted on our Voronoi app. Download the app for free on iOS or Android and discover incredible data-driven charts from a variety of trusted sources.
This infographic shows the number of AI-related patents granted each year from 2010 to 2022 (latest data available). These figures come from the Center for Security and Emerging Technology (CSET), accessed via Stanford University’s 2024 AI Index Report.
From this data, we can see that China first overtook the U.S. in 2013. Since then, the country has seen enormous growth in the number of AI patents granted each year.
| Year | China | EU and UK | U.S. | RoW | Global Total |
|---|---|---|---|---|---|
| 2010 | 307 | 137 | 984 | 571 | 1,999 |
| 2011 | 516 | 129 | 980 | 581 | 2,206 |
| 2012 | 926 | 112 | 950 | 660 | 2,648 |
| 2013 | 1,035 | 91 | 970 | 627 | 2,723 |
| 2014 | 1,278 | 97 | 1,078 | 667 | 3,120 |
| 2015 | 1,721 | 110 | 1,135 | 539 | 3,505 |
| 2016 | 1,621 | 128 | 1,298 | 714 | 3,761 |
| 2017 | 2,428 | 144 | 1,489 | 1,075 | 5,136 |
| 2018 | 4,741 | 155 | 1,674 | 1,574 | 8,144 |
| 2019 | 9,530 | 322 | 3,211 | 2,720 | 15,783 |
| 2020 | 13,071 | 406 | 5,441 | 4,455 | 23,373 |
| 2021 | 21,907 | 623 | 8,219 | 7,519 | 38,268 |
| 2022 | 35,315 | 1,173 | 12,077 | 13,699 | 62,264 |
In 2022, China was granted more patents than every other country combined.
While this suggests that the country is very active in researching the field of artificial intelligence, it doesn’t necessarily mean that China is the farthest in terms of capability.
Key Facts About AI Patents
According to CSET, AI patents relate to mathematical relationships and algorithms, which are considered abstract ideas under patent law. They can also have different meaning, depending on where they are filed.
In the U.S., AI patenting is concentrated amongst large companies including IBM, Microsoft, and Google. On the other hand, AI patenting in China is more distributed across government organizations, universities, and tech firms (e.g. Tencent).
In terms of focus area, China’s patents are typically related to computer vision, a field of AI that enables computers and systems to interpret visual data and inputs. Meanwhile America’s efforts are more evenly distributed across research fields.
Learn More About AI From Visual Capitalist
If you want to see more data visualizations on artificial intelligence, check out this graphic that shows which job departments will be impacted by AI the most.

-

 Markets1 week ago
U.S. Debt Interest Payments Reach $1 Trillion
-

 Business2 weeks ago
Charted: Big Four Market Share by S&P 500 Audits
-

 Real Estate2 weeks ago
Ranked: The Most Valuable Housing Markets in America
-

 Money2 weeks ago
Which States Have the Highest Minimum Wage in America?
-

 AI2 weeks ago
Ranked: Semiconductor Companies by Industry Revenue Share
-

 Markets2 weeks ago
Ranked: The World’s Top Flight Routes, by Revenue
-

 Demographics2 weeks ago
Population Projections: The World’s 6 Largest Countries in 2075
-

 Markets2 weeks ago
The Top 10 States by Real GDP Growth in 2023