Markets
Animation: The Earnings of the Biggest Movie Franchises Over the Last 20 Years
Note: The Numbers defines North America as the United States, Canada, Puerto Rico and Guam. The data here does not cover all of the top-grossing movie franchises.
Animation: The Earnings of the Biggest Movie Franchises Over the Last 20 Years
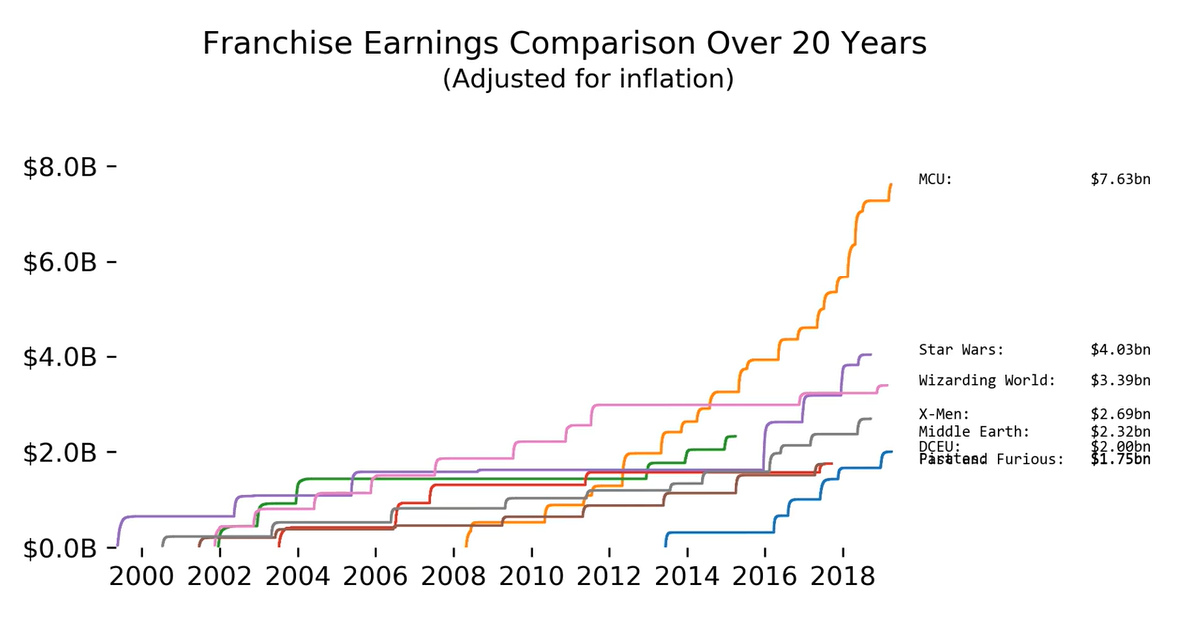
From Iron Man to Luke Skywalker, viewers love watching their favorite heroes triumph over evil time and time again. These successful movie franchises have won our hearts, and padded film studios’ wallets in the process.
Today’s animation comes from Reddit user /u/rebellious_scum and it charts North American box office sales for select movie franchises, as reported by movie data website The Numbers. The daily ticket earnings were captured from May 19, 1999 (release date of Star Wars: Episode I) to April 4, 2019 and adjusted for inflation.
What stands out the most?
The clear takeaway from the animation is Marvel’s exponential earnings growth since it debuted with Iron Man in 2008.
As of April 4, the franchise had earned inflation-adjusted revenue of $7.63 billion – almost double that of runner-up Star Wars, which totaled $4.03 billion. Of course, this does not take into account data from the record-shattering release of Avengers: Endgame on April 26th, which would skew numbers in Marvel’s favor even more.
Average Revenue Per Movie
While these numbers sound impressive, what’s the average revenue each movie has generated in North America?
Using the animation’s inflation-adjusted numbers, here’s how it all breaks down:
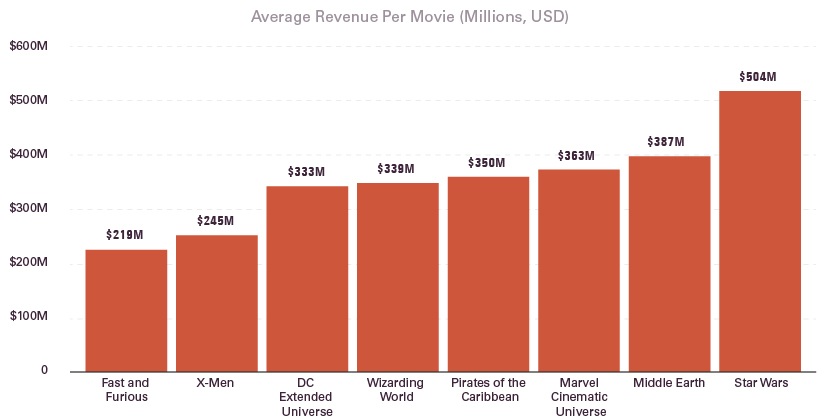
Star Wars and Middle Earth top the list in terms of average revenue per movie. Meanwhile, Marvel lands in third place and is closely followed by Pirates of the Caribbean, the Wizarding World, and the DC Extended Universe (DCEU).
Compared to direct competitor DCEU, Marvel earns roughly $30 million more per movie.
The Rate of Movie Production
The secret, in part, to Marvel’s astronomical surge?
They produce movies at breakneck speed. The studio knows it has a winning recipe, and cooks up movies quickly to stay fresh in viewers’ minds.
In twelve years, Marvel Studios has produced 22 movies including Avengers: Endgame. By comparison, the giant James Bond franchise has produced 24 movies since its inception 57 years ago in 1962.
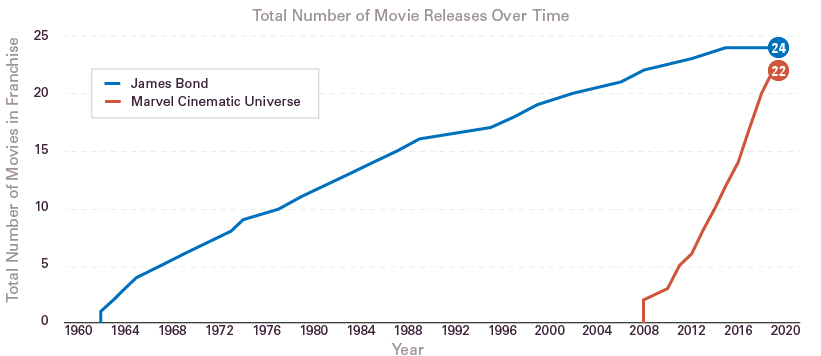
Source: 007.com, Marvel.com
The Market Share Leaders
With Disney’s recent purchase of Fox, the ownership of movie franchises became even more concentrated.
Today, Hollywood essentially has three parent companies: The Walt Disney Company, Universal/Comcast Corp., and WarnerMedia (previously TimeWarner).
Here’s who owns the above eight franchises:
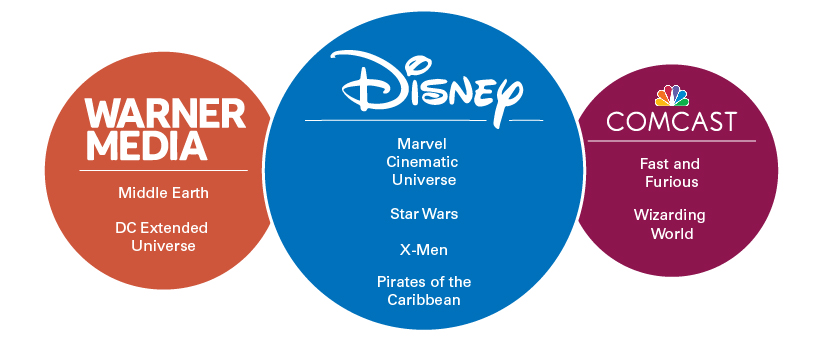
Sources: Business Insider, Forbes, Fortune, The Tolkien Society
Disney is a major player in the franchise space, and shows no signs of slowing down. There are even talks that the company is looking to reboot the Pirates of the Caribbean franchise.
In an industry full of risk, studios are looking to capitalize on a winning franchise formula: build a trusted brand with beloved characters, and produce movies as fast as time will allow.


Markets
The European Stock Market: Attractive Valuations Offer Opportunities
On average, the European stock market has valuations that are nearly 50% lower than U.S. valuations. But how can you access the market?


European Stock Market: Attractive Valuations Offer Opportunities
Europe is known for some established brands, from L’Oréal to Louis Vuitton. However, the European stock market offers additional opportunities that may be lesser known.
The above infographic, sponsored by STOXX, outlines why investors may want to consider European stocks.
Attractive Valuations
Compared to most North American and Asian markets, European stocks offer lower or comparable valuations.
| Index | Price-to-Earnings Ratio | Price-to-Book Ratio |
|---|---|---|
| EURO STOXX 50 | 14.9 | 2.2 |
| STOXX Europe 600 | 14.4 | 2 |
| U.S. | 25.9 | 4.7 |
| Canada | 16.1 | 1.8 |
| Japan | 15.4 | 1.6 |
| Asia Pacific ex. China | 17.1 | 1.8 |
Data as of February 29, 2024. See graphic for full index names. Ratios based on trailing 12 month financials. The price to earnings ratio excludes companies with negative earnings.
On average, European valuations are nearly 50% lower than U.S. valuations, potentially offering an affordable entry point for investors.
Research also shows that lower price ratios have historically led to higher long-term returns.
Market Movements Not Closely Connected
Over the last decade, the European stock market had low-to-moderate correlation with North American and Asian equities.
The below chart shows correlations from February 2014 to February 2024. A value closer to zero indicates low correlation, while a value of one would indicate that two regions are moving in perfect unison.
| EURO STOXX 50 | STOXX EUROPE 600 | U.S. | Canada | Japan | Asia Pacific ex. China |
|
|---|---|---|---|---|---|---|
| EURO STOXX 50 | 1.00 | 0.97 | 0.55 | 0.67 | 0.24 | 0.43 |
| STOXX EUROPE 600 | 1.00 | 0.56 | 0.71 | 0.28 | 0.48 | |
| U.S. | 1.00 | 0.73 | 0.12 | 0.25 | ||
| Canada | 1.00 | 0.22 | 0.40 | |||
| Japan | 1.00 | 0.88 | ||||
| Asia Pacific ex. China | 1.00 |
Data is based on daily USD returns.
European equities had relatively independent market movements from North American and Asian markets. One contributing factor could be the differing sector weights in each market. For instance, technology makes up a quarter of the U.S. market, but health care and industrials dominate the broader European market.
Ultimately, European equities can enhance portfolio diversification and have the potential to mitigate risk for investors.
Tracking the Market
For investors interested in European equities, STOXX offers a variety of flagship indices:
| Index | Description | Market Cap |
|---|---|---|
| STOXX Europe 600 | Pan-regional, broad market | €10.5T |
| STOXX Developed Europe | Pan-regional, broad-market | €9.9T |
| STOXX Europe 600 ESG-X | Pan-regional, broad market, sustainability focus | €9.7T |
| STOXX Europe 50 | Pan-regional, blue-chip | €5.1T |
| EURO STOXX 50 | Eurozone, blue-chip | €3.5T |
Data is as of February 29, 2024. Market cap is free float, which represents the shares that are readily available for public trading on stock exchanges.
The EURO STOXX 50 tracks the Eurozone’s biggest and most traded companies. It also underlies one of the world’s largest ranges of ETFs and mutual funds. As of November 2023, there were €27.3 billion in ETFs and €23.5B in mutual fund assets under management tracking the index.
“For the past 25 years, the EURO STOXX 50 has served as an accurate, reliable and tradable representation of the Eurozone equity market.”
— Axel Lomholt, General Manager at STOXX
Partnering with STOXX to Track the European Stock Market
Are you interested in European equities? STOXX can be a valuable partner:
- Comprehensive, liquid and investable ecosystem
- European heritage, global reach
- Highly sophisticated customization capabilities
- Open architecture approach to using data
- Close partnerships with clients
- Part of ISS STOXX and Deutsche Börse Group
With a full suite of indices, STOXX can help you benchmark against the European stock market.
Learn how STOXX’s European indices offer liquid and effective market access.

-

 Economy2 days ago
Economic Growth Forecasts for G7 and BRICS Countries in 2024
The IMF has released its economic growth forecasts for 2024. How do the G7 and BRICS countries compare?
-

 Markets1 week ago
U.S. Debt Interest Payments Reach $1 Trillion
U.S. debt interest payments have surged past the $1 trillion dollar mark, amid high interest rates and an ever-expanding debt burden.
-

 United States2 weeks ago
Ranked: The Largest U.S. Corporations by Number of Employees
We visualized the top U.S. companies by employees, revealing the massive scale of retailers like Walmart, Target, and Home Depot.
-

 Markets2 weeks ago
The Top 10 States by Real GDP Growth in 2023
This graphic shows the states with the highest real GDP growth rate in 2023, largely propelled by the oil and gas boom.
-

 Markets2 weeks ago
Ranked: The World’s Top Flight Routes, by Revenue
In this graphic, we show the highest earning flight routes globally as air travel continued to rebound in 2023.
-

 Markets2 weeks ago
Ranked: The Most Valuable Housing Markets in America
The U.S. residential real estate market is worth a staggering $47.5 trillion. Here are the most valuable housing markets in the country.


-

 Energy1 week ago
The World’s Biggest Nuclear Energy Producers
-

 Money2 weeks ago
Which States Have the Highest Minimum Wage in America?
-

 Technology2 weeks ago
Ranked: Semiconductor Companies by Industry Revenue Share
-
Markets2 weeks ago
Ranked: The World’s Top Flight Routes, by Revenue
-

 Countries2 weeks ago
Population Projections: The World’s 6 Largest Countries in 2075
-
Markets2 weeks ago
The Top 10 States by Real GDP Growth in 2023
-

 Demographics2 weeks ago
The Smallest Gender Wage Gaps in OECD Countries
-

 United States2 weeks ago
Where U.S. Inflation Hit the Hardest in March 2024