Markets
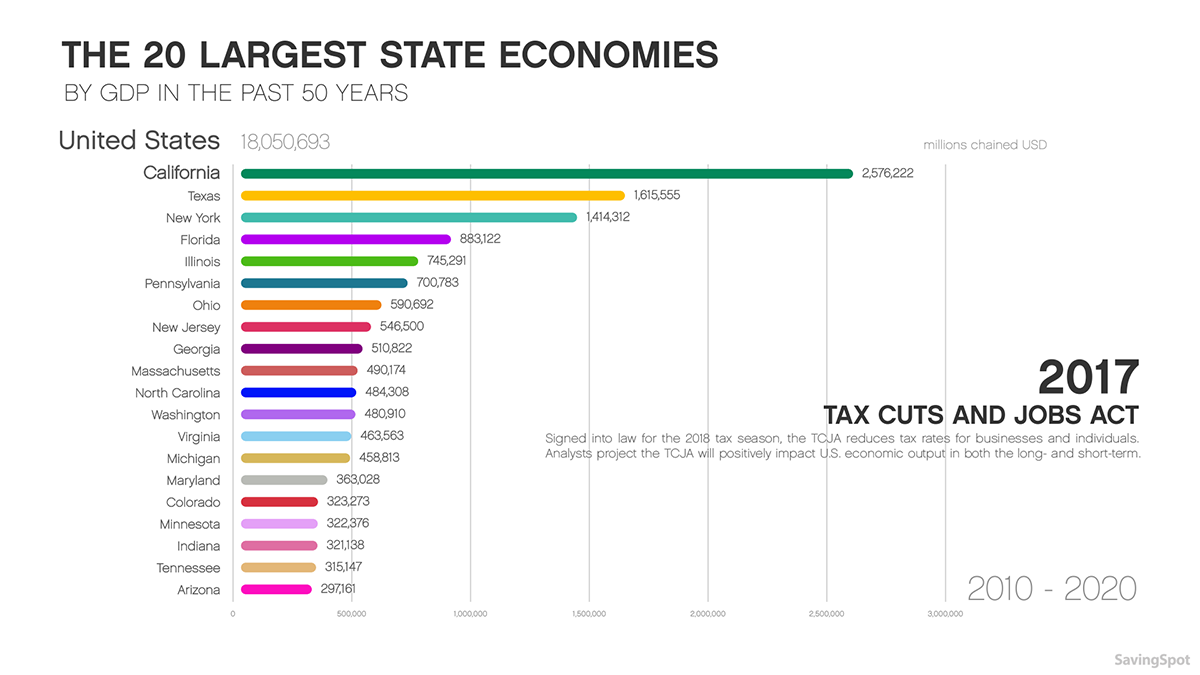
Animation: The 20 Largest State Economies by GDP in the Last 50 Years
Animation: The 20 Largest State Economies by GDP
When it comes to understanding the size and scope of the $18 trillion U.S. economy, it’s sometimes easier to consider that it’s the sum of many parts.
Many states already have economies that are comparable to some of the world’s largest countries, giving you a sense of what they might be combined.
And while every state plays a role in the bigger picture, some states such as New York and California have an outsized impact on fueling the country’s overall economic engine.
The State of State Economies
Today’s animation comes to us from SavingSpot, and it covers the size of state economies by GDP going back all the way to 1963.
The video uses inflation-adjusted data from the U.S. Bureau of Economic Analysis, showing how the ranking of top state economies has changed over time as different states have taken advantage of economic booms.
Let’s dive into the data to see how things have changed.
Going Back in Time
The earliest data in the animation comes from 1963, when New York led the pack with a $70.6 billion economy in inflation-adjusted terms.
State Economies by GDP, Inflation-Adjusted Chained $USD (1963)
| Rank | State Economy | GDP, Billions of USD (1963) | Share of U.S. Economy |
|---|---|---|---|
| #1 | New York | $70.6 | 11.6% |
| #2 | California | $67.8 | 11.2% |
| #3 | Illinois | $39.5 | 6.5% |
| #4 | Pennsylvania | $34.5 | 5.7% |
| #5 | Ohio | $33.3 | 5.5% |
| #6 | Michigan | $30.5 | 5.0% |
| #7 | Texas | $29.3 | 4.8% |
| #8 | New Jersey | $23.4 | 3.9% |
| #9 | Massachusetts | $17.4 | 2.9% |
| #10 | Indiana | $15.6 | 2.6% |
| #11 | Florida | $14.7 | 2.4% |
| #12 | Missouri | $13.6 | 2.2% |
| #13 | Wisconsin | $12.7 | 2.1% |
| #14 | North Carolina | $12.6 | 2.1% |
| #15 | Virginia | $11.7 | 1.9% |
| #16 | Washington | $11.2 | 1.8% |
| #17 | Minnesota | $10.7 | 1.8% |
| #18 | Georgia | $10.3 | 1.7% |
| #19 | Maryland | $10.3 | 1.7% |
| #20 | Connecticut | $9.9 | 1.6% |
| #21 | Louisiana | $9.7 | 1.6% |
| #22 | Tennessee | $9.1 | 1.5% |
| #23 | Kentucky | $8.4 | 1.4% |
| #24 | Iowa | $7.9 | 1.3% |
| #25 | Alabama | $7.3 | 1.2% |
| #26 | Oklahoma | $6.2 | 1.0% |
| #27 | Kansas | $6.1 | 1.0% |
| #28 | Colorado | $5.9 | 1.0% |
| #29 | Oregon | $5.7 | 0.9% |
| #30 | District of Columbia | $5.1 | 0.8% |
| #31 | South Carolina | $5.1 | 0.8% |
| #32 | West Virginia | $4.6 | 0.8% |
| #33 | Arizona | $4.5 | 0.7% |
| #34 | Mississippi | $4.4 | 0.7% |
| #35 | Nebraska | $4.3 | 0.7% |
| #36 | Arkansas | $3.8 | 0.6% |
| #37 | New Mexico | $3.0 | 0.5% |
| #38 | Utah | $3.0 | 0.5% |
| #39 | Rhode Island | $2.7 | 0.4% |
| #40 | Maine | $2.4 | 0.4% |
| #41 | Hawaii | $2.4 | 0.4% |
| #42 | Montana | $2.0 | 0.3% |
| #43 | Delaware | $1.9 | 0.3% |
| #44 | Idaho | $1.8 | 0.3% |
| #45 | Nevada | $1.8 | 0.3% |
| #46 | New Hampshire | $1.7 | 0.3% |
| #47 | North Dakota | $1.6 | 0.3% |
| #48 | South Dakota | $1.6 | 0.3% |
| #49 | Wyoming | $1.4 | 0.2% |
| #50 | Alaska | $1.1 | 0.2% |
| #51 | Vermont | $1.0 | 0.2% |
| 🇺🇸 United States (Total) | $607.0 | 100.0% |
California ($67.8 billion), Illinois ($39.5 billion), Pennsylvania ($34.5 billion) and Ohio ($33.3 billion) round out the top five, and together they added up to 40.5% of the national GDP.
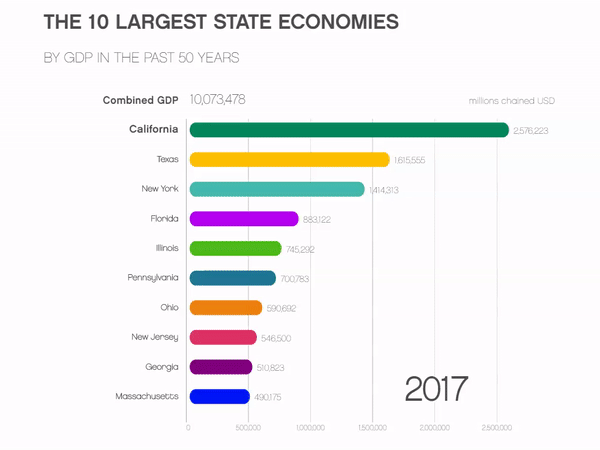
The Largest State Economies by GDP Today
Looking at the most recent data from 2017, you can see the ranking changes significantly:
State Economies by GDP, Inflation-Adjusted Chained $USD (2017)
| Rank | State Economy | GDP, Billions of USD (2017) | Share of U.S. Economy |
|---|---|---|---|
| #1 | California | $2,576 | 14.3% |
| #2 | Texas | $1,616 | 9.0% |
| #3 | New York | $1,414 | 7.8% |
| #4 | Florida | $883 | 4.9% |
| #5 | Illinois | $745 | 4.1% |
| #6 | Pennsylvania | $701 | 3.9% |
| #7 | Ohio | $591 | 3.3% |
| #8 | New Jersey | $547 | 3.0% |
| #9 | Georgia | $511 | 2.8% |
| #10 | Michigan | $459 | 2.5% |
| #11 | North Carolina | $484 | 2.7% |
| #12 | Virginia | $464 | 2.6% |
| #13 | Massachusetts | $490 | 2.7% |
| #14 | Washington | $481 | 2.7% |
| #15 | Maryland | $363 | 2.0% |
| #16 | Indiana | $321 | 1.8% |
| #17 | Arizona | $297 | 1.6% |
| #18 | Minnesota | $322 | 1.8% |
| #19 | Tennessee | $315 | 1.7% |
| #20 | Wisconsin | $292 | 1.6% |
| #21 | Colorado | $323 | 1.8% |
| #22 | Missouri | $276 | 1.5% |
| #23 | Connecticut | $239 | 1.3% |
| #24 | Louisiana | $227 | 1.3% |
| #25 | Alabama | $193 | 1.1% |
| #26 | South Carolina | $199 | 1.1% |
| #27 | Kentucky | $185 | 1.0% |
| #28 | Oregon | $208 | 1.2% |
| #29 | Oklahoma | $191 | 1.1% |
| #30 | Iowa | $169 | 0.9% |
| #31 | Nevada | $143 | 0.8% |
| #32 | Kansas | $148 | 0.8% |
| #33 | Utah | $150 | 0.8% |
| #34 | Arkansas | $114 | 0.6% |
| #35 | District of Columbia | $122 | 0.7% |
| #36 | Mississippi | $100 | 0.6% |
| #37 | Nebraska | $111 | 0.6% |
| #38 | New Mexico | $91 | 0.5% |
| #39 | Hawaii | $79 | 0.4% |
| #40 | West Virginia | $71 | 0.4% |
| #41 | New Hampshire | $74 | 0.4% |
| #42 | Delaware | $64 | 0.4% |
| #43 | Idaho | $67 | 0.4% |
| #44 | Maine | $56 | 0.3% |
| #45 | Rhode Island | $53 | 0.3% |
| #46 | Alaska | $52 | 0.3% |
| #47 | Montana | $44 | 0.2% |
| #48 | Wyoming | $39 | 0.2% |
| #49 | South Dakota | $45 | 0.3% |
| #50 | North Dakota | $51 | 0.3% |
| #51 | Vermont | $30 | 0.2% |
| 🇺🇸 United States (Total) | $18,051 | 100% |
California is the largest economy today – it has a state GDP of $2.6 trillion, which is comparable to the United Kingdom.
Meanwhile, Florida and Georgia are two states that did not crack the top 10 back in the 1960s, while Texas jumped up to become the second largest state economy. It’s actually not a coincidence that all of these states are in the southern half of the country, as air conditioning has played a surprisingly pivotal role in shaping modern America.
In fact, the share of the nation’s population living in the Sunbelt rose from 28% in 1950 to 40% in 2000, and this increase in population has coincided with economic growth in many of the states that used to be a sweaty mess.
A Final Look
Here is a final animated version of the top 10 largest states by GDP, also provided by SavingSpot:


Economy
Economic Growth Forecasts for G7 and BRICS Countries in 2024
The IMF has released its economic growth forecasts for 2024. How do the G7 and BRICS countries compare?


G7 & BRICS Real GDP Growth Forecasts for 2024
The International Monetary Fund’s (IMF) has released its real gross domestic product (GDP) growth forecasts for 2024, and while global growth is projected to stay steady at 3.2%, various major nations are seeing declining forecasts.
This chart visualizes the 2024 real GDP growth forecasts using data from the IMF’s 2024 World Economic Outlook for G7 and BRICS member nations along with Saudi Arabia, which is still considering an invitation to join the bloc.
Get the Key Insights of the IMF’s World Economic Outlook
Want a visual breakdown of the insights from the IMF’s 2024 World Economic Outlook report?
This visual is part of a special dispatch of the key takeaways exclusively for VC+ members.
Get the full dispatch of charts by signing up to VC+.
Mixed Economic Growth Prospects for Major Nations in 2024
Economic growth projections by the IMF for major nations are mixed, with the majority of G7 and BRICS countries forecasted to have slower growth in 2024 compared to 2023.
Only three BRICS-invited or member countries, Saudi Arabia, the UAE, and South Africa, have higher projected real GDP growth rates in 2024 than last year.
| Group | Country | Real GDP Growth (2023) | Real GDP Growth (2024P) |
|---|---|---|---|
| G7 | 🇺🇸 U.S. | 2.5% | 2.7% |
| G7 | 🇨🇦 Canada | 1.1% | 1.2% |
| G7 | 🇯🇵 Japan | 1.9% | 0.9% |
| G7 | 🇫🇷 France | 0.9% | 0.7% |
| G7 | 🇮🇹 Italy | 0.9% | 0.7% |
| G7 | 🇬🇧 UK | 0.1% | 0.5% |
| G7 | 🇩🇪 Germany | -0.3% | 0.2% |
| BRICS | 🇮🇳 India | 7.8% | 6.8% |
| BRICS | 🇨🇳 China | 5.2% | 4.6% |
| BRICS | 🇦🇪 UAE | 3.4% | 3.5% |
| BRICS | 🇮🇷 Iran | 4.7% | 3.3% |
| BRICS | 🇷🇺 Russia | 3.6% | 3.2% |
| BRICS | 🇪🇬 Egypt | 3.8% | 3.0% |
| BRICS-invited | 🇸🇦 Saudi Arabia | -0.8% | 2.6% |
| BRICS | 🇧🇷 Brazil | 2.9% | 2.2% |
| BRICS | 🇿🇦 South Africa | 0.6% | 0.9% |
| BRICS | 🇪🇹 Ethiopia | 7.2% | 6.2% |
| 🌍 World | 3.2% | 3.2% |
China and India are forecasted to maintain relatively high growth rates in 2024 at 4.6% and 6.8% respectively, but compared to the previous year, China is growing 0.6 percentage points slower while India is an entire percentage point slower.
On the other hand, four G7 nations are set to grow faster than last year, which includes Germany making its comeback from its negative real GDP growth of -0.3% in 2023.
Faster Growth for BRICS than G7 Nations
Despite mostly lower growth forecasts in 2024 compared to 2023, BRICS nations still have a significantly higher average growth forecast at 3.6% compared to the G7 average of 1%.
While the G7 countries’ combined GDP is around $15 trillion greater than the BRICS nations, with continued higher growth rates and the potential to add more members, BRICS looks likely to overtake the G7 in economic size within two decades.
BRICS Expansion Stutters Before October 2024 Summit
BRICS’ recent expansion has stuttered slightly, as Argentina’s newly-elected president Javier Milei declined its invitation and Saudi Arabia clarified that the country is still considering its invitation and has not joined BRICS yet.
Even with these initial growing pains, South Africa’s Foreign Minister Naledi Pandor told reporters in February that 34 different countries have submitted applications to join the growing BRICS bloc.
Any changes to the group are likely to be announced leading up to or at the 2024 BRICS summit which takes place October 22-24 in Kazan, Russia.
Get the Full Analysis of the IMF’s Outlook on VC+
This visual is part of an exclusive special dispatch for VC+ members which breaks down the key takeaways from the IMF’s 2024 World Economic Outlook.
For the full set of charts and analysis, sign up for VC+.

-

 Markets1 week ago
U.S. Debt Interest Payments Reach $1 Trillion
-

 Business2 weeks ago
Charted: Big Four Market Share by S&P 500 Audits
-

 Markets2 weeks ago
Ranked: The Most Valuable Housing Markets in America
-

 Money2 weeks ago
Which States Have the Highest Minimum Wage in America?
-

 AI2 weeks ago
Ranked: Semiconductor Companies by Industry Revenue Share
-

 Markets2 weeks ago
Ranked: The World’s Top Flight Routes, by Revenue
-

 Countries2 weeks ago
Population Projections: The World’s 6 Largest Countries in 2075
-

 Markets2 weeks ago
The Top 10 States by Real GDP Growth in 2023