Agriculture
Mapped: The Anatomy of Land Use in America
Mapped: The Anatomy of Land Use in America
The United States is not just an economic and political giant on the global stage—the country also has one of the largest land masses at its disposal.
Altogether, the country spans 3.8 million square miles (9.8 million km²)—making it the third largest country in the world. Even without factoring Alaska and Hawaii into the calculations, the contiguous U.S. land mass can fit up to 30 European countries within it.
With this much ground to work with, it raises the natural question of how land actually gets used by America’s economy. For example, what percentage of land is taken up by urban areas, and how much farmland and forests exist in comparison?
Today’s maps from the McHarg Center put America’s wide variety of land uses into perspective.
The Components of U.S. Land Use
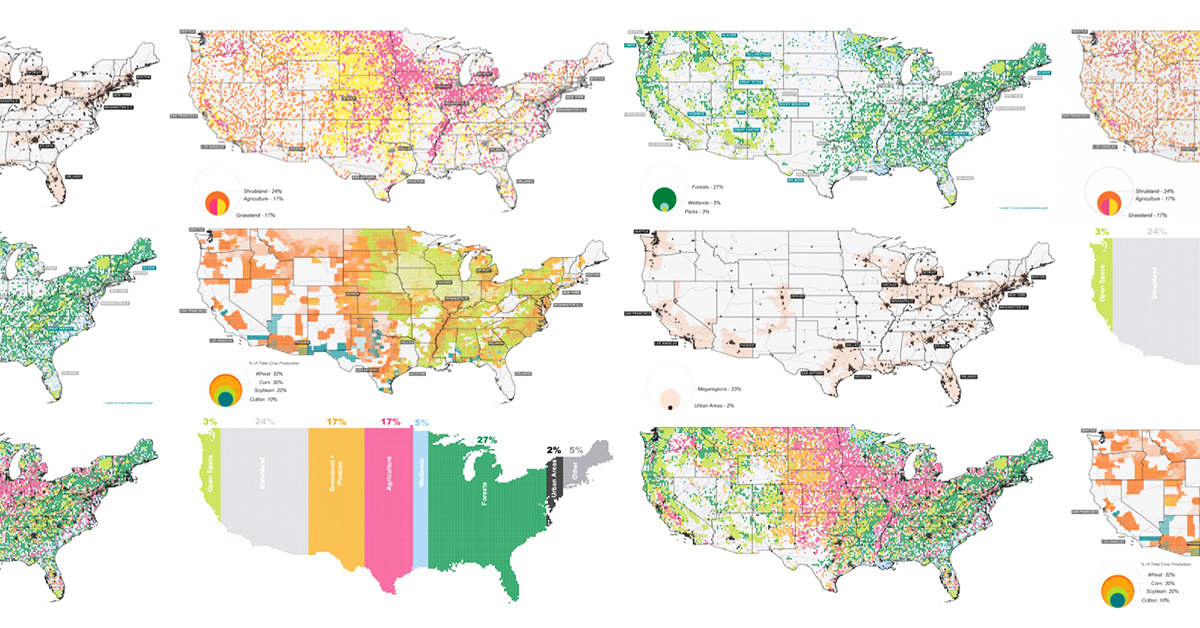
As the U.S. prepares to add 100 million more people this century, the “2100 Project: An Atlas for the Green New Deal” provides a snapshot of U.S. land use (as of 2017), aimed at managing resources to support this future.
According to this data, here is a snapshot of land use in the Lower 48 States:
| Land type | Land use (%) | Land area |
|---|---|---|
| Forests | 27% | 842,400 mi² |
| Shrubland | 24% | 748,800 mi² |
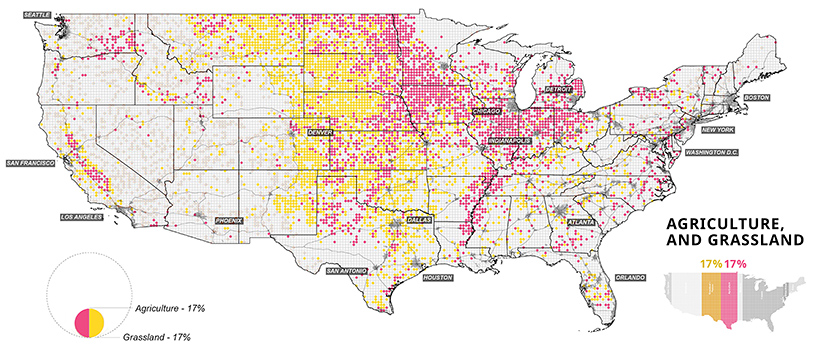
| Agriculture | 17% | 530,400 mi² |
| Grasslands and Pasture | 17% | 530,400 mi² |
| Wetlands | 5% | 156,000 mi² |
| Other | 5% | 156,000 mi² |
| Open Space | 3% | 93,600 mi² |
| Urban Areas | 2% | 63,400 mi² |
| Total | 100% | 3,120,000 mi² |
Let’s dive into the specifics of three types of land: urban areas, forests, and agriculture.
Small But Mighty: U.S. Urban Areas
It’s clear that even a little space goes a long way. Although urban areas take up only 2% of land, an overwhelming majority of Americans call cities their home. As of 2018, urbanites made up over 82% of the U.S. population.
Where people go, productivity often follows. In 2018, it’s estimated that 31 county economies made up a whopping 32% of national GDP. Most of these counties were located in and around major cities, such as Los Angeles or New York.
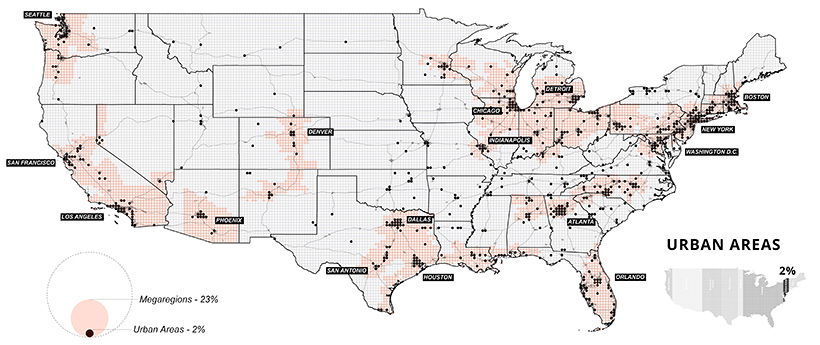
Although urban areas are a small part of the overall land they’re built on, they’re integral to the nation’s continued growth. According to research by the McKinsey Global Institute, it’s estimated that by 2030, 60% of job growth could come from just 25 hubs.
Seeing Green: America’s Vast Forests
On the flipside, forests account for over a quarter of land in the U.S., divided almost evenly between deciduous and evergreen trees. Many protected national and state parks can also be found in and around forests.

On the mainland, California and Oregon are the states with the most forested land—unfortunately, they have also been plagued by wildfires in recent, dry summer months.
Wetlands are also included in the map above, particularly around the southern tip of Florida, where Everglades National Park is located. Over the years, many wetlands were drained to make way for agriculture, particularly in the Great Lakes megaregion. As a result, it’s estimated that their area today is only half of what they once used to be.
Home Grown: Agriculture in the U.S.
Last but not least, the final set of maps show where America grows its food. Agricultural, food, and related industries contributed $1.05 trillion (5.4%) to U.S. GDP in 2017.
Wheat, corn, and soybeans are the major crops grown in the U.S.—and cotton also makes the cut as a profitable non-food crop. Much of these crops feed not only Americans, but other parts of the world too. Soybeans, corn, and wheat are exported across the Pacific mainly to China and Japan.
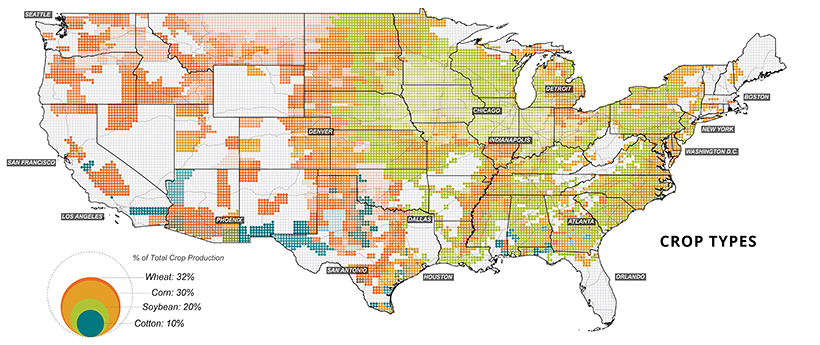
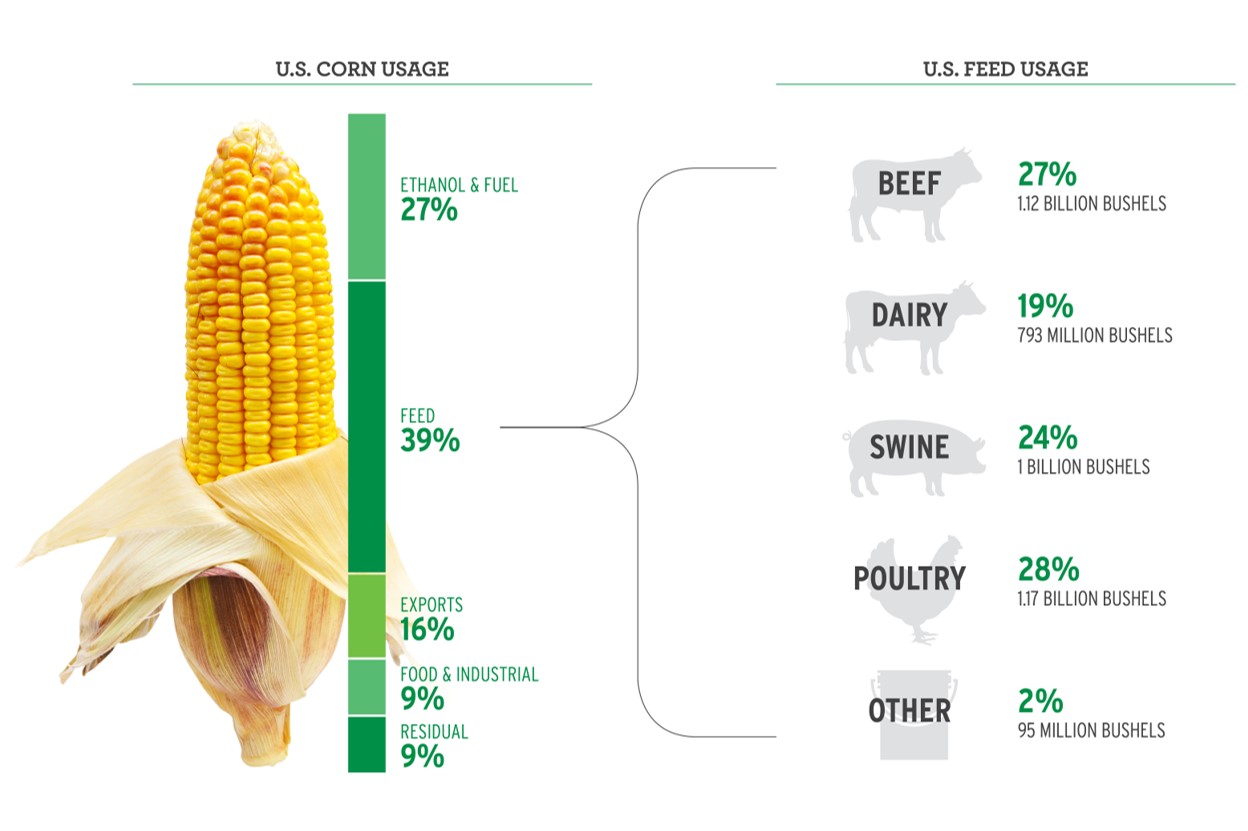
Corn, in particular, is a unique crop with a myriad of uses, from food to fuels. Up to 40% of U.S. corn is turned into livestock feed, with cows consuming over half (56%) of this amount.
At present, the U.S. is the world’s largest beef producer, followed by Brazil. In fact, beef production takes up 40% of total livestock-related land use domestically.
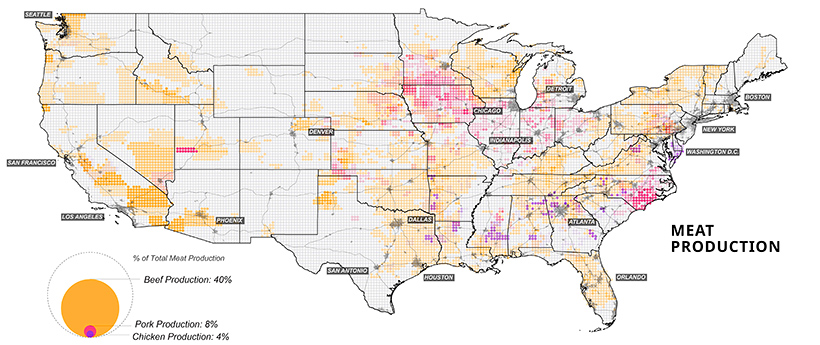
Although fewer American consumers are opting for meat in their diets, production has remained at high rates. Further, as incomes continues to increase worldwide, the global appetite for meat is set to rise along with it.
Future Land Use
The U.S. population is set to grow by 100 million more people over the coming decades, raising the pressure on limited U.S. land and natural resources. This pressure will be felt everywhere, from dense urban land to agricultural farmland.
How the land gets utilized will shape the country’s future for years to come.


Markets
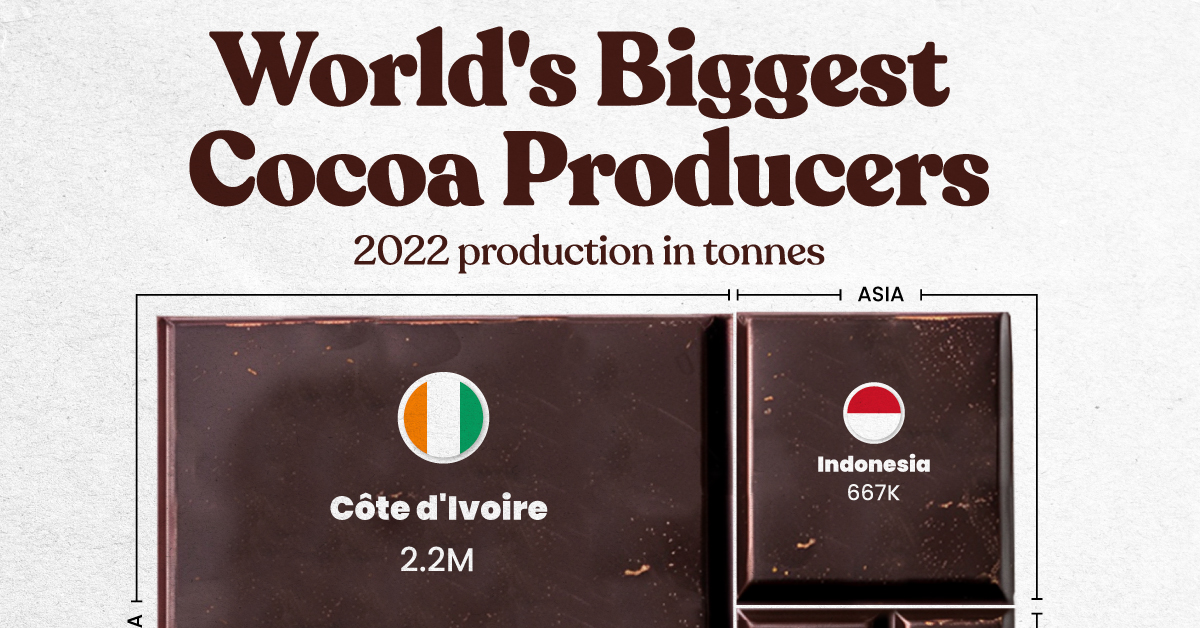
The World’s Top Cocoa Producing Countries
Here are the largest cocoa producing countries globally—from Côte d’Ivoire to Brazil—as cocoa prices hit record highs.
The World’s Top Cocoa Producing Countries
This was originally posted on our Voronoi app. Download the app for free on iOS or Android and discover incredible data-driven charts from a variety of trusted sources.
West Africa is home to the largest cocoa producing countries worldwide, with 3.9 million tonnes of production in 2022.
In fact, there are about one million farmers in Côte d’Ivoire supplying cocoa to key customers such as Nestlé, Mars, and Hershey. But the massive influence of this industry has led to significant forest loss to plant cocoa trees.
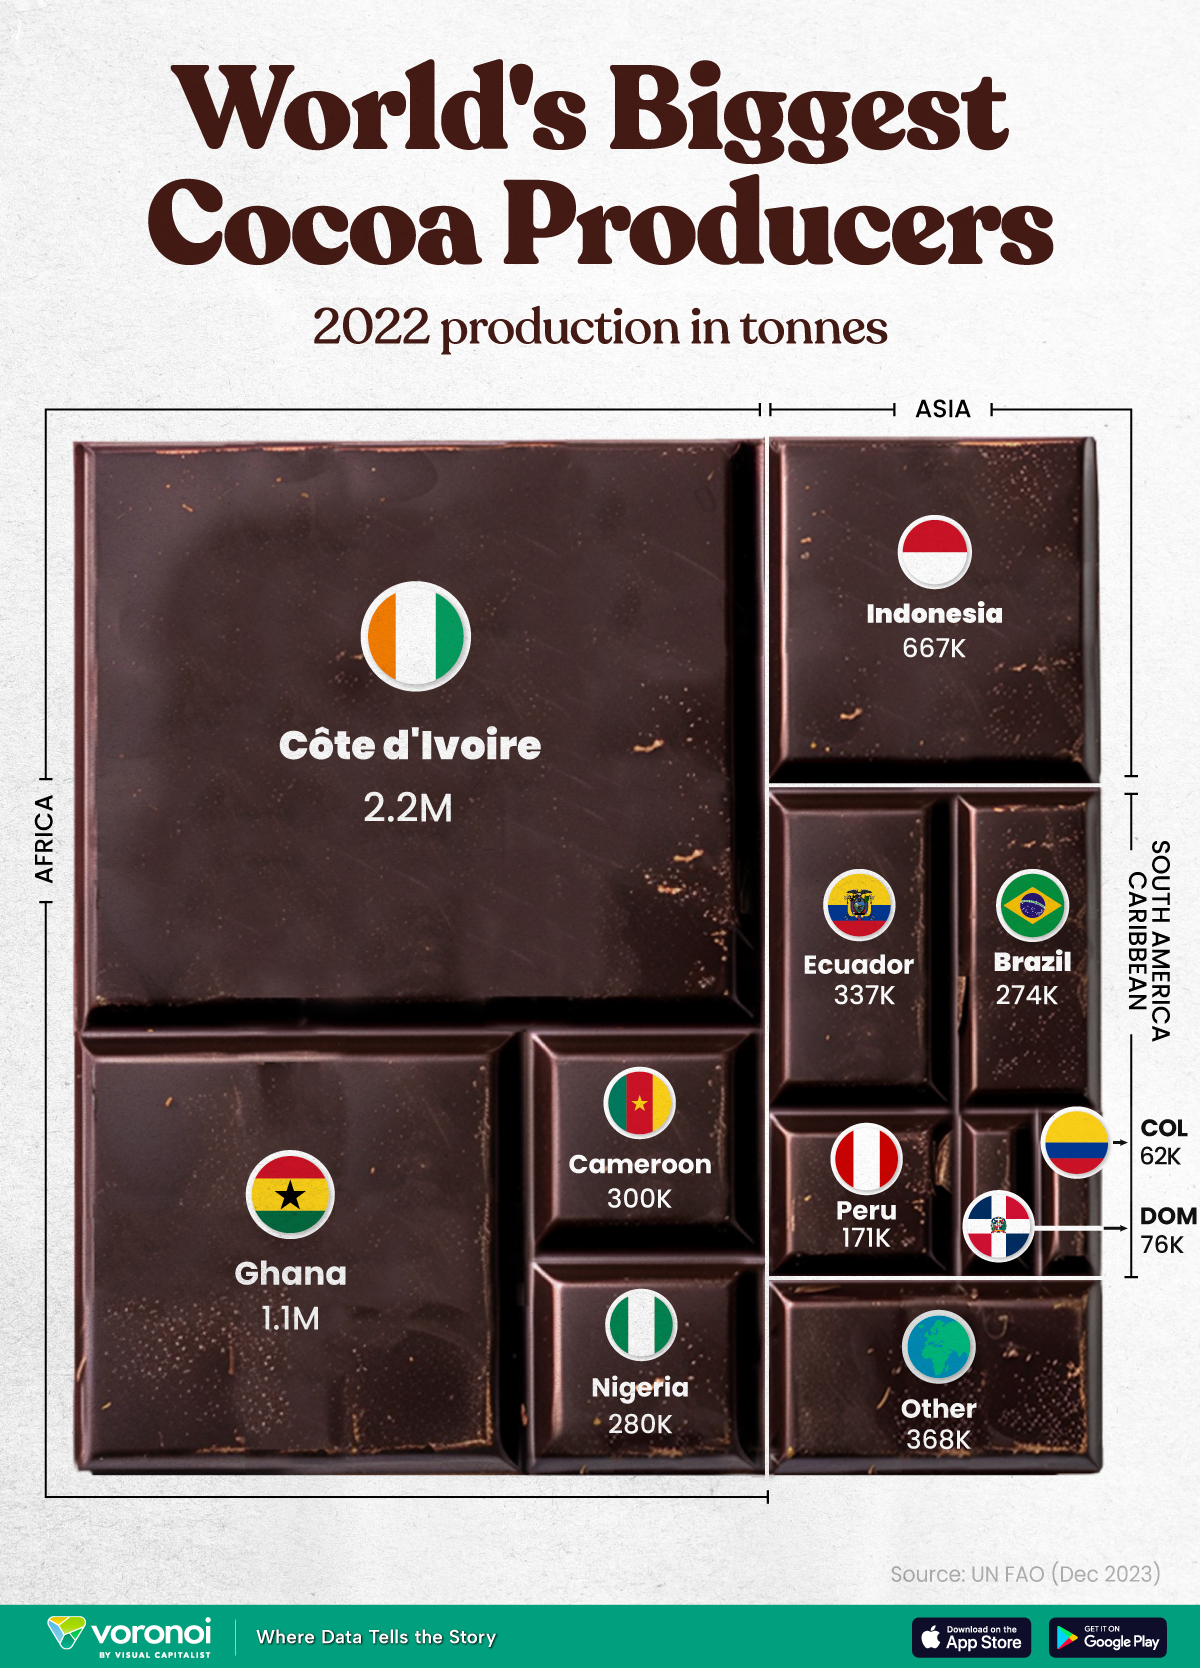
This graphic shows the leading producers of cocoa, based on data from the UN FAO.
Global Hotspots for Cocoa Production
Below, we break down the top cocoa producing countries as of 2022:
| Country | 2022 Production, Tonnes |
|---|---|
| 🇨🇮 Côte d'Ivoire | 2.2M |
| 🇬🇭 Ghana | 1.1M |
| 🇮🇩 Indonesia | 667K |
| 🇪🇨 Ecuador | 337K |
| 🇨🇲 Cameroon | 300K |
| 🇳🇬 Nigeria | 280K |
| 🇧🇷 Brazil | 274K |
| 🇵🇪 Peru | 171K |
| 🇩🇴 Dominican Republic | 76K |
| 🌍 Other | 386K |
With 2.2 million tonnes of cocoa in 2022, Côte d’Ivoire is the world’s largest producer, accounting for a third of the global total.
For many reasons, the cocoa trade in Côte d’Ivoire and Western Africa has been controversial. Often, farmers make about 5% of the retail price of a chocolate bar, and earn $1.20 each day. Adding to this, roughly a third of cocoa farms operate on forests that are meant to be protected.
As the third largest producer, Indonesia produced 667,000 tonnes of cocoa with the U.S., Malaysia, and Singapore as major importers. Overall, small-scale farmers produce 95% of cocoa in the country, but face several challenges such as low pay and unwanted impacts from climate change. Alongside aging trees in the country, these setbacks have led productivity to decline.
In South America, major producers include Ecuador and Brazil. In the early 1900s, Ecuador was the world’s largest cocoa producing country, however shifts in the global marketplace and crop disease led its position to fall. Today, the country is most known for its high-grade single-origin chocolate, with farms seen across the Amazon rainforest.
Altogether, global cocoa production reached 6.5 million tonnes, supported by strong demand. On average, the market has grown 3% annually over the last several decades.

-

 Energy1 week ago
The World’s Biggest Nuclear Energy Producers
-

 Money2 weeks ago
Which States Have the Highest Minimum Wage in America?
-

 Technology2 weeks ago
Ranked: Semiconductor Companies by Industry Revenue Share
-

 Markets2 weeks ago
Ranked: The World’s Top Flight Routes, by Revenue
-

 Demographics2 weeks ago
Population Projections: The World’s 6 Largest Countries in 2075
-

 Markets2 weeks ago
The Top 10 States by Real GDP Growth in 2023
-

 Demographics2 weeks ago
The Smallest Gender Wage Gaps in OECD Countries
-

 Economy2 weeks ago
Where U.S. Inflation Hit the Hardest in March 2024