Energy
All the World’s Coal Power Plants in One Map
All The World’s Coal Power Plants in One Map
The use of coal for fuel dates back thousands of years.
Demand for the energy source really started to soar during the Industrial Revolution, and it continues to power some of the world’s largest economies today. However, as the clean energy revolution heats up, will coal continue to be a viable option?
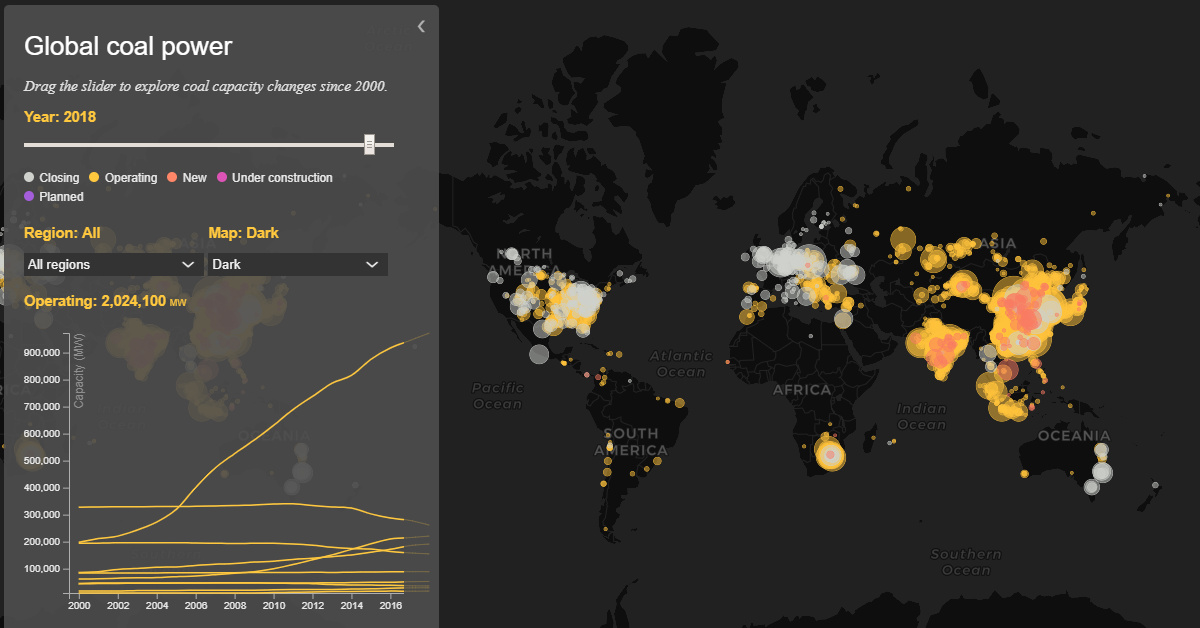
Today’s data visualization from Carbon Brief maps the changing number of global coal power plants operating between 2000 and 2018. The interactive timeline pulls from the Global Coal Plant Tracker’s latest data and features around 10,000 retired, operating, and planned coal units, totaling close to 3,000 gigawatts (GW) of capacity across 95 countries.
On the map, each circular icon’s size represents each plant’s coal capacity in megawatts (MW). The data also highlights the type of coal burned and the CO₂ emissions produced as a result.
A Precarious Power Source
Throughout its history, coal has been used for everything from domestic heating and steel manufacturing, to railways, gas works, and electricity. The fuel played a pivotal role in powering economic development, and had a promising future with a flurry of plant openings.
However, in 2016, coal output dropped by 231 million tons of oil equivalent (Mtoe). Combined with a rapid slowdown of new plants being built, total coal units operating around the world fell for the first time in 2018.
With the remaining fleet of plants operating fewer hours than ever, plant closures have been triggered in South Africa, India, and China—steadily eroding coal’s bottom line. Industry trends have also forced a wave of coal companies to recently declare bankruptcy, including giants such as Peabody Energy and Alpha Natural.
Can Coal Compete with Clean Energy?
Today, coal is experiencing fierce competition from low-priced natural gas and ever-cheaper renewable power—most notably from wind and solar. Further, solar power costs will continue to decline each year and be cut in half by 2020, relative to 2015 figures.
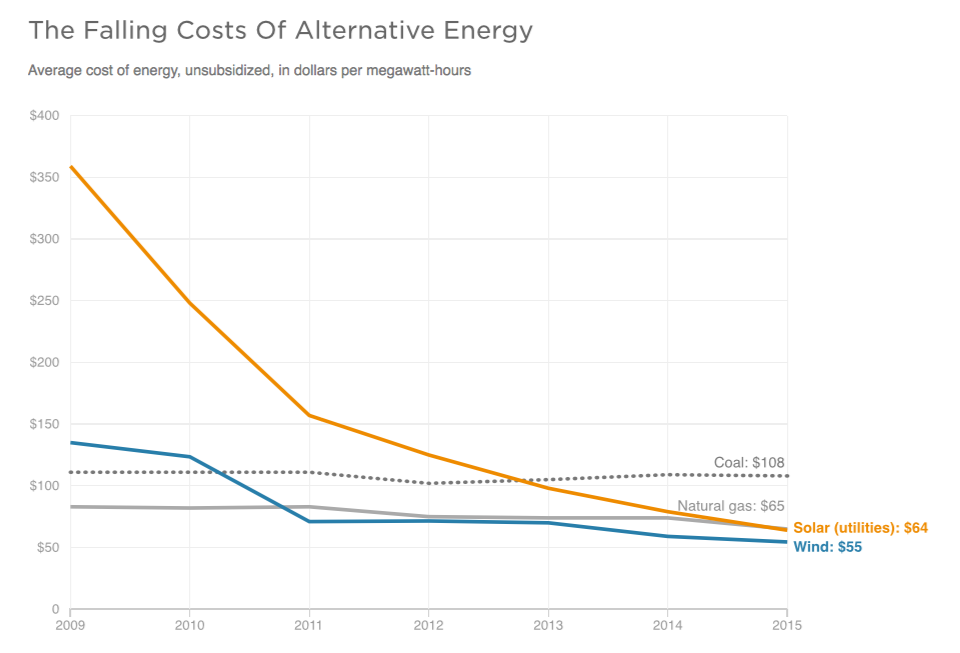
Source: Lazard
Natural gas surpassed coal as America’s #1 power source in 2016, with the total share of power generated from coal tumbling from 45% in 2010 to 28% in 2018. By next year, the role of coal is expected to be further reduced to 24% of the mix.
On the interactive visualization, the decline of coal is especially evident in 2018 as plant closures sweep across the map. The chart shows how several countries, notably China and India, have been closing many hundreds of smaller, older, and less efficient units, but replacing them with larger and more efficient models.
As of today, China retains the largest fleet of coal plants, consuming a staggering 45% of the world’s coal.
Use the above slider to see the difference between China’s coal plants in 2000 with projected future capacity.
Towards a New Reality
Coal is the most carbon intensive fossil fuel, and for every tonne of coal burned there are approximately 2.5 tonnes of carbon emissions. The International Energy Agency states that all unabated coal must be phased out within a few decades if global warming is to be limited.
Despite these warnings, global coal demand is set to remain stable for the next five years, with declines in the U.S. and Europe offset by immediate growth in India and China. The latter are the main players in the global coal market, but will eventually see a gradual decline in demand as they move away from industrialization.
A total phaseout of unabated coal is planned by 14 of the world’s 78 coal-powered countries, with many of these countries working to convert coal capacity to natural gas.
As the price of premium solar generation drops steadily, and innovation in renewable energy technology becomes more prominent, the world is shifting its attention to a clean energy economy. A global revival of coal looks less and less likely—and the fossil fuel might very well one day become obsolete.
Editor’s Note: The map uses WebGL and will not work on some older browsers. The map may also fail to load if you are using an ad-blocking browser plugin.


Energy
Charted: 4 Reasons Why Lithium Could Be the Next Gold Rush
Visual Capitalist has partnered with EnergyX to show why drops in prices and growing demand may make now the right time to invest in lithium.


4 Reasons Why You Should Invest in Lithium
Lithium’s importance in powering EVs makes it a linchpin of the clean energy transition and one of the world’s most precious minerals.
In this graphic, Visual Capitalist partnered with EnergyX to explore why now may be the time to invest in lithium.
1. Lithium Prices Have Dropped
One of the most critical aspects of evaluating an investment is ensuring that the asset’s value is higher than its price would indicate. Lithium is integral to powering EVs, and, prices have fallen fast over the last year:
| Date | LiOH·H₂O* | Li₂CO₃** |
|---|---|---|
| Feb 2023 | $76 | $71 |
| March 2023 | $71 | $61 |
| Apr 2023 | $43 | $33 |
| May 2023 | $43 | $33 |
| June 2023 | $47 | $45 |
| July 2023 | $44 | $40 |
| Aug 2023 | $35 | $35 |
| Sept 2023 | $28 | $27 |
| Oct 2023 | $24 | $23 |
| Nov 2023 | $21 | $21 |
| Dec 2023 | $17 | $16 |
| Jan 2024 | $14 | $15 |
| Feb 2024 | $13 | $14 |
Note: Monthly spot prices were taken as close to the 14th of each month as possible.
*Lithium hydroxide monohydrate MB-LI-0033
**Lithium carbonate MB-LI-0029
2. Lithium-Ion Battery Prices Are Also Falling
The drop in lithium prices is just one reason to invest in the metal. Increasing economies of scale, coupled with low commodity prices, have caused the cost of lithium-ion batteries to drop significantly as well.
In fact, BNEF reports that between 2013 and 2023, the price of a Li-ion battery dropped by 82%.
| Year | Price per KWh |
|---|---|
| 2023 | $139 |
| 2022 | $161 |
| 2021 | $150 |
| 2020 | $160 |
| 2019 | $183 |
| 2018 | $211 |
| 2017 | $258 |
| 2016 | $345 |
| 2015 | $448 |
| 2014 | $692 |
| 2013 | $780 |

3. EV Adoption is Sustainable
One of the best reasons to invest in lithium is that EVs, one of the main drivers behind the demand for lithium, have reached a price point similar to that of traditional vehicle.
According to the Kelly Blue Book, Tesla’s average transaction price dropped by 25% between 2022 and 2023, bringing it in line with many other major manufacturers and showing that EVs are a realistic transport option from a consumer price perspective.
| Manufacturer | September 2022 | September 2023 |
|---|---|---|
| BMW | $69,000 | $72,000 |
| Ford | $54,000 | $56,000 |
| Volkswagon | $54,000 | $56,000 |
| General Motors | $52,000 | $53,000 |
| Tesla | $68,000 | $51,000 |
4. Electricity Demand in Transport is Growing
As EVs become an accessible transport option, there’s an investment opportunity in lithium. But possibly the best reason to invest in lithium is that the IEA reports global demand for the electricity in transport could grow dramatically by 2030:
| Transport Type | 2022 | 2025 | 2030 |
|---|---|---|---|
| Buses 🚌 | 23,000 GWh | 50,000 GWh | 130,000 GWh |
| Cars 🚙 | 65,000 GWh | 200,000 GWh | 570,000 GWh |
| Trucks 🛻 | 4,000 GWh | 15,000 GWh | 94,000 GWh |
| Vans 🚐 | 6,000 GWh | 16,000 GWh | 72,000 GWh |
The Lithium Investment Opportunity
Lithium presents a potentially classic investment opportunity. Lithium and battery prices have dropped significantly, and recently, EVs have reached a price point similar to other vehicles. By 2030, the demand for clean energy, especially in transport, will grow dramatically.
With prices dropping and demand skyrocketing, now is the time to invest in lithium.
EnergyX is poised to exploit lithium demand with cutting-edge lithium extraction technology capable of extracting 300% more lithium than current processes.

-

 Lithium3 days ago
Ranked: The Top 10 EV Battery Manufacturers in 2023
Asia dominates this ranking of the world’s largest EV battery manufacturers in 2023.
-

 Energy1 week ago
The World’s Biggest Nuclear Energy Producers
China has grown its nuclear capacity over the last decade, now ranking second on the list of top nuclear energy producers.
-

 Energy4 weeks ago
The World’s Biggest Oil Producers in 2023
Just three countries accounted for 40% of global oil production last year.
-

 Energy1 month ago
How Much Does the U.S. Depend on Russian Uranium?
Currently, Russia is the largest foreign supplier of nuclear power fuel to the U.S.
-

 Uranium2 months ago
Charted: Global Uranium Reserves, by Country
We visualize the distribution of the world’s uranium reserves by country, with 3 countries accounting for more than half of total reserves.
-

 Energy3 months ago
Visualizing the Rise of the U.S. as Top Crude Oil Producer
Over the last decade, the United States has established itself as the world’s top producer of crude oil, surpassing Saudi Arabia and Russia.


-

 Mining1 week ago
Gold vs. S&P 500: Which Has Grown More Over Five Years?
-

 Markets2 weeks ago
Ranked: The Most Valuable Housing Markets in America
-

 Money2 weeks ago
Which States Have the Highest Minimum Wage in America?
-

 AI2 weeks ago
Ranked: Semiconductor Companies by Industry Revenue Share
-

 Markets2 weeks ago
Ranked: The World’s Top Flight Routes, by Revenue
-

 Countries2 weeks ago
Population Projections: The World’s 6 Largest Countries in 2075
-

 Markets2 weeks ago
The Top 10 States by Real GDP Growth in 2023
-

 Demographics2 weeks ago
The Smallest Gender Wage Gaps in OECD Countries