Mining
All the Metals We Mined in One Visualization
![]() Subscribe to the Elements free mailing list for more like this
Subscribe to the Elements free mailing list for more like this
All the Metals We Mined in One Visualization
This was originally posted on Elements. Sign up to the free mailing list to get beautiful visualizations on natural resource megatrends in your email every week.
Metals are a big part of our daily lives, found in every building we enter and all devices we use.
Today, major industries that directly consume processed mineral materials contribute 14% of the United States economy.
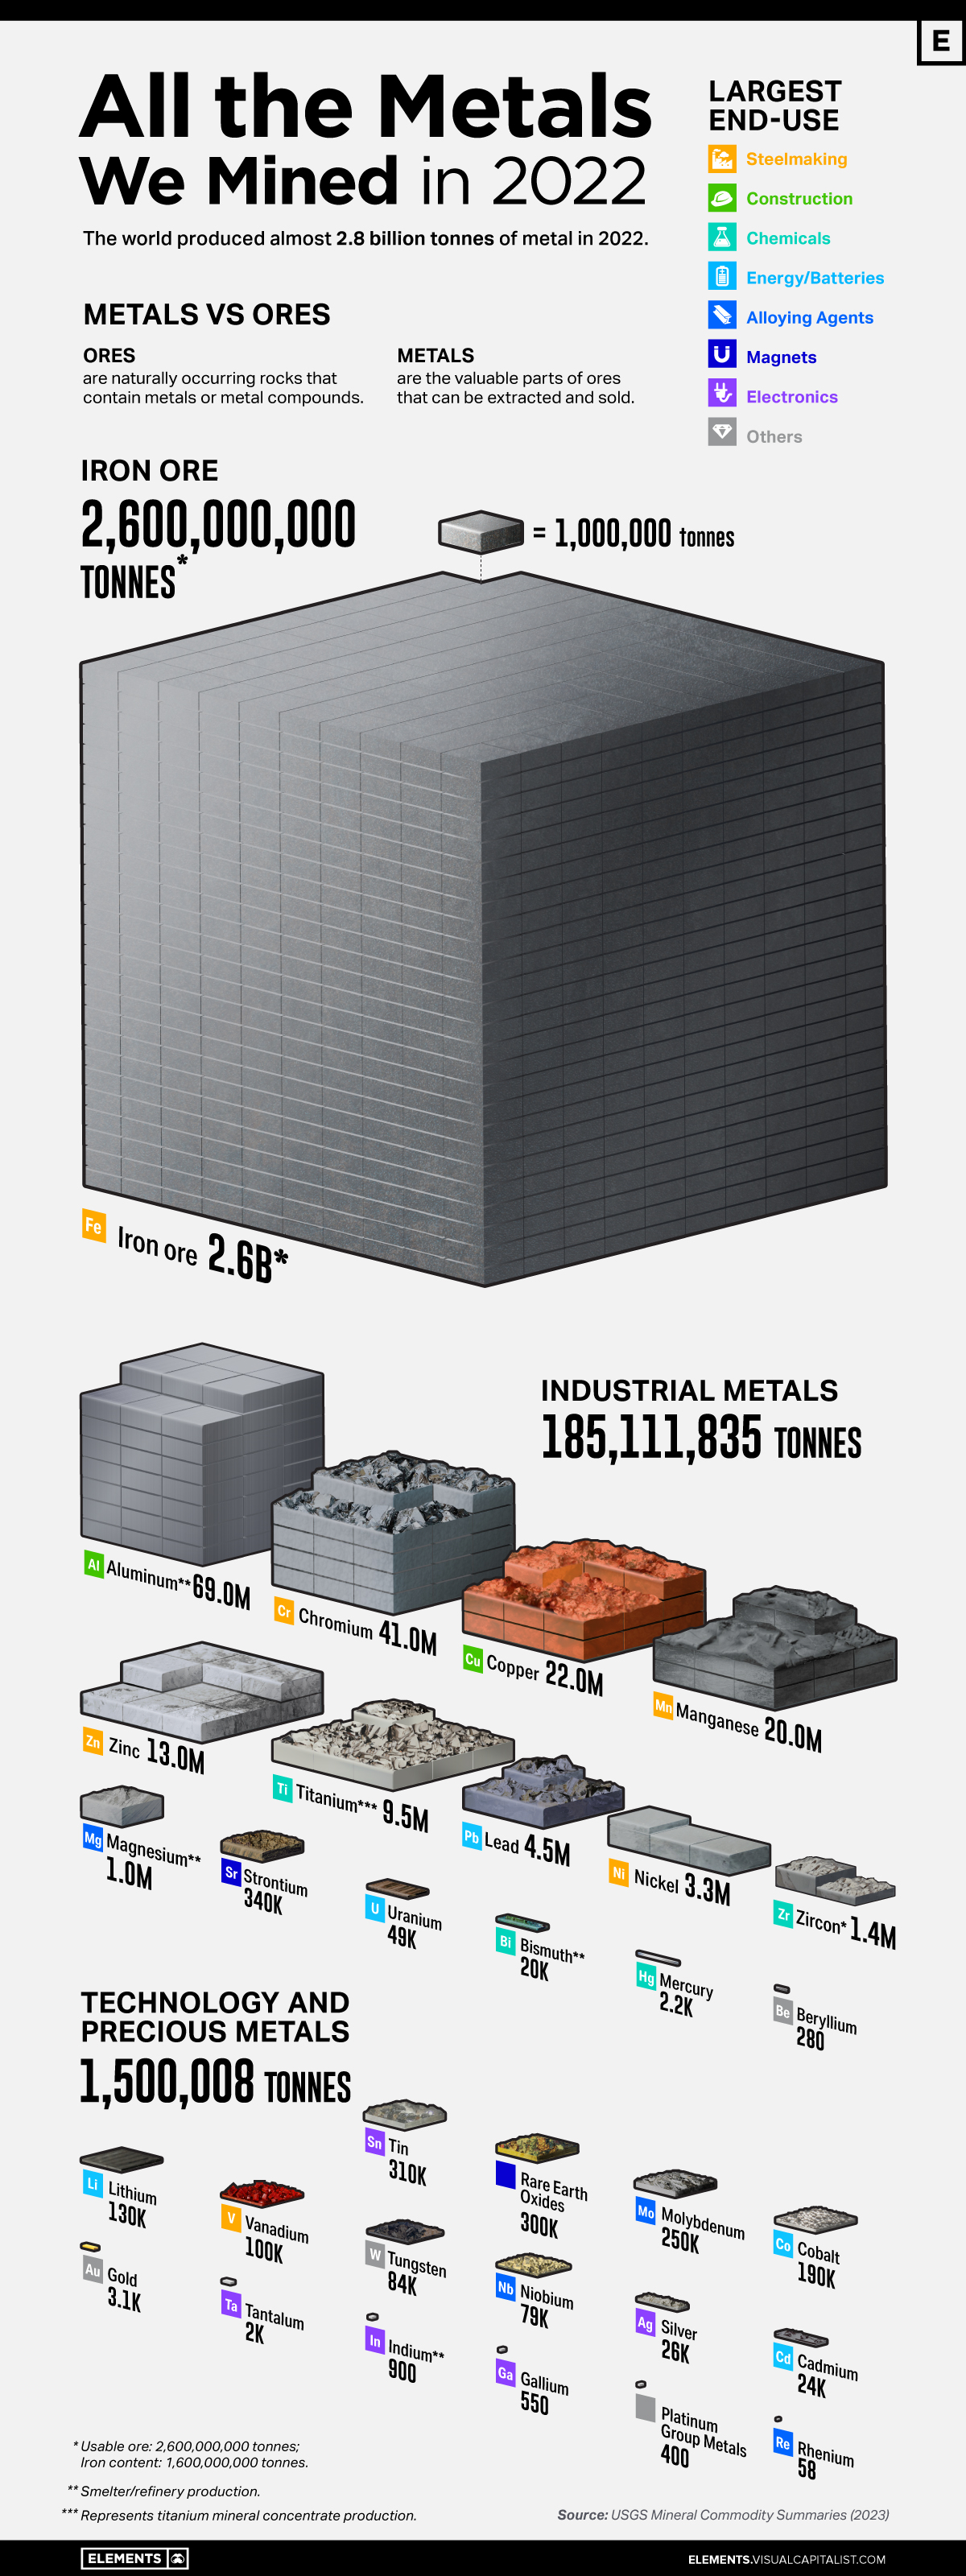
The above infographic visualizes all 2.8 billion tonnes of metals mined in 2022 and highlights each metal’s largest end-use using data from the United States Geological Survey (USGS).
Iron Ore Dominance
Iron ore dominates the metals mining landscape, comprising 93% of the total mined. In 2022, 2.6 billion tonnes of iron ore were mined, containing about 1.6 billion tonnes of iron.
| Metal/Ore | Quantity Mined in 2022 (tonnes) | % of Total |
|---|---|---|
| Iron ore | 2,600,000,000 | 93.3% |
| Industrial metals | 185,111,835 | 6.6% |
| Technology and Precious Metals | 1,500,008 | 0.05% |
| Total | 2,786,611,843 | 100% |
Percentages may not add up to 100 due to rounding.
Iron ores are found in various geologic environments, such as igneous, metamorphic, or sedimentary rocks, and can contain over 70% iron, with many falling in the 50-60% range.
Combined with other materials like coke and limestone, iron ore is primarily used in steel production. Today, almost all (98%) iron ore is dedicated to steelmaking.
The ore is typically mined in about 50 countries, but Australia, Brazil, China, and India are responsible for 75% of the production.
Because of its essential role in infrastructure development, iron ore is one of the most crucial materials underpinning urbanization and economic growth.
Industrial Metals
Industrial metals occupy the second position on our list, constituting 6.6% of all metals mined in 2022. These metals, including copper, aluminum, lead, and zinc, are employed in construction and industrial applications.
Aluminum constituted nearly 40% of industrial metal production in 2022. China was responsible for 56% of all aluminum produced.
| Industrial Metals | 2022 Mine Production (tonnes) | % of Total |
|---|---|---|
| Aluminum | 69,000,000 | 37.3% |
| Chromium | 41,000,000 | 22.1% |
| Copper | 22,000,000 | 11.9% |
| Manganese | 20,000,000 | 10.8% |
| Zinc | 13,000,000 | 7.0% |
| Titanium (mineral concentrates) | 9,500,000 | 5.1% |
| Lead | 4,500,000 | 2.4% |
| Nickel | 3,300,000 | 1.8% |
| Zirconium Minerals (Zircon) | 1,400,000 | 0.8% |
| Magnesium | 1,000,000 | 0.5% |
| Strontium | 340,000 | 0.2% |
| Uranium | 49,355 | 0.03% |
| Bismuth | 20,000 | 0.01% |
| Mercury | 2,200 | 0.00% |
| Beryllium | 280 | 0.00% |
| Total | 185,111,835 | 100.00% |
In the second position is chromium, which plays a primary role in rendering stainless steel corrosion-resistant. South Africa led chromium production, accounting for 44% of the total mined last year.
Technology and Precious Metals
Despite representing less than 1% of all the metals mined, technology metals have been on the news over the last few years as countries and companies seek these materials to reduce carbon emissions and improve productivity.
| Technology and Precious Metals | 2022 Mine Production (tonnes) | % of Total |
|---|---|---|
| Tin | 310,000 | 20.7% |
| Rare Earth Oxides | 300,000 | 20.0% |
| Molybdenum | 250,000 | 16.7% |
| Cobalt | 190,000 | 12.7% |
| Lithium | 130,000 | 8.7% |
| Vanadium | 100,000 | 6.7% |
| Tungsten | 84,000 | 5.6% |
| Niobium | 79,000 | 5.3% |
| Silver | 26,000 | 1.7% |
| Cadmium | 24,000 | 1.6% |
| Gold | 3,100 | 0.2% |
| Tantalum | 2,000 | 0.1% |
| Indium | 900 | 0.1% |
| Gallium | 550 | 0.04% |
| Platinum Group Metals | 400 | 0.03% |
| Rhenium | 58 | 0.004% |
| Total | 1,500,008 | 100% |
They include lithium and cobalt, used in electric vehicles and battery storage, and rare earths, used in magnets, metal alloys, and electronics. Many of them are considered critical for countries’ security due to their role in clean energy technologies and dependency on other nations to supply domestic demand.
However, despite increasing interest in these metals, they are still behind precious metals such as gold and silver regarding market size.
The gold market, for example, reached $196 billion in 2022, compared to $10.6 billion of the rare earth market.


Mining
Visualizing Global Gold Production in 2023
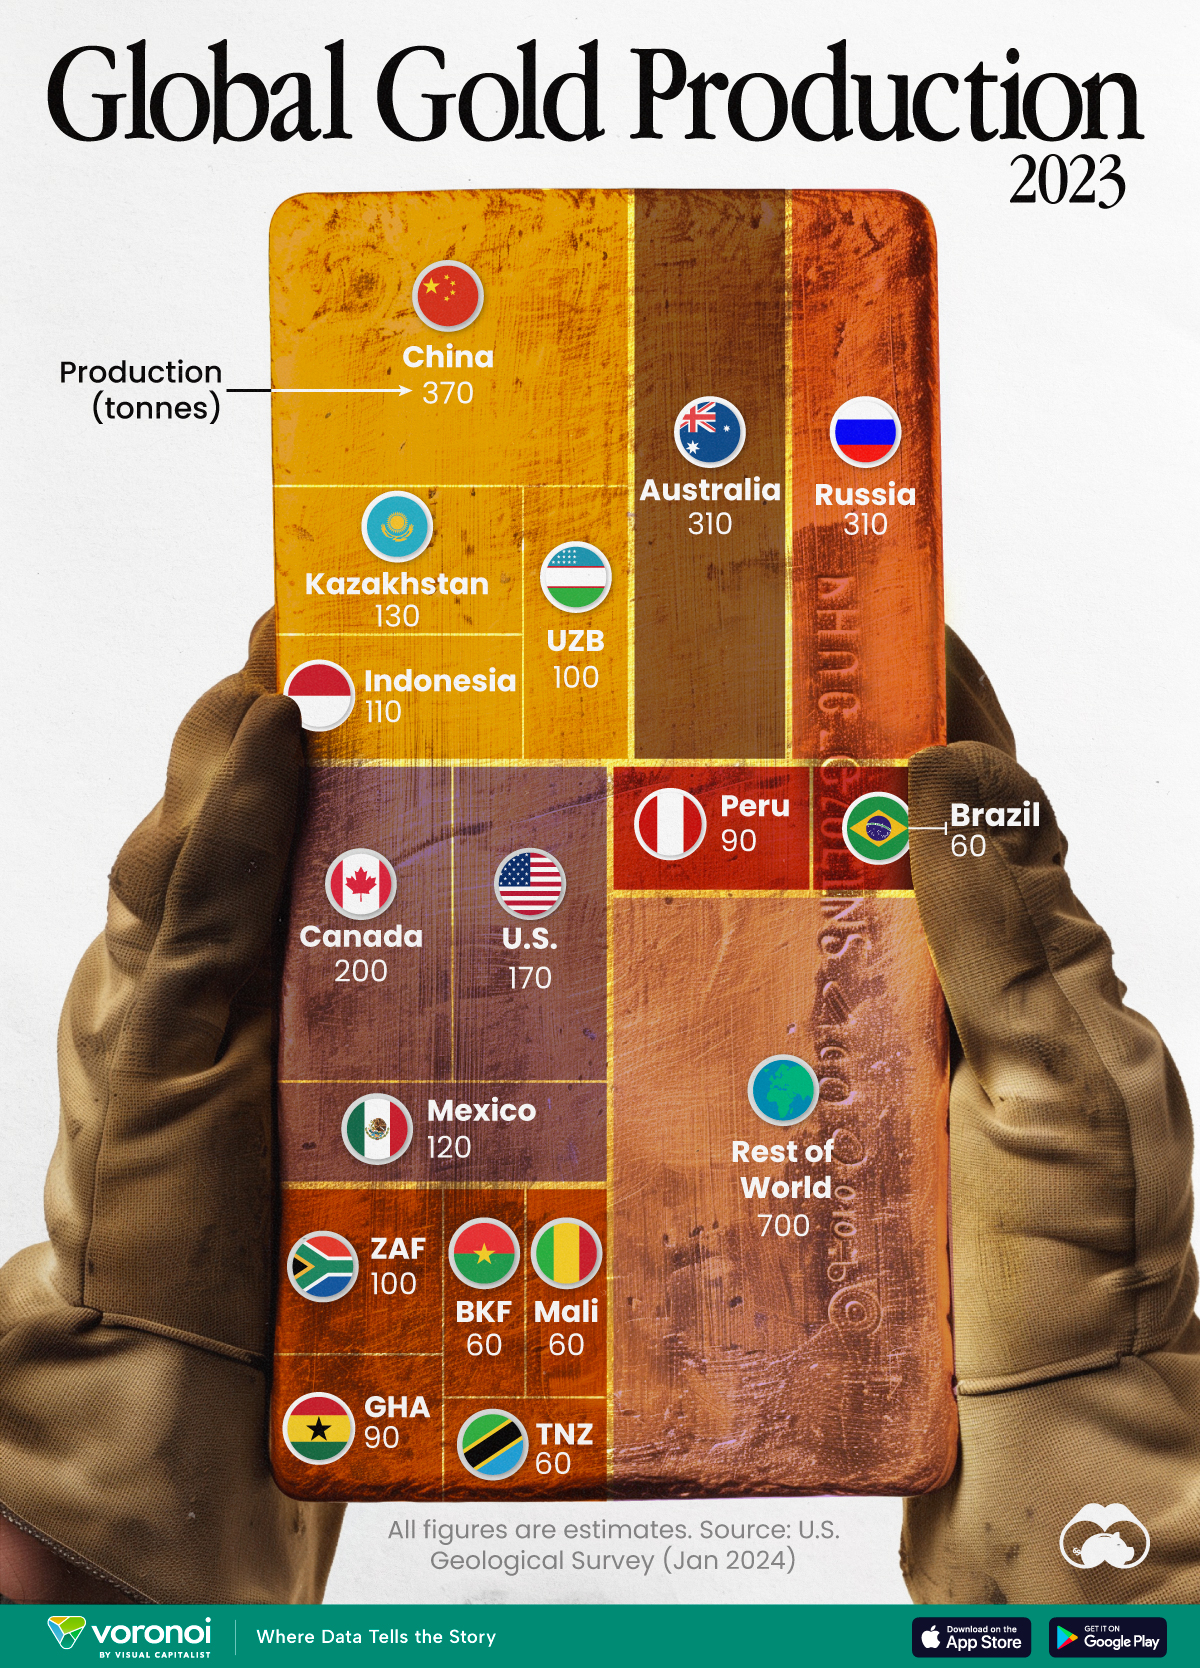
Gold production in 2023 was led by China, Australia, and Russia, with each outputting over 300 tonnes.
Visualizing Global Gold Production in 2023
This was originally posted on our Voronoi app. Download the app for free on iOS or Android and discover incredible data-driven charts from a variety of trusted sources.
Over 3,000 tonnes of gold were produced globally in 2023.
In this graphic, we list the world’s leading countries in terms of gold production. These figures come from the latest USGS publication on gold statistics (published January 2024).
China, Australia, and Russia Produced the Most Gold in 2023
China was the top producer in 2023, responsible for over 12% of total global production, followed by Australia and Russia.
| Country | Region | 2023E Production (tonnes) |
|---|---|---|
| 🇨🇳 China | Asia | 370 |
| 🇦🇺 Australia | Oceania | 310 |
| 🇷🇺 Russia | Europe | 310 |
| 🇨🇦 Canada | North America | 200 |
| 🇺🇸 United States | North America | 170 |
| 🇰🇿 Kazakhstan | Asia | 130 |
| 🇲🇽 Mexico | North America | 120 |
| 🇮🇩 Indonesia | Asia | 110 |
| 🇿🇦 South Africa | Africa | 100 |
| 🇺🇿 Uzbekistan | Asia | 100 |
| 🇬🇭 Ghana | Africa | 90 |
| 🇵🇪 Peru | South America | 90 |
| 🇧🇷 Brazil | South America | 60 |
| 🇧🇫 Burkina Faso | Africa | 60 |
| 🇲🇱 Mali | Africa | 60 |
| 🇹🇿 Tanzania | Africa | 60 |
| 🌍 Rest of World | - | 700 |
Gold mines in China are primarily concentrated in eastern provinces such as Shandong, Henan, Fujian, and Liaoning. As of January 2024, China’s gold mine reserves stand at an estimated 3,000 tonnes, representing around 5% of the global total of 59,000 tonnes.
In addition to being the top producer, China emerged as the largest buyer of the yellow metal for the year. In fact, the country’s central bank alone bought 225 tonnes of gold in 2023, according the World Gold Council.
Estimated Global Gold Consumption
Most of the gold produced in 2023 was used in jewelry production, while another significant portion was sold as a store of value, such as in gold bars or coins.
- Jewelry: 46%
- Central Banks and Institutions: 23%
- Physical Bars: 16%
- Official Coins, Medals, and Imitation Coins: 9%
- Electrical and Electronics: 5%
- Other: 1%
According to Fitch Solutions, over the medium term (2023-2032), global gold mine production is expected to grow 15%, as high prices encourage investment and output.

-

 Culture6 days ago
The World’s Top Media Franchises by All-Time Revenue
-

 Science2 weeks ago
Visualizing the Average Lifespans of Mammals
-

 Brands2 weeks ago
How Tech Logos Have Evolved Over Time
-

 Energy2 weeks ago
Ranked: The Top 10 EV Battery Manufacturers in 2023
-

 Countries2 weeks ago
Countries With the Largest Happiness Gains Since 2010
-

 Economy2 weeks ago
VC+: Get Our Key Takeaways From the IMF’s World Economic Outlook
-

 Demographics1 week ago
The Countries That Have Become Sadder Since 2010
-

 Money1 week ago
Charted: Who Has Savings in This Economy?