Stocks
All of the World’s Trillion-Dollar Companies in One Chart
![]() See this visualization first on the Voronoi app.
See this visualization first on the Voronoi app.
All of the World’s Trillion-Dollar Companies in One Chart
This was originally posted on our Voronoi app. Download the app for free on iOS or Android and discover incredible data-driven charts from a variety of trusted sources.
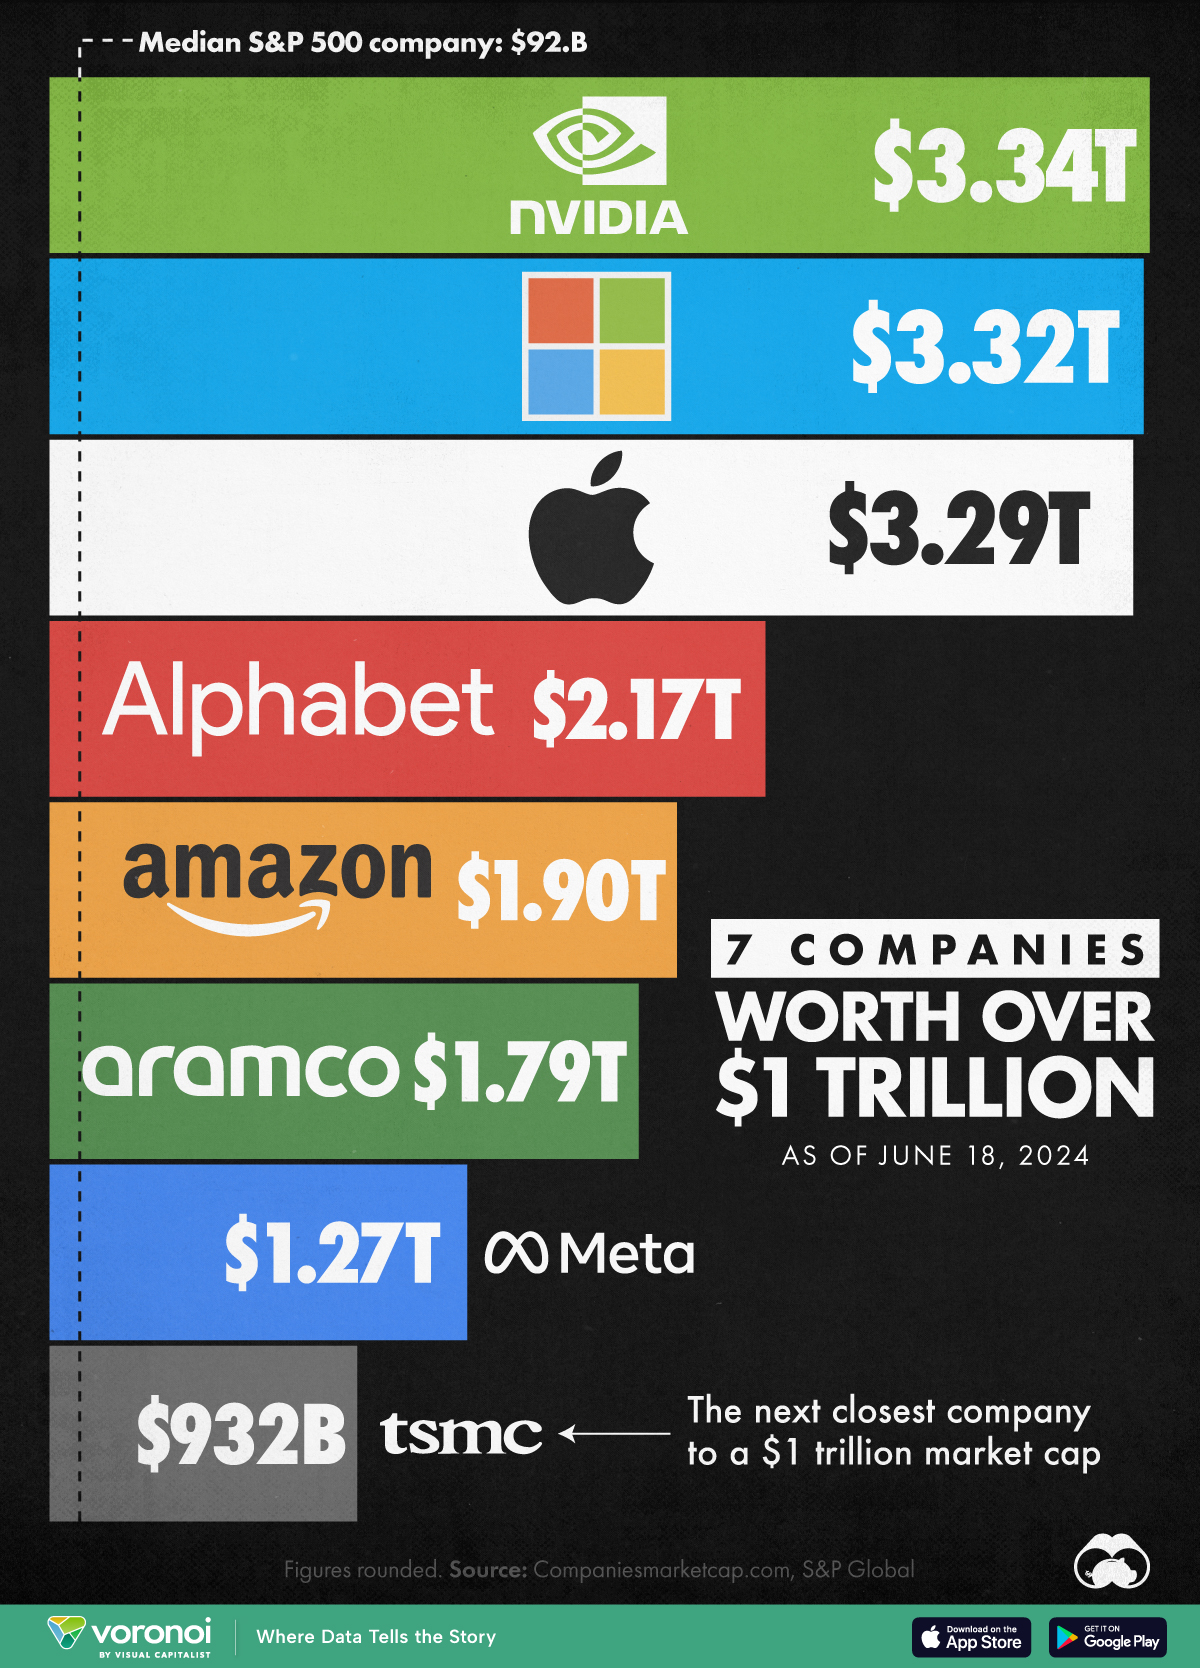
Chipmaker Nvidia is now the world’s most valuable company, which means its time for an update to our frequent “trillion-dollar club” post.
In this graphic, we’ve visualized the market capitalizations of the world’s trillion-dollar companies, as of June 18, 2024. Included for additional context is the market cap of the median S&P 500 firm (as of May 30, 2024), as well as Taiwan’s TSMC, which is the next closest company to reaching the $1 trillion milestone.
Data and Key Takeaways
The figures used to create this graphic are included in the table below. Numbers for each company come from Companiesmarketcap.com, while the median S&P 500 market cap was sourced from S&P Global.
| Company | Market Cap (USD) |
|---|---|
| 🇺🇸 Nvidia | $3.34T |
| 🇺🇸 Microsoft | $3.32T |
| 🇺🇸 Apple | $3.29T |
| 🇺🇸 Alphabet | $2.17T |
| 🇺🇸 Amazon | $1.90T |
| 🇸🇦 Saudi Aramco | $1.79T |
| 🇺🇸 Meta | $1.27T |
| 🇹🇼 TSMC | $932B |
| Median S&P 500 company | $92B |
Here are the key reasons behind each of these companies’ massive valuations:
- Nvidia: Industry leader in data center chips, essential for training artificial intelligence
- Microsoft: Dominance in enterprise software products (e.g. Windows, Office, Azure)
- Apple: Strong track record of innovation and a large, loyal customer base
- Alphabet: Leading player in online advertising and other digital platforms (e.g. Google Search, Youtube)
- Amazon: Dominance in e-commerce and rising cloud computing market share through Amazon Web Services (AWS)
- Saudi Aramco: World’s largest oil producer with massive reserves
- Meta: Dominant player in social media (Facebook, Instagram, Whatsapp)
If you’re interested in learning more, check out our graphic: Visualizing How Big Tech Companies Make Their Billions.
Which Company Will Hit $1 Trillion Next?
As of June 18, there are a few candidates that could soon join the trillion-dollar club, including TSMC ($932B), Berkshire Hathaway ($881B), Eli Lilly ($847B), and Broadcom ($839B).
Most of these stocks have climbed significantly in 2024 so far, with TSMC up 77% since the start of the year, Eli Lilly up 51%, and Broadcom up 66%.


Markets
Charted: Four Decades of U.S. Tech IPOs
From the heydays of the Dotcom boom, the number of tech IPOs has dropped steeply over the years. But 2021 saw a brief resurgence.

Charting Four Decades of U.S. Tech IPOs
This was originally posted on our Voronoi app. Download the app for free on iOS or Android and discover incredible data-driven charts from a variety of trusted sources.
Big technology companies have been enjoying a wave of stock market success, driving much of the growth in the S&P 500 index since the pandemic. Five of the companies currently dubbed the “Magnificent Seven” are behemoths in the tech space, with market capitalizations rivaling the size of entire countries’ GDPs.
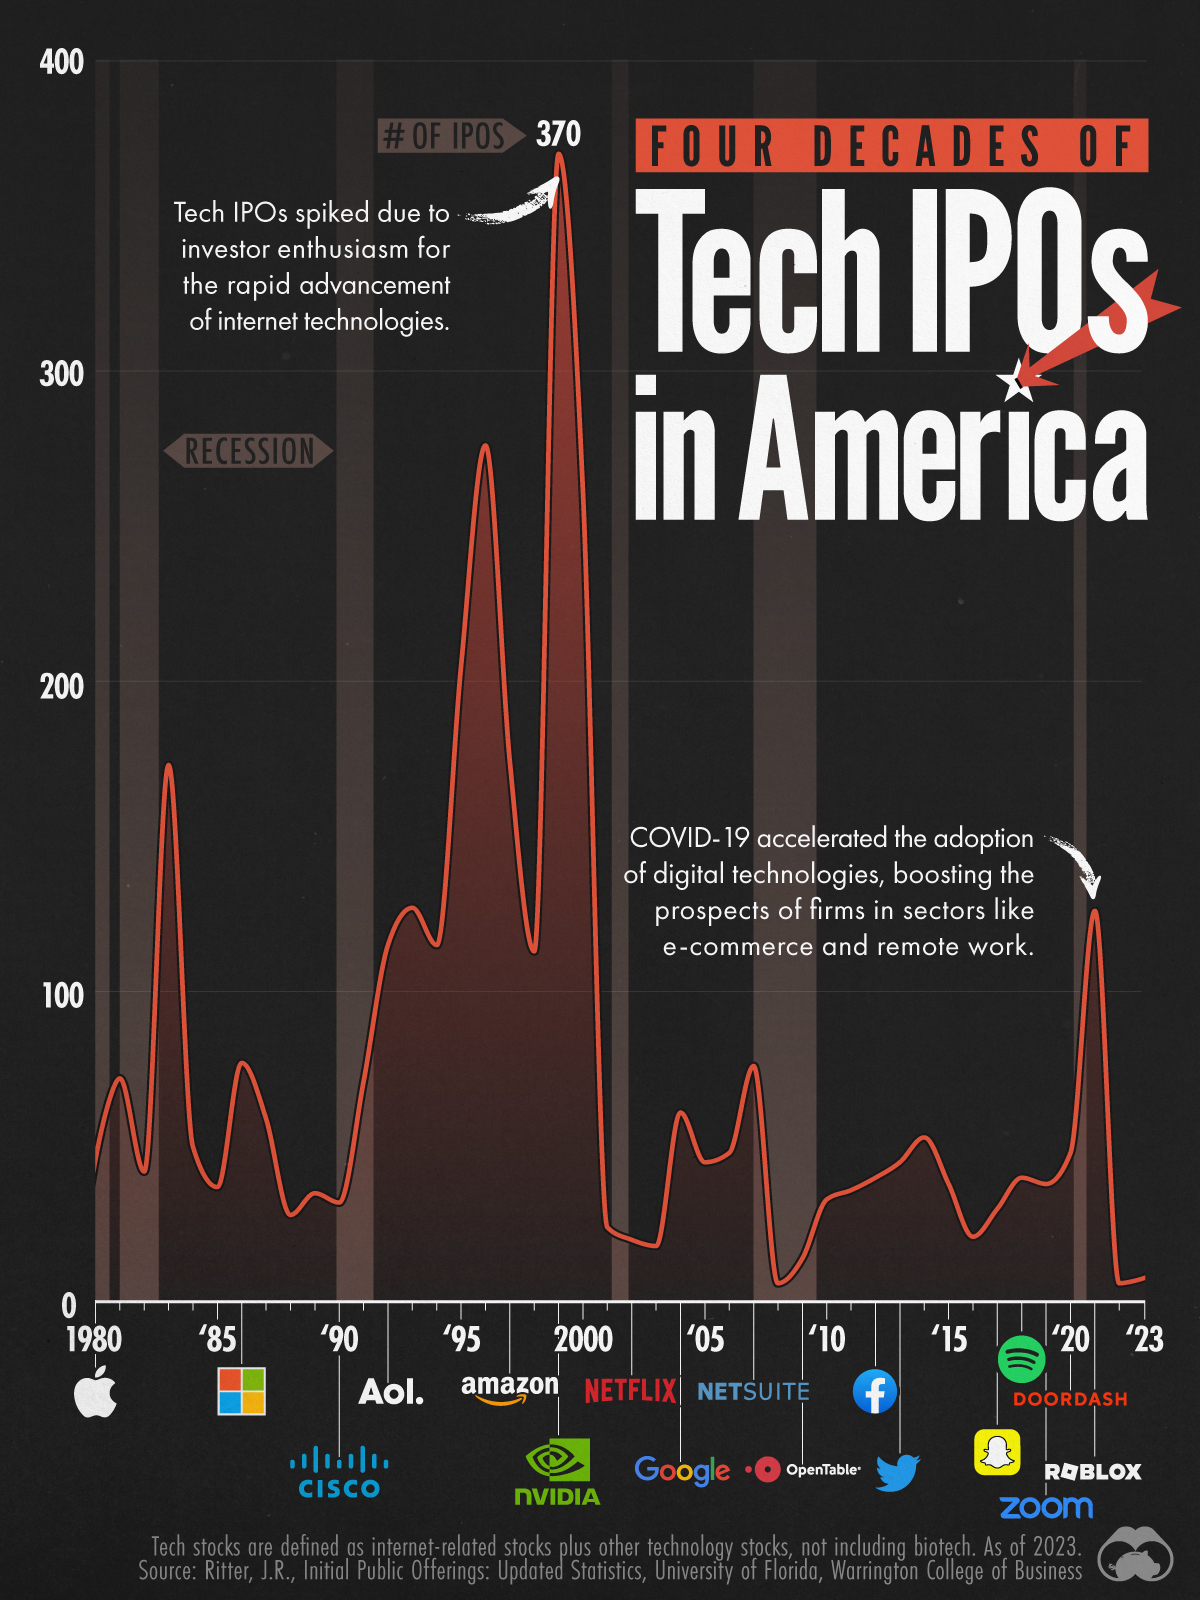
We visualize the number of tech IPOs on American exchanges from 1980–2023. Data is sourced from “Initial Public Offerings: Updated Statistics” a database run by economist Jay R. Ritter, from the Warrington College of Business, University of Florida.
New Tech Listings in 2021 Broke a 20-Year-Record
From the heydays of the Dotcom boom, when more than 350 companies hit the exchanges in 1999, the number of tech IPOs has dropped steeply over the years.
In fact, the Dotcom boom, driven by investor enthusiasm for internet technologies, and subsequent bust, due to a lack of capital and business viability, left a significant impact on the market. Tech IPOs stayed in the double-digits for the next 20 years.
| Year | U.S. Tech IPOs |
|---|---|
| 1980 | 22 |
| 1981 | 72 |
| 1982 | 42 |
| 1983 | 173 |
| 1984 | 50 |
| 1985 | 37 |
| 1986 | 77 |
| 1987 | 59 |
| 1988 | 28 |
| 1989 | 35 |
| 1990 | 32 |
| 1991 | 71 |
| 1992 | 115 |
| 1993 | 127 |
| 1994 | 115 |
| 1995 | 205 |
| 1996 | 276 |
| 1997 | 174 |
| 1998 | 113 |
| 1999 | 370 |
| 2000 | 261 |
| 2001 | 24 |
| 2002 | 20 |
| 2003 | 18 |
| 2004 | 61 |
| 2005 | 45 |
| 2006 | 48 |
| 2007 | 76 |
| 2008 | 6 |
| 2009 | 14 |
| 2010 | 33 |
| 2011 | 36 |
| 2012 | 40 |
| 2013 | 45 |
| 2014 | 53 |
| 2015 | 38 |
| 2016 | 21 |
| 2017 | 30 |
| 2018 | 40 |
| 2019 | 38 |
| 2020 | 48 |
| 2021 | 126 |
| 2022 | 6 |
| 2023 | 9 |
However, 2021 saw a significant uptick after demand for digital services soared due to pandemic-related lockdowns and social distancing measures. This raised the prospects for new tech listings, especially in the e-commerce and remote work spaces.
As a result the number of American tech IPOs hit a 20-year-high (126) that year. Notable companies that listed included: online gaming platform Roblox, dating app Bumble, and project-management software company Monday.com.
Since then, however, tech IPOs once again dropped to single-digits in both 2022 and 2023. This is largely driven by interest rates, as hawkish central banks dampened private valuations and market sentiments.

-

 Maps2 weeks ago
Mapped: The Population of China and India in Perspective
-

 Markets1 week ago
Charted: Four Decades of U.S. Tech IPOs
-

 Retail1 week ago
Ranked: The 20 Top Retailers Worldwide, by Revenue
-
 Markets1 week ago
Ranked: Which NBA Team Takes Home the Most Revenue?
-

 Markets1 week ago
Charted: Stock Buybacks by the Magnificent Seven
-

 Money1 week ago
Visualizing the Wealth of Americans Under 40 (1989-2023)
-
 Media1 week ago
Infographic: The Next Characters to Enter the Public Domain
-

 Economy1 week ago
Where Unemployment Benefits are the Highest, in OECD Countries