Markets
5 Big Picture Trends Being Accelerated by the Pandemic
As every email introduction has reminded us in 2020, we’re living in “unprecedented times”.
No doubt, even after a viable vaccine is released to the general public and things begin to return to some semblance of normalcy, there will be long lasting effects on society and the economy. It’s been said that COVID-19 has hit fast forward on a number of trends, from e-commerce to workplace culture.
Today, we’ll highlight five of these accelerating trends.
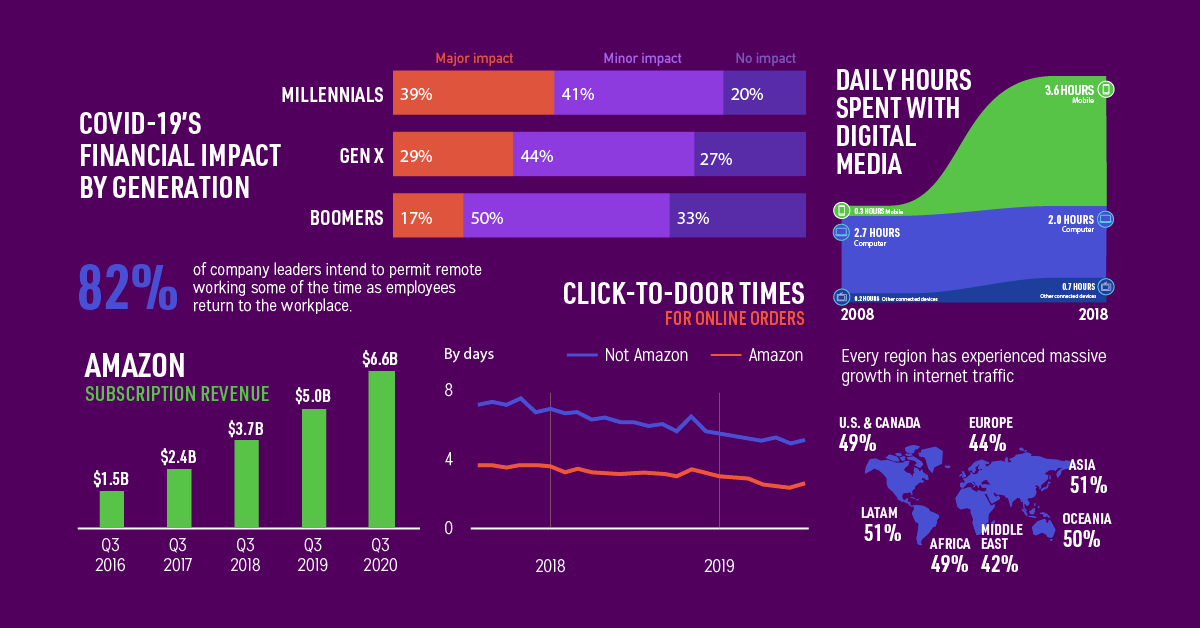
#1: Screen Life Takes Hold
Smartphones have drastically altered many parts our lives – including how we spend time. In the decade from 2008 to 2018, screen time on mobile devices increased 12x.

Fast forward to today, and screen time is up across the board, with some of the most dramatic increases seen among kids and teenagers. 44% of people under the age of 18 now report four hours or more of screen time per day – up from 21% prior to the pandemic.
Gaming is another digital segment that has benefited from the pandemic. Video game revenue spiked in the springtime, and sales have remained strong going further into 2020. Companies are hoping that casual gamers won over during lockdown will continue playing once the pandemic has come to an end.

Acceleration signal: International bandwidth and internet traffic was already increasing steadily, but COVID-19 stay-at-home activity has blown away previous numbers.

Even as more workplaces and schools begin to operate normally again, it’s doubtful that screen time will drop back down to pre-COVID levels.
#2: The Big Consumer Shake-Up
The consumer economy has been innovating on two fronts: making physical buying as “frictionless” as possible, and making e-commerce as nimble as possible. COVID-19 broke old habits and sped up that evolution.
Innovations in real world shopping appear to be moving in the direction of cashierless checkouts, but in order for that model to work, people first need to embrace contactless payment methods such as mobile wallets and cards with tap payment.
So far, the pandemic has been an accelerant in moving people away from cash and pin-and-swipe credit cards in lagging markets. Once people get used to the convenience of contactless payments, it’s likely they’ll continue using those methods.

Of course, no conversation about e-commerce is complete without talking about Amazon. The company has seen consistent growth in subscription revenue in recent years, and the company’s actions have a wide-reaching effect on the rest of the industry.
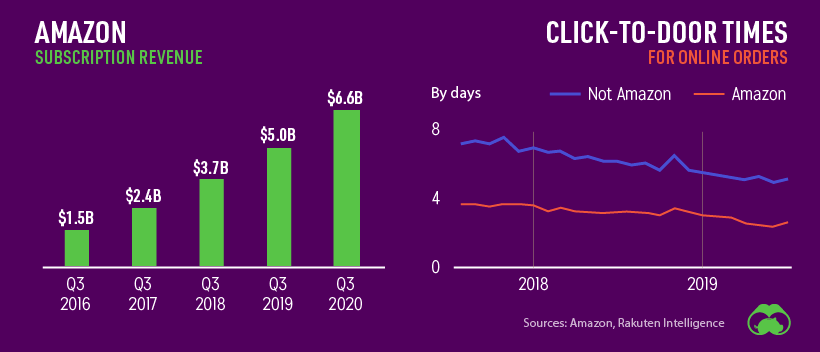
Much like the gaming industry, e-commerce companies like Amazon are hoping that people who dabbled with online ordering during the pandemic months, will convert into lifelong customers.
Acceleration signal: E-commerce penetration projections have shifted upward.
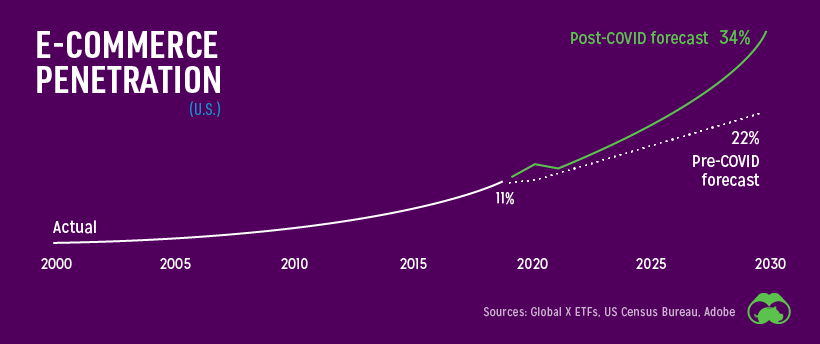
In hindsight, 2020 could be an inflection point where e-commerce gained a much bigger slice of the overall retail pie.
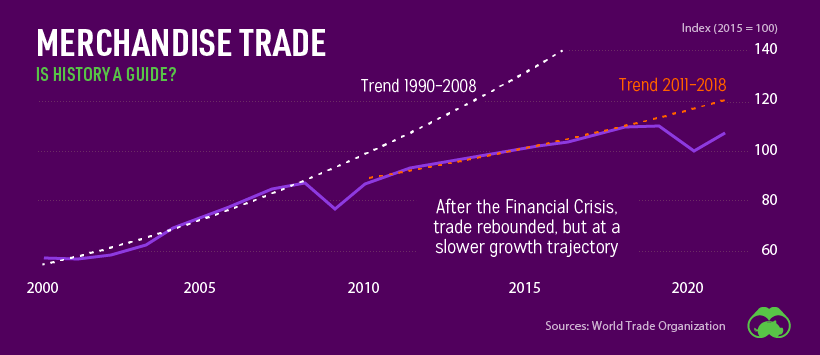
#3: Peak Globalization
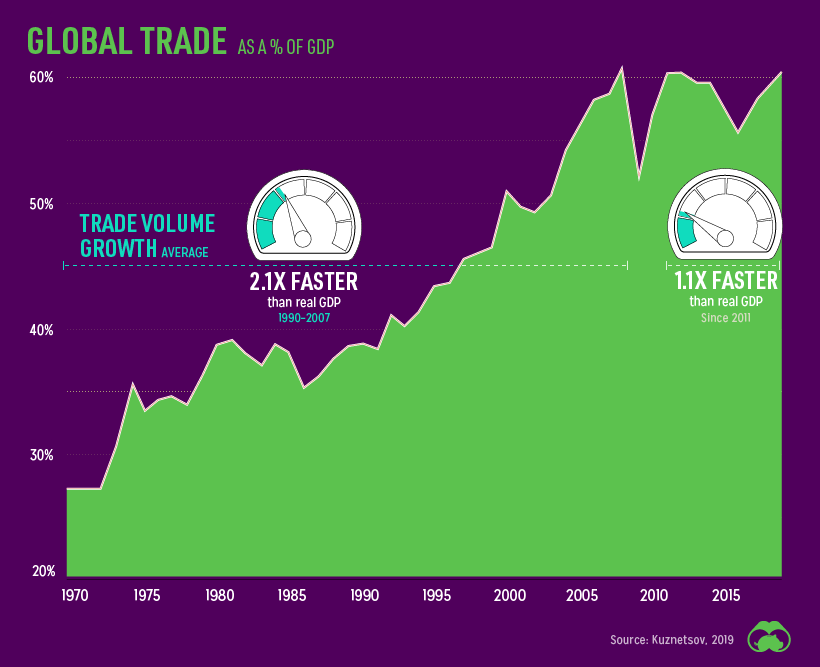
Globalization went on a tear starting from the mid-1980s until it hit a plateau during the financial crisis. Since that point, global trade as a percentage of GDP has flat-lined in the face of trade wars, and now COVID-19.
Trade was obviously impacted by the pandemic, and it’s too early to say what the long-term effects will be. One thing that is clear is that the information component of globalization is becoming an even more important piece of the world’s economic puzzle.
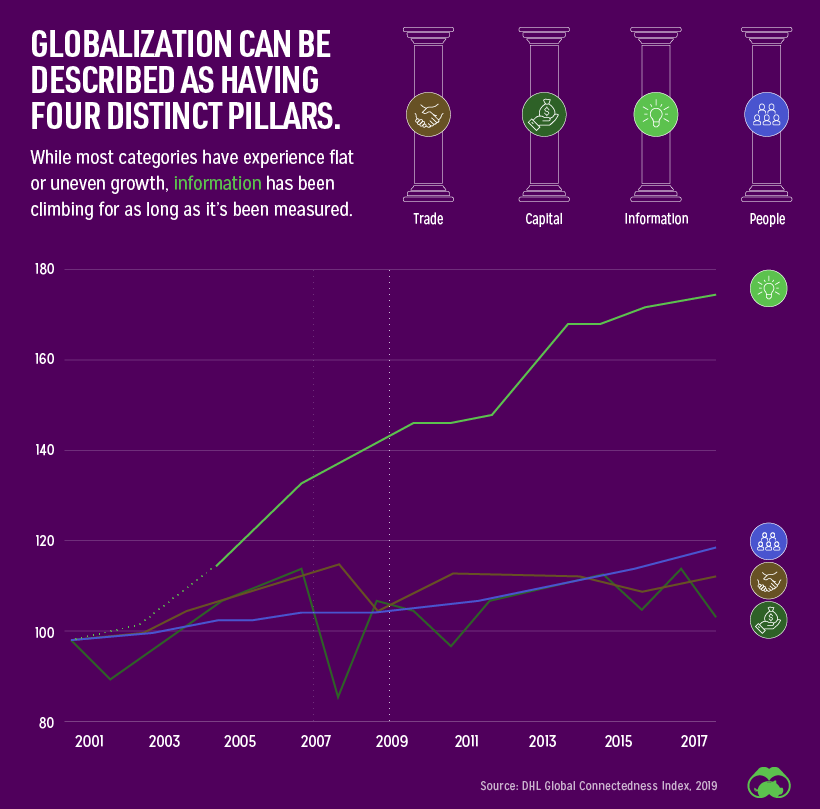
Even before COVID-19 took hold, the global services trade was growing 60% faster than the goods trade, and was valued at approximately $13.4 trillion in 2019.
Acceleration signal: The dip in merchandise trade looks eerily similar to the one that took place in 2008.
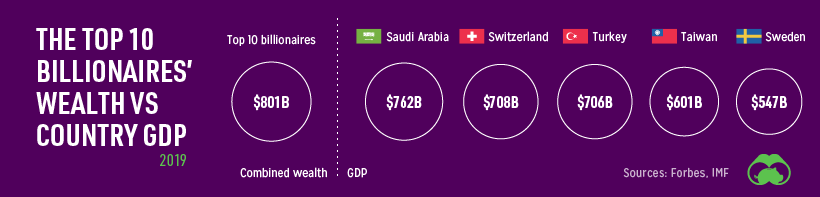
#4: The Wealth Chasm
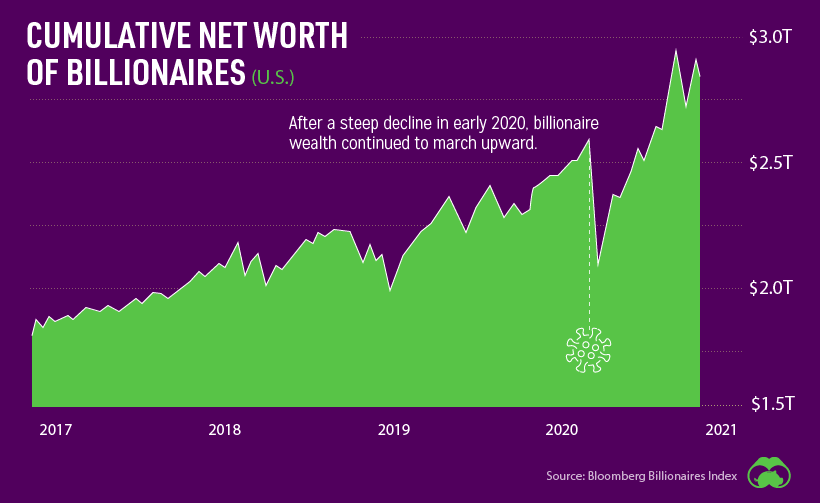
On the high end of the wealth spectrum, billionaires are worth more than ever.
Meanwhile, in the broader economy, inequality has grown over the last few decades. Those in the top 50% wealth bracket have seen increasing gains, while the bottom 50% have seen stagnation.
This issue is sure to be compounded by economic turmoil brought on by COVID-19. Younger generations face the dual challenges of being more likely to be negatively impacted by the pandemic, while also being the least likely to have savings to cover an interruption in income.
In fact, nearly half of people in the 18–24 year old age group have nothing saved at all.

The longer the economy is affected by COVID-19 measures, the more of a wedge will be driven between people who have continued working and those who are employed in impacted industries (e.g. tourism, events).
Acceleration signal: Growth in the net worth of billionaires has been largely unaffected by COVID-19.
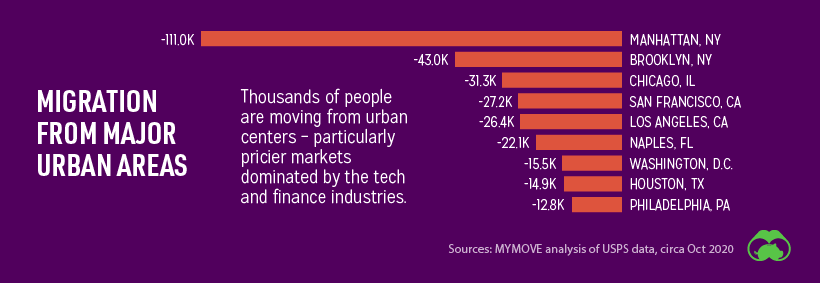
#5: The Flexible Workplace
As of 2019, over half of companies that didn’t have a flexible or remote workplace policy cited “longstanding company policy” as the reason. In other words, that is just the way things have always worked.
Of course, the pandemic has forced many companies to rethink these policies.

This grand experiment in remote work and distributed teams will have an impact on office life as we know it, potentially reshaping the entire “office economy”. The impact is already being felt, with global commercial property investment volume falling by 48% in Q3 2020.
Acceleration signal: Thousands of people are moving out of pricey urban areas, presumably because they are able to work remotely from a cheaper location.
If you like this post, find hundreds of charts
like this in our new book “Signals”:


Markets
The European Stock Market: Attractive Valuations Offer Opportunities
On average, the European stock market has valuations that are nearly 50% lower than U.S. valuations. But how can you access the market?


European Stock Market: Attractive Valuations Offer Opportunities
Europe is known for some established brands, from L’Oréal to Louis Vuitton. However, the European stock market offers additional opportunities that may be lesser known.
The above infographic, sponsored by STOXX, outlines why investors may want to consider European stocks.
Attractive Valuations
Compared to most North American and Asian markets, European stocks offer lower or comparable valuations.
| Index | Price-to-Earnings Ratio | Price-to-Book Ratio |
|---|---|---|
| EURO STOXX 50 | 14.9 | 2.2 |
| STOXX Europe 600 | 14.4 | 2 |
| U.S. | 25.9 | 4.7 |
| Canada | 16.1 | 1.8 |
| Japan | 15.4 | 1.6 |
| Asia Pacific ex. China | 17.1 | 1.8 |
Data as of February 29, 2024. See graphic for full index names. Ratios based on trailing 12 month financials. The price to earnings ratio excludes companies with negative earnings.
On average, European valuations are nearly 50% lower than U.S. valuations, potentially offering an affordable entry point for investors.
Research also shows that lower price ratios have historically led to higher long-term returns.
Market Movements Not Closely Connected
Over the last decade, the European stock market had low-to-moderate correlation with North American and Asian equities.
The below chart shows correlations from February 2014 to February 2024. A value closer to zero indicates low correlation, while a value of one would indicate that two regions are moving in perfect unison.
| EURO STOXX 50 | STOXX EUROPE 600 | U.S. | Canada | Japan | Asia Pacific ex. China |
|
|---|---|---|---|---|---|---|
| EURO STOXX 50 | 1.00 | 0.97 | 0.55 | 0.67 | 0.24 | 0.43 |
| STOXX EUROPE 600 | 1.00 | 0.56 | 0.71 | 0.28 | 0.48 | |
| U.S. | 1.00 | 0.73 | 0.12 | 0.25 | ||
| Canada | 1.00 | 0.22 | 0.40 | |||
| Japan | 1.00 | 0.88 | ||||
| Asia Pacific ex. China | 1.00 |
Data is based on daily USD returns.
European equities had relatively independent market movements from North American and Asian markets. One contributing factor could be the differing sector weights in each market. For instance, technology makes up a quarter of the U.S. market, but health care and industrials dominate the broader European market.
Ultimately, European equities can enhance portfolio diversification and have the potential to mitigate risk for investors.
Tracking the Market
For investors interested in European equities, STOXX offers a variety of flagship indices:
| Index | Description | Market Cap |
|---|---|---|
| STOXX Europe 600 | Pan-regional, broad market | €10.5T |
| STOXX Developed Europe | Pan-regional, broad-market | €9.9T |
| STOXX Europe 600 ESG-X | Pan-regional, broad market, sustainability focus | €9.7T |
| STOXX Europe 50 | Pan-regional, blue-chip | €5.1T |
| EURO STOXX 50 | Eurozone, blue-chip | €3.5T |
Data is as of February 29, 2024. Market cap is free float, which represents the shares that are readily available for public trading on stock exchanges.
The EURO STOXX 50 tracks the Eurozone’s biggest and most traded companies. It also underlies one of the world’s largest ranges of ETFs and mutual funds. As of November 2023, there were €27.3 billion in ETFs and €23.5B in mutual fund assets under management tracking the index.
“For the past 25 years, the EURO STOXX 50 has served as an accurate, reliable and tradable representation of the Eurozone equity market.”
— Axel Lomholt, General Manager at STOXX
Partnering with STOXX to Track the European Stock Market
Are you interested in European equities? STOXX can be a valuable partner:
- Comprehensive, liquid and investable ecosystem
- European heritage, global reach
- Highly sophisticated customization capabilities
- Open architecture approach to using data
- Close partnerships with clients
- Part of ISS STOXX and Deutsche Börse Group
With a full suite of indices, STOXX can help you benchmark against the European stock market.
Learn how STOXX’s European indices offer liquid and effective market access.

-

 Economy1 day ago
Economic Growth Forecasts for G7 and BRICS Countries in 2024
The IMF has released its economic growth forecasts for 2024. How do the G7 and BRICS countries compare?
-

 Markets1 week ago
U.S. Debt Interest Payments Reach $1 Trillion
U.S. debt interest payments have surged past the $1 trillion dollar mark, amid high interest rates and an ever-expanding debt burden.
-

 United States1 week ago
Ranked: The Largest U.S. Corporations by Number of Employees
We visualized the top U.S. companies by employees, revealing the massive scale of retailers like Walmart, Target, and Home Depot.
-

 Markets2 weeks ago
The Top 10 States by Real GDP Growth in 2023
This graphic shows the states with the highest real GDP growth rate in 2023, largely propelled by the oil and gas boom.
-

 Markets2 weeks ago
Ranked: The World’s Top Flight Routes, by Revenue
In this graphic, we show the highest earning flight routes globally as air travel continued to rebound in 2023.
-

 Markets2 weeks ago
Ranked: The Most Valuable Housing Markets in America
The U.S. residential real estate market is worth a staggering $47.5 trillion. Here are the most valuable housing markets in the country.


-

 Mining1 week ago
Gold vs. S&P 500: Which Has Grown More Over Five Years?
-
Markets2 weeks ago
Ranked: The Most Valuable Housing Markets in America
-

 Money2 weeks ago
Which States Have the Highest Minimum Wage in America?
-

 AI2 weeks ago
Ranked: Semiconductor Companies by Industry Revenue Share
-
Markets2 weeks ago
Ranked: The World’s Top Flight Routes, by Revenue
-

 Demographics2 weeks ago
Population Projections: The World’s 6 Largest Countries in 2075
-
Markets2 weeks ago
The Top 10 States by Real GDP Growth in 2023
-

 Demographics2 weeks ago
The Smallest Gender Wage Gaps in OECD Countries