Cities
The 10 Most Populous U.S. Cities, Every Decade Since 1790
View the full-size version of this infographic
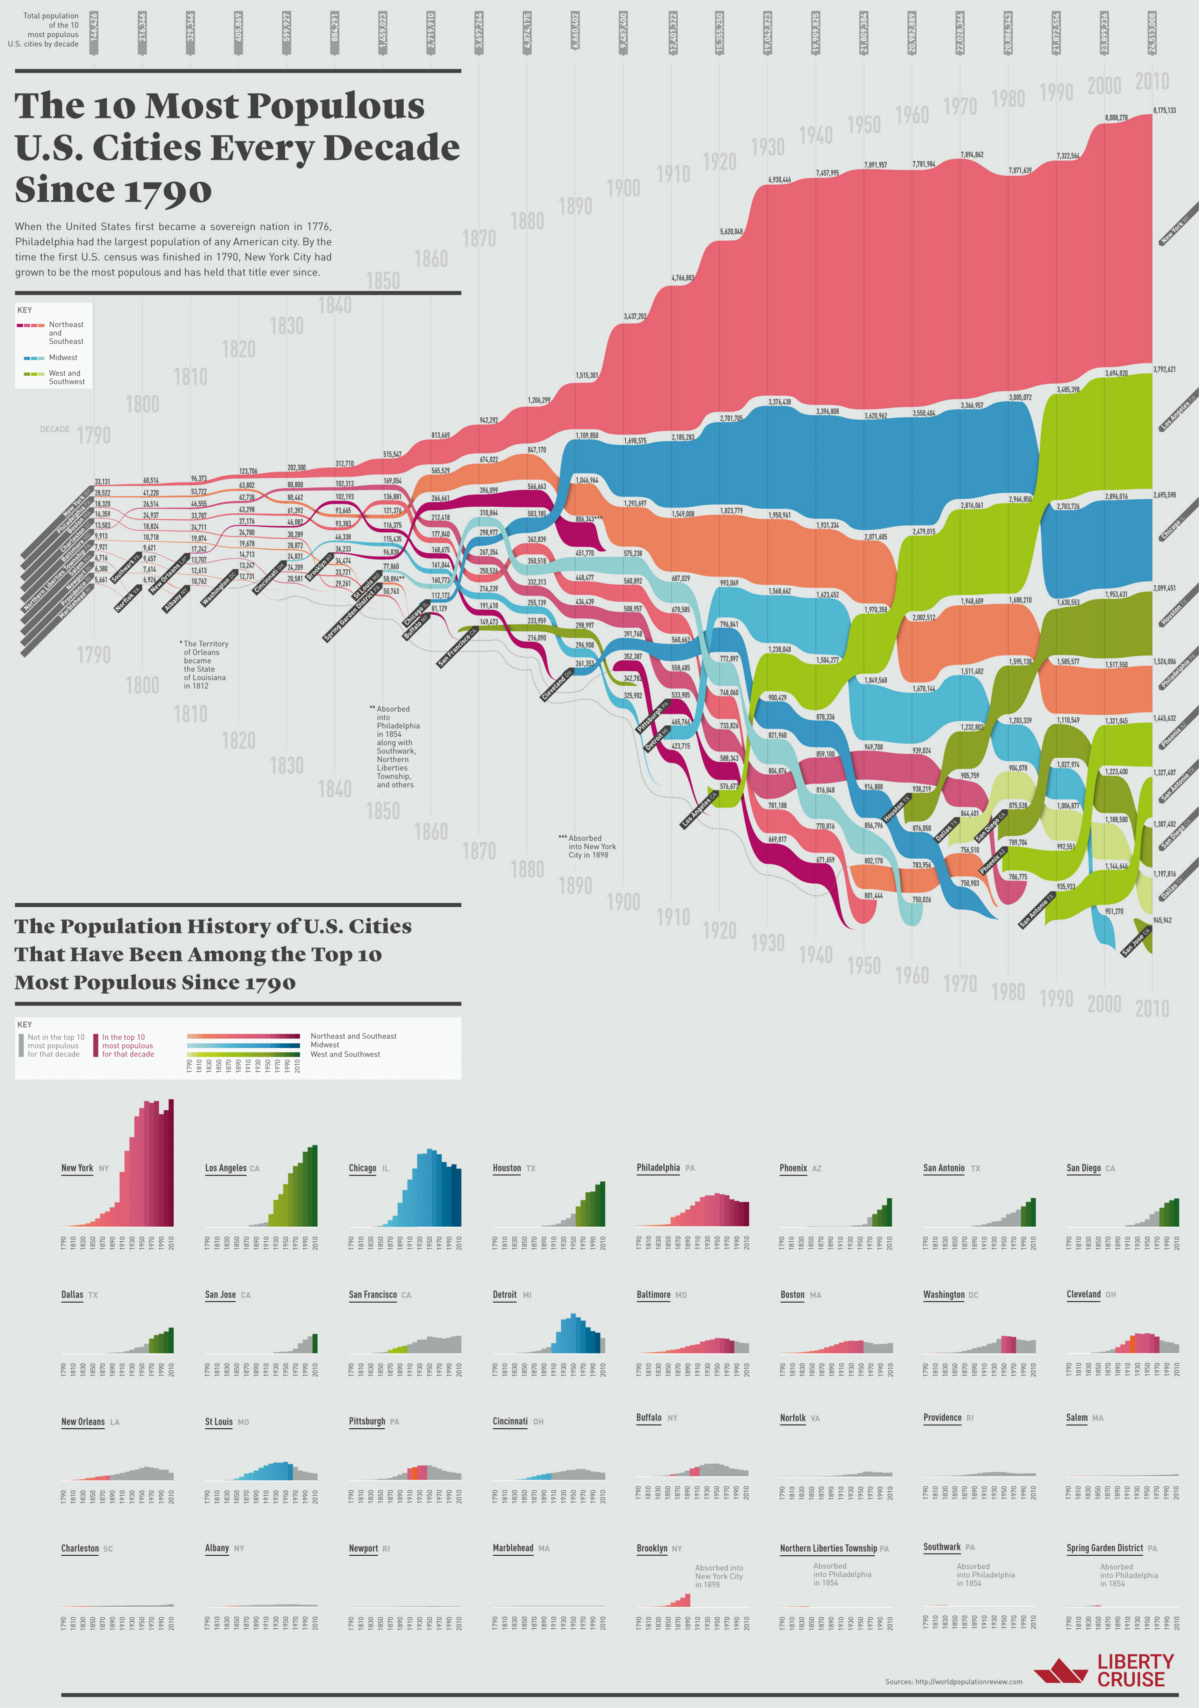
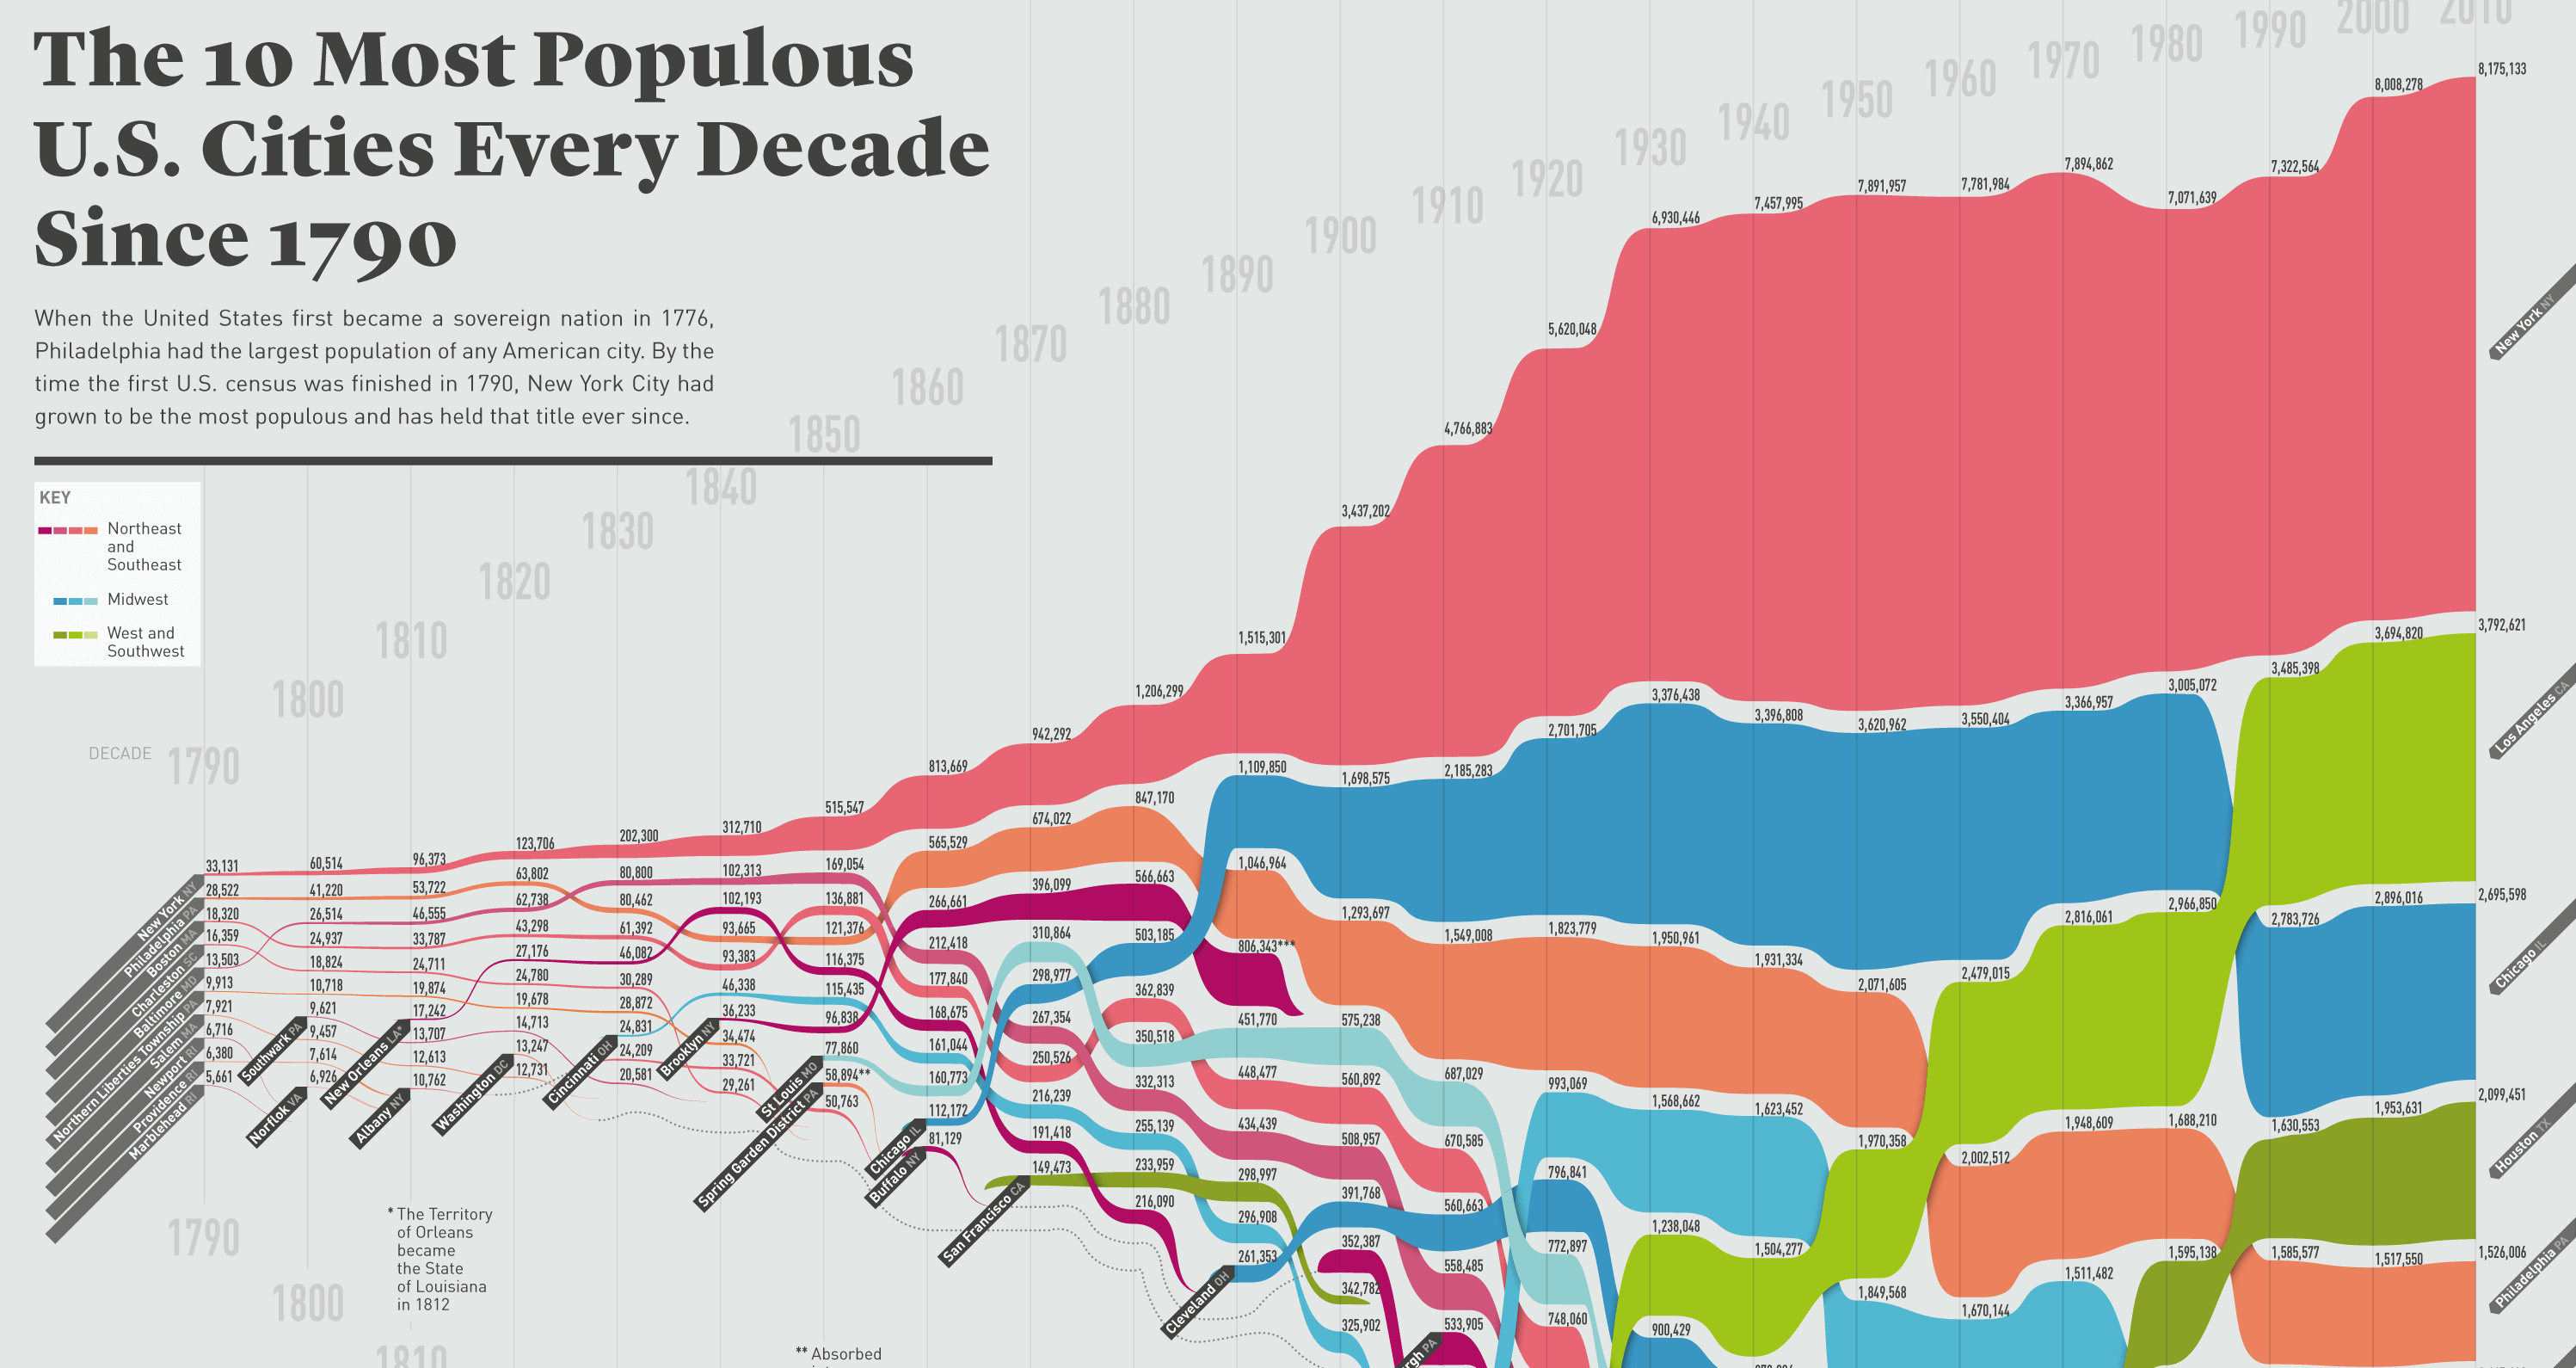
The 10 Most Populous U.S. Cities, Every Decade Since 1790
View the high resolution version of today’s infographic by clicking here
There are only two cities that have had the distinction of being named the most populous city in the United States.
The first city to hold the title was Philadelphia, as the City of Brotherly Love was estimated to be the biggest city in the country at the time of the signing of the Declaration of Independence.
However, by the time of the first U.S. Census in 1790, New York City had surpassed Philadelphia by a few thousand residents – and the Big Apple has stayed the largest in the country ever since.
From Then to Now
Today’s infographic comes to us from Liberty Cruise, and it ranks the 10 most populous cities in the United States for every decade since 1790.
To start, let’s take a look at what the list looked just after the first U.S. Census in 1790:
| Rank | City | Population (1790) |
|---|---|---|
| #1 | New York City, NY | 33,131 |
| #2 | Philadelphia, PA | 28,522 |
| #3 | Boston, MA | 18,320 |
| #4 | Charleston, SC | 16,359 |
| #5 | Baltimore, MD | 13,503 |
| #6 | Northern Liberties Township, PA | 9,913 |
| #7 | Salem, MA | 7,921 |
| #8 | Newport, RI | 6,716 |
| #9 | Providence, RI | 6,380 |
| #10 | Marblehead, MA | 5,661 |
It’s pretty surreal to think that some of the biggest cities in the late 18th century hosted no more than 6,000 residents.
It also may be a surprise to many that Rhode Island – a state that ranks 50th in size and 44th in population today – held two of the largest towns in the nation at the time: Newport and Providence.
The Modern List
Jump forward over 200 years, and New York City has not lost its top spot.
It helped that NYC was able to absorb Brooklyn – one of the country’s other largest cities – into its boundaries in 1898. Other major cities saw similar merges happen over the years, with Philadelphia absorbing Northern Liberties Township, for example.
Here is a list of the most populous U.S. cities in 2017 (est.):
| Rank | City | Population (Est. 2017) | Population (2010 Census) | Change |
|---|---|---|---|---|
| #1 | New York City, NY | 8,622,698 | 8,175,133 | +5.47% |
| #2 | Los Angeles, CA | 3,999,759 | 3,792,621 | +5.46% |
| #3 | Chicago, IL | 2,716,450 | 2,695,598 | +0.77% |
| #4 | Houston, TX | 2,312,717 | 2,100,263 | +10.12% |
| #5 | Phoenix, AZ | 1,626,078 | 1,445,632 | +12.48% |
| #6 | Philadelphia, PA | 1,580,863 | 1,526,006 | +3.59% |
| #7 | San Antonio, TX | 1,511,946 | 1,327,407 | +13.90% |
| #8 | San Diego, CA | 1,419,516 | 1,307,402 | +8.58% |
| #9 | Dallas TX | 1,341,075 | 1,197,816 | +11.96% |
| #10 | San Jose, CA | 1,035,317 | 945,942 | +9.45% |
In contrast to the NYC of today, the 1790 population looks more like a Long Island suburb.
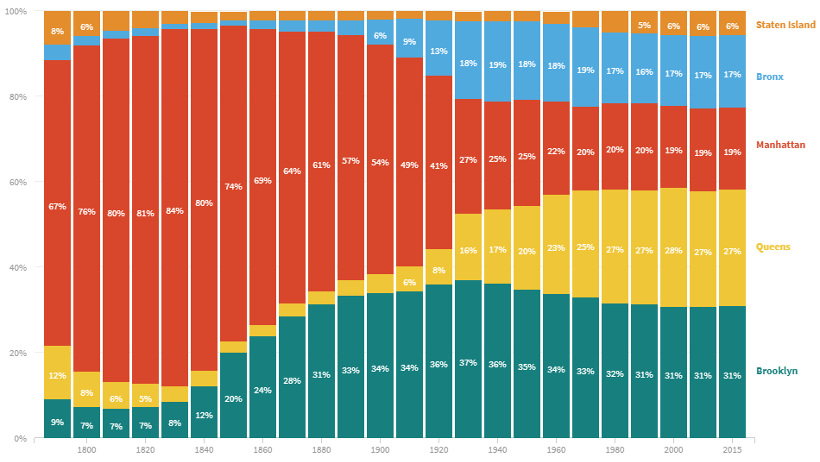
This rapid urbanization is mainly thanks to Industrial Revolution, which triggered a massive migration to cities, allowing New York to grow 26,000% in total population.
Here’s how the population distribution of New York City’s five boroughs has changed over time:
Interested in learning more about the country’s largest cities?
See the electrifying pulse of a Manhattan workday or view a 3d map that shows how much U.S. metro areas contribute to economic growth.


Markets
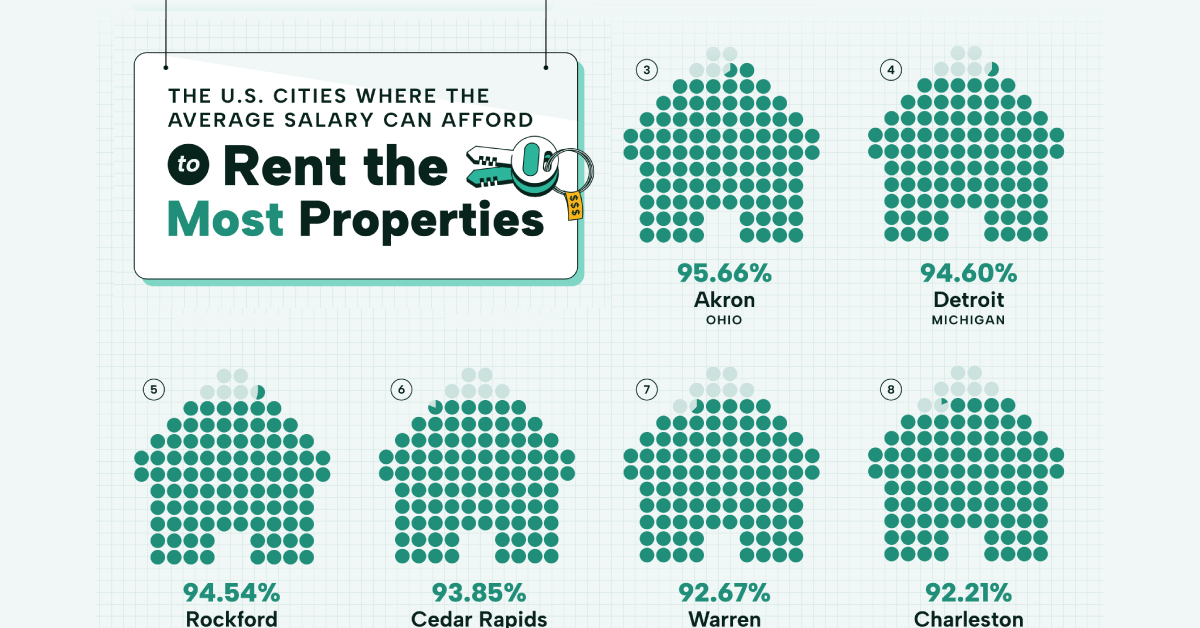
The Most Affordable U.S. Cities for Rent on an Average Salary
Visualizing the most affordable U.S. cities for renters by the percentage of affordable rentals available on an average salary.
 Creator Program
The Most Affordable U.S. Cities for Rent on an Average Salary
In 2023, 34% of the 131 million households in the U.S. lived in rented homes.
But which U.S. cities are the most affordable to rent in? The question isn’t just about cost, but about the average salary in each city, and some cities in expensive-seeming states turn out to be relatively affordable.
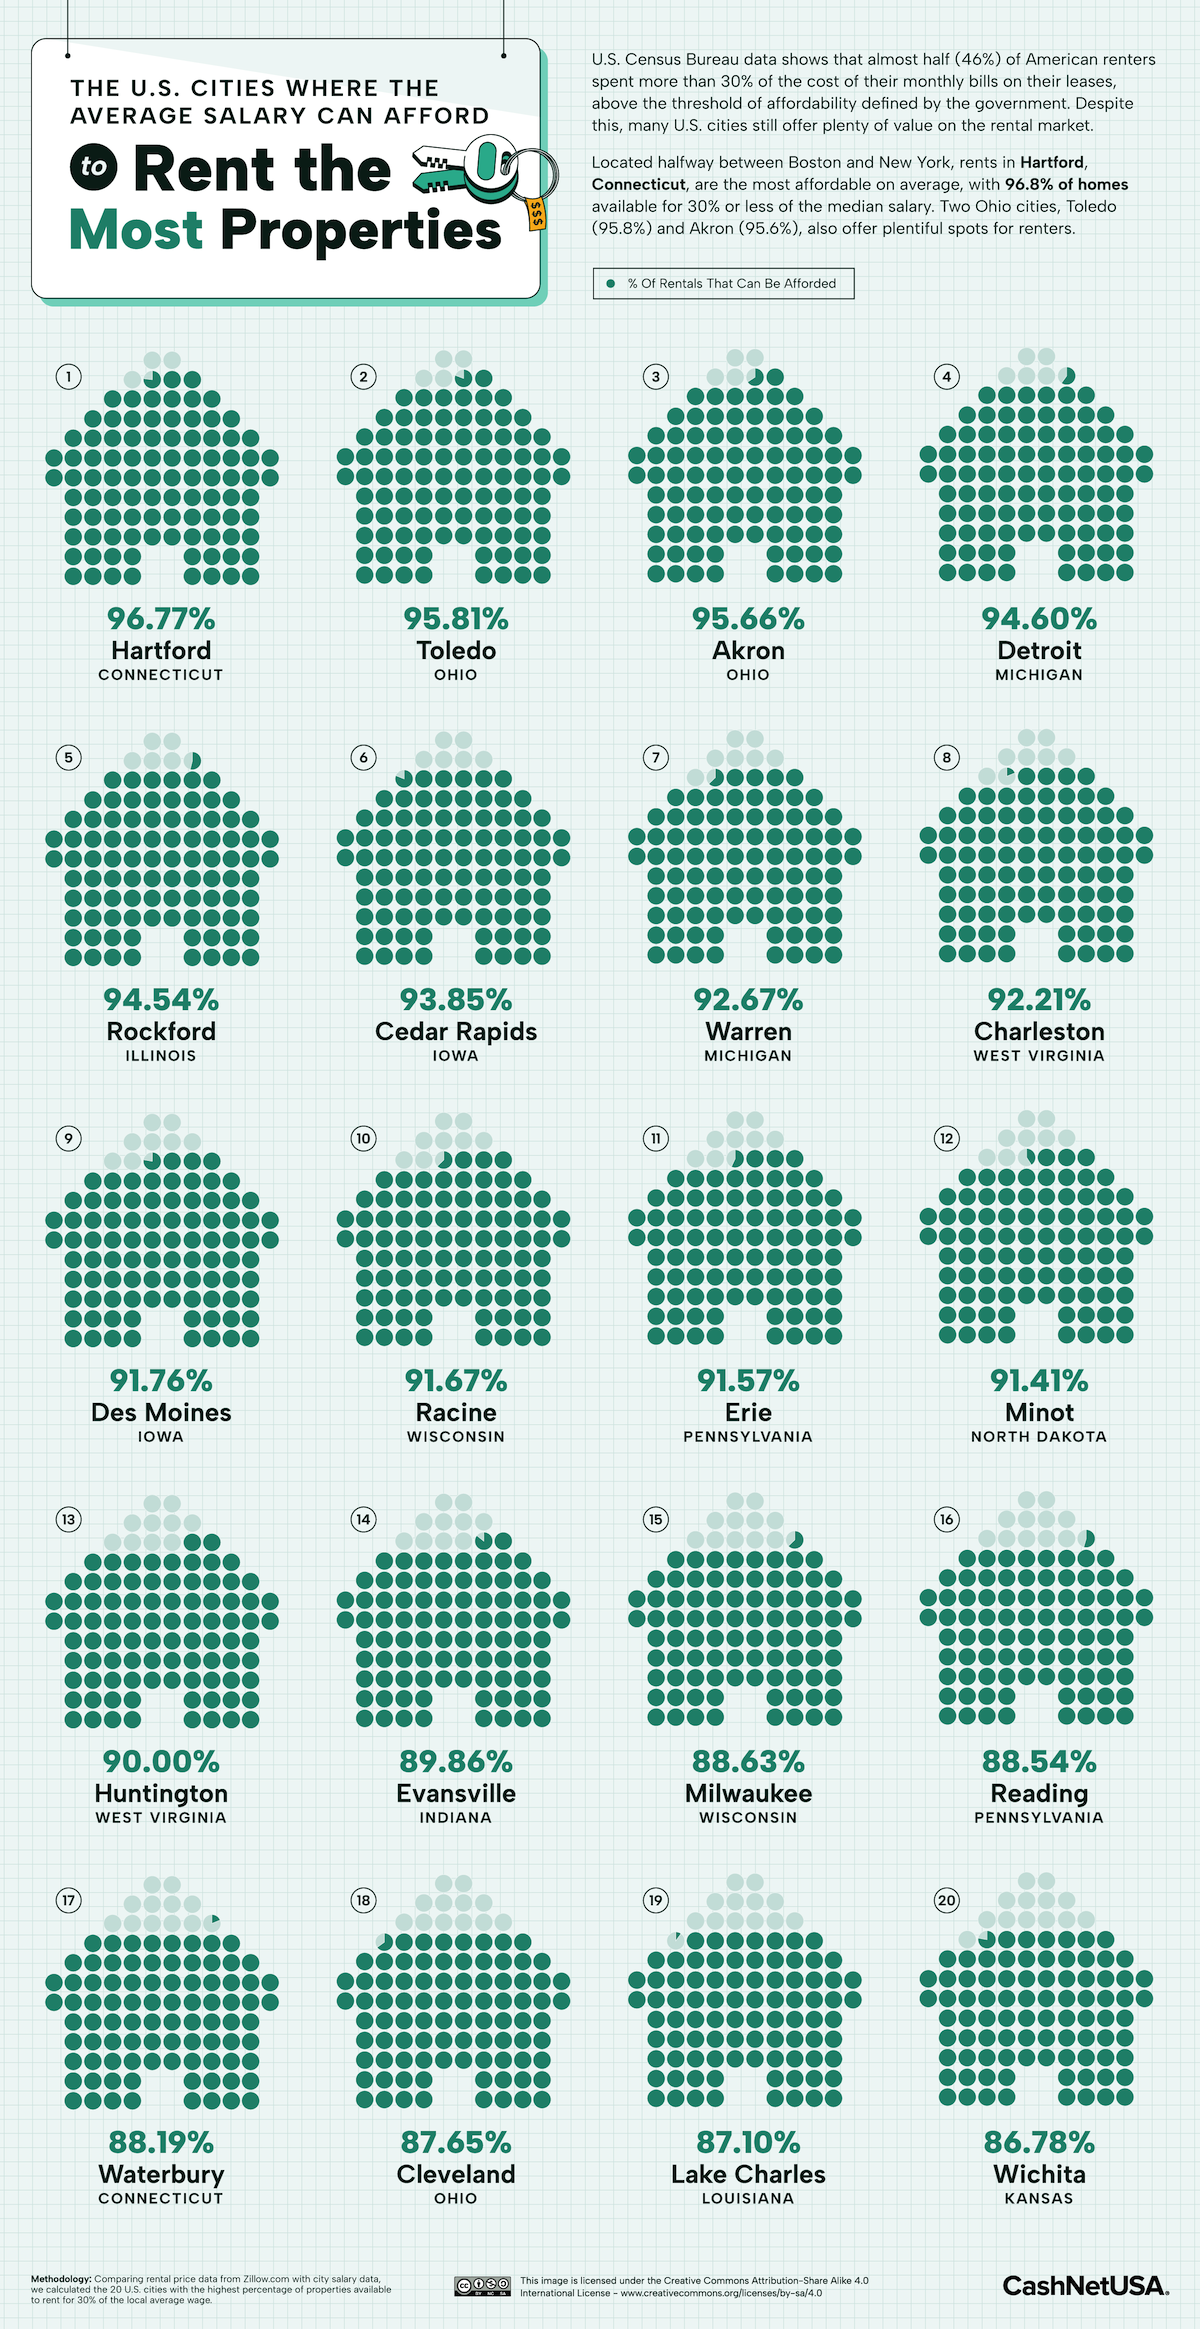
To answer the question, CashNetUSA found rental price data (as of August 2023) from Zillow.com and compared it to city salary data to calculate the percentage of properties available to rent for 30% or less of the local average income.
Ranked: Most Affordable American Cities for Renters
Ranked first, nearly 97% of the available rentals in Hartford can be rented for an affordable rate, based on average income.
This might be a surprising statistic. Connecticut was the richest U.S. state (by per capita income) for nearly three decades till 2019, and has one of the highest costs of living in the U.S.
However, it’s important to note that this data deals with averages instead of medians. For example, according to data from the Bureau of Labor Statistics, the average hourly wage for a Hartford resident—across all occupations—is slightly more than $33/hour, or close to $70,000 a year. Its median wage is almost $8/hour lower, which comes in at $53,000 a year.
Richer residents, with higher incomes might be skewing the apparent affordability of available rentals.
Note: Data current as of August, 2023.
Toledo and Akron, ranked second and third, have similar rates of affordability, with 95% of their available rentals falling within 30% of the city’s average wage. In fact Ohio has the most number of cities in the top 20, with Waterbury ranked 17th.
Detroit and Rockford round out the top five most affordable cities in the U.S. for renters. Both cities have affordable housing markets, after the Great Recession caused the local economies to tank, in turn causing an increase in crime and decline in population. Post-pandemic, however, both cities are on the rebound with an influx of industries, jobs, and people.
Where Does This Data Come From?
Source: CashNetUSA
Methodology: CashNetUSA sourced the average base salary of U.S. cities focusing on the 100 most populated cities in the country, plus the five most populated cities from each state. Using Zillow.com, they then counted how many rental properties per city were listed at a monthly price equivalent to 30% or less of a city’s monthly gross salary. The number of rental properties available per city was converted into a percentage score per city. Data for this research is accurate as of August 2023.

-

 Maps2 weeks ago
Mapped: Average Wages Across Europe
-

 Money1 week ago
Which States Have the Highest Minimum Wage in America?
-

 Real Estate1 week ago
Ranked: The Most Valuable Housing Markets in America
-

 Markets1 week ago
Charted: Big Four Market Share by S&P 500 Audits
-

 AI1 week ago
The Stock Performance of U.S. Chipmakers So Far in 2024
-

 Automotive2 weeks ago
Almost Every EV Stock is Down After Q1 2024
-

 Money2 weeks ago
Where Does One U.S. Tax Dollar Go?
-

 Green2 weeks ago
Ranked: Top Countries by Total Forest Loss Since 2001