Money
Where Does One U.S. Tax Dollar Go?
![]() See this visualization first on the Voronoi app.
See this visualization first on the Voronoi app.
Where Does One U.S. Tax Dollar Go?
This was originally posted on our Voronoi app. Download the app for free on Apple or Android and discover incredible data-driven charts from a variety of trusted sources.
Come tax season, a common refrain is: “what do my taxes even pay for?”
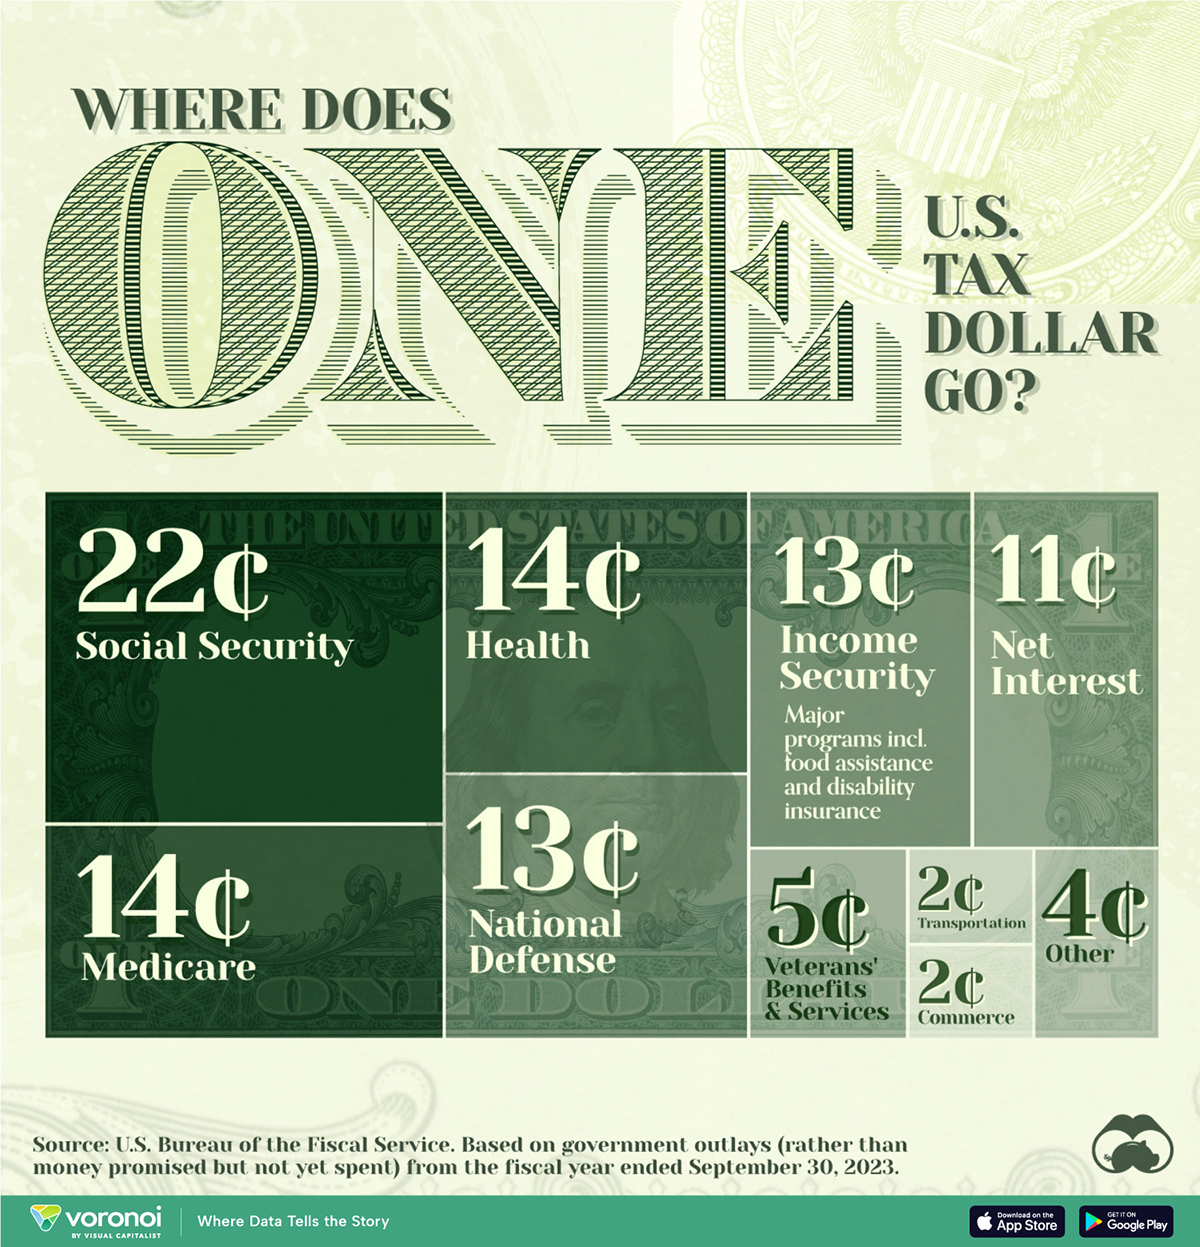
To answer that question, we visualized U.S. federal government spending by function, referencing expenditure to a single federal tax dollar.
Data is for the fiscal year ending September 30, 2023 from the U.S. Bureau of the Fiscal Service. Total spending amounts are converted to cents on the dollar and percentages, to show where one tax dollar goes.
Major Areas of U.S. Government Spending
Social security is the government’s single largest expense and where 22% of tax dollars go. Signed into law in 1935, the program was to insure against the “hazards and vicissitudes of life.” In practice, it meant the creation of a work-related contributory system in which workers secure their own retirement by taxes paid while employed.
However, an aging population threatens its sustainability because as more people retire and draw benefits, there are fewer active workers contributing to the system.
| Government Spending | Amount Paid Out of $1 Tax Dollar |
|---|---|
| 🏛️ Social Security | $0.22 |
| 🏥 Health | $0.14 |
| 🚑 Medicare | $0.14 |
| ⚔️ National Defense | $0.13 |
| 💰 Income Security | $0.13 |
| 📈 Net Interest | $0.11 |
| 🎖️ Veterans' Benefits & Services | $0.05 |
| 🚗 Transportation | $0.02 |
| 🛒 Commerce | $0.02 |
| 🔍 Other | $0.04 |
Health and Medicare together amount to 28% of government spending. The largest health expense is grants to states for Medicaid, which helps cover medical costs for people with lower incomes. Medicare, on the other hand, is federal health insurance for people 65 and older, as well as younger people with disabilities.
National Defense accounts for 13% of government spending. This includes paying military personnel, operating and maintenance costs like fuel, buying aircraft and ships, and research and development. While fourth in terms of percentage spending, this still contributes to the largest military budget in the world—by quite a margin.
Meanwhile, Income Security (also at 13%) covers programs like unemployment compensation, nutrition assistance, and housing assistance. It also has additional retirement and disability benefits not covered by social security.
Just behind—and still well-ahead of all other government spending—is Interest Payments on government debt, coming in at about 11% of tax supported expenditure.


Economy
Ranked: The Top 20 Countries in Debt to China
The 20 nations featured in this graphic each owe billions in debt to China, posing concerns for their economic future.
Ranked: The Top 20 Countries in Debt to China
This was originally posted on our Voronoi app. Download the app for free on iOS or Android and discover incredible data-driven charts from a variety of trusted sources.
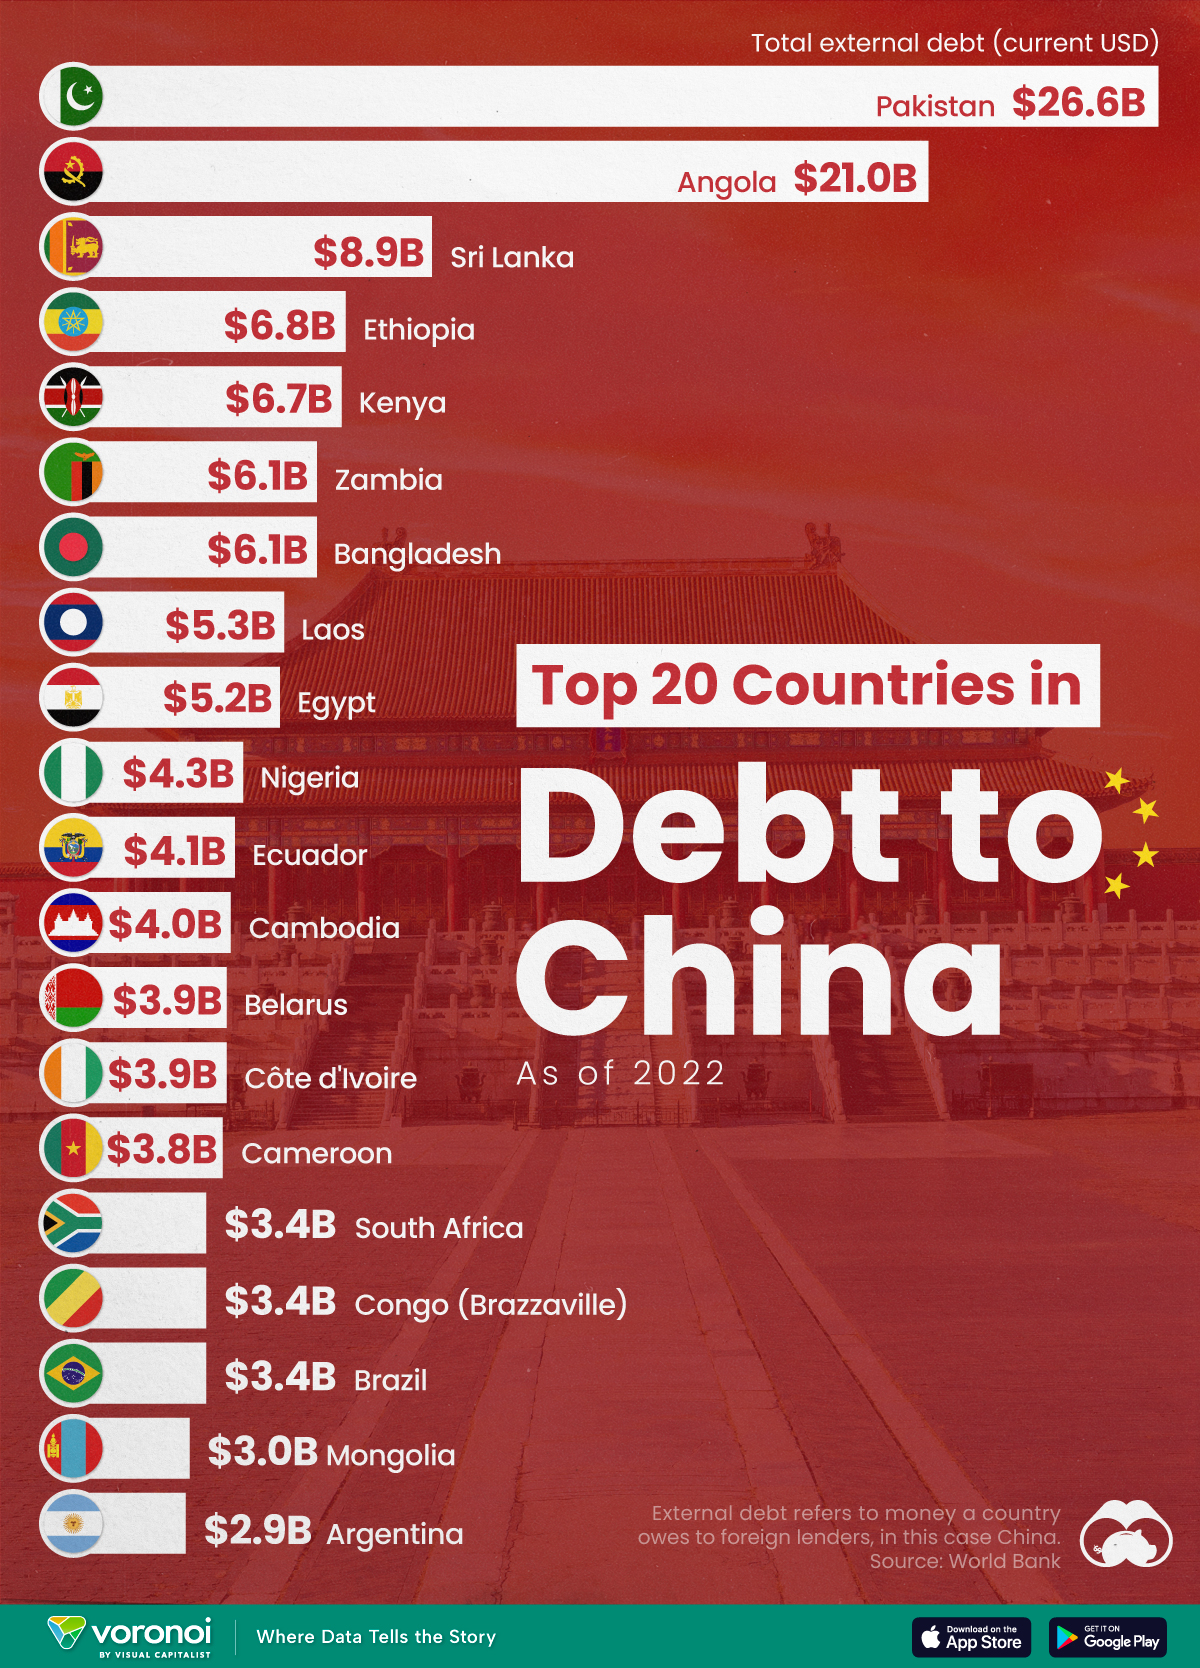
In this graphic, we ranked the top 20 countries by their amount of debt to China. These figures are as of 2022, and come from the World Bank (accessed via Yahoo Finance).
The data used to make this graphic can be found in the table below.
| Country | Total external debt to China ($B) |
|---|---|
| 🇵🇰 Pakistan | $26.6 |
| 🇦🇴 Angola | $21.0 |
| 🇱🇰 Sri Lanka | $8.9 |
| 🇪🇹 Ethiopia | $6.8 |
| 🇰🇪 Kenya | $6.7 |
| 🇧🇩 Bangladesh | $6.1 |
| 🇿🇲 Zambia | $6.1 |
| 🇱🇦 Laos | $5.3 |
| 🇪🇬 Egypt | $5.2 |
| 🇳🇬 Nigeria | $4.3 |
| 🇪🇨 Ecuador | $4.1 |
| 🇰🇭 Cambodia | $4.0 |
| 🇨🇮 Côte d'Ivoire | $3.9 |
| 🇧🇾 Belarus | $3.9 |
| 🇨🇲 Cameroon | $3.8 |
| 🇧🇷 Brazil | $3.4 |
| 🇨🇬 Republic of the Congo | $3.4 |
| 🇿🇦 South Africa | $3.4 |
| 🇲🇳 Mongolia | $3.0 |
| 🇦🇷 Argentina | $2.9 |
This dataset highlights Pakistan and Angola as having the largest debts to China by a wide margin. Both countries have taken billions in loans from China for various infrastructure and energy projects.
Critically, both countries have also struggled to manage their debt burdens. In February 2024, China extended the maturity of a $2 billion loan to Pakistan.
Soon after in March 2024, Angola negotiated a lower monthly debt payment with its biggest Chinese creditor, China Development Bank (CDB).
Could China be in Trouble?
China has provided developing countries with over $1 trillion in committed funding through its Belt and Road Initiative (BRI), a massive economic development project aimed at enhancing trade between China and countries across Asia, Africa, and Europe.
Many believe that this lending spree could be an issue in the near future.
According to a 2023 report by AidData, 80% of these loans involve countries in financial distress, raising concerns about whether participating nations will ever be able to repay their debts.
While China claims the BRI is a driver of global development, critics in the West have long warned that the BRI employs debt-trap diplomacy, a tactic where one country uses loans to gain influence over another.
Editor’s note: The debt shown in this visualization focuses only on direct external debt, and does not include publicly-traded, liquid, debt securities like bonds. Furthermore, it’s worth noting the World Bank data excludes some countries with data accuracy or reporting issues, such as Venezuela.
Learn More About Debt from Visual Capitalist
If you enjoyed this post, check out our breakdown of $97 trillion in global government debt.

-

 Technology6 days ago
All of the Grants Given by the U.S. CHIPS Act
-

 Uranium2 weeks ago
The World’s Biggest Nuclear Energy Producers
-

 Education2 weeks ago
How Hard Is It to Get Into an Ivy League School?
-

 Debt2 weeks ago
How Debt-to-GDP Ratios Have Changed Since 2000
-

 Sports2 weeks ago
The Highest Earning Athletes in Seven Professional Sports
-

 Science2 weeks ago
Visualizing the Average Lifespans of Mammals
-

 Brands1 week ago
How Tech Logos Have Evolved Over Time
-

 Energy1 week ago
Ranked: The Top 10 EV Battery Manufacturers in 2023