Investor Education
The Warren Buffett Empire in One Giant Chart
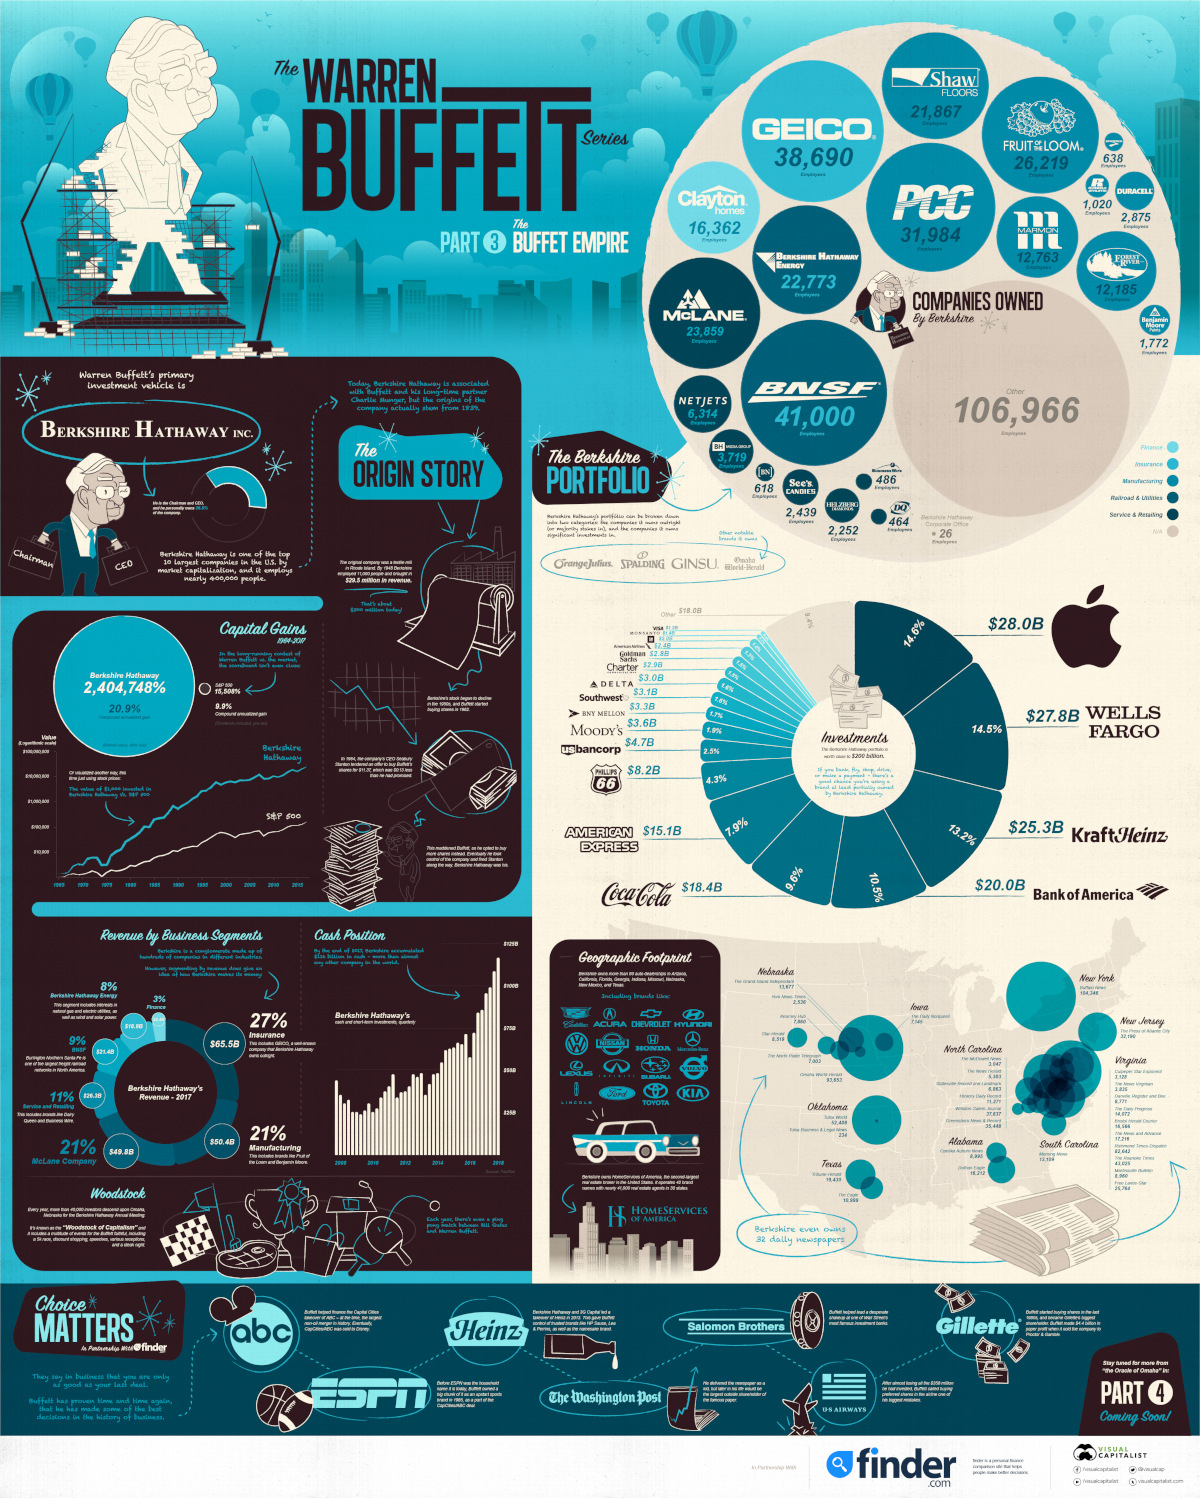
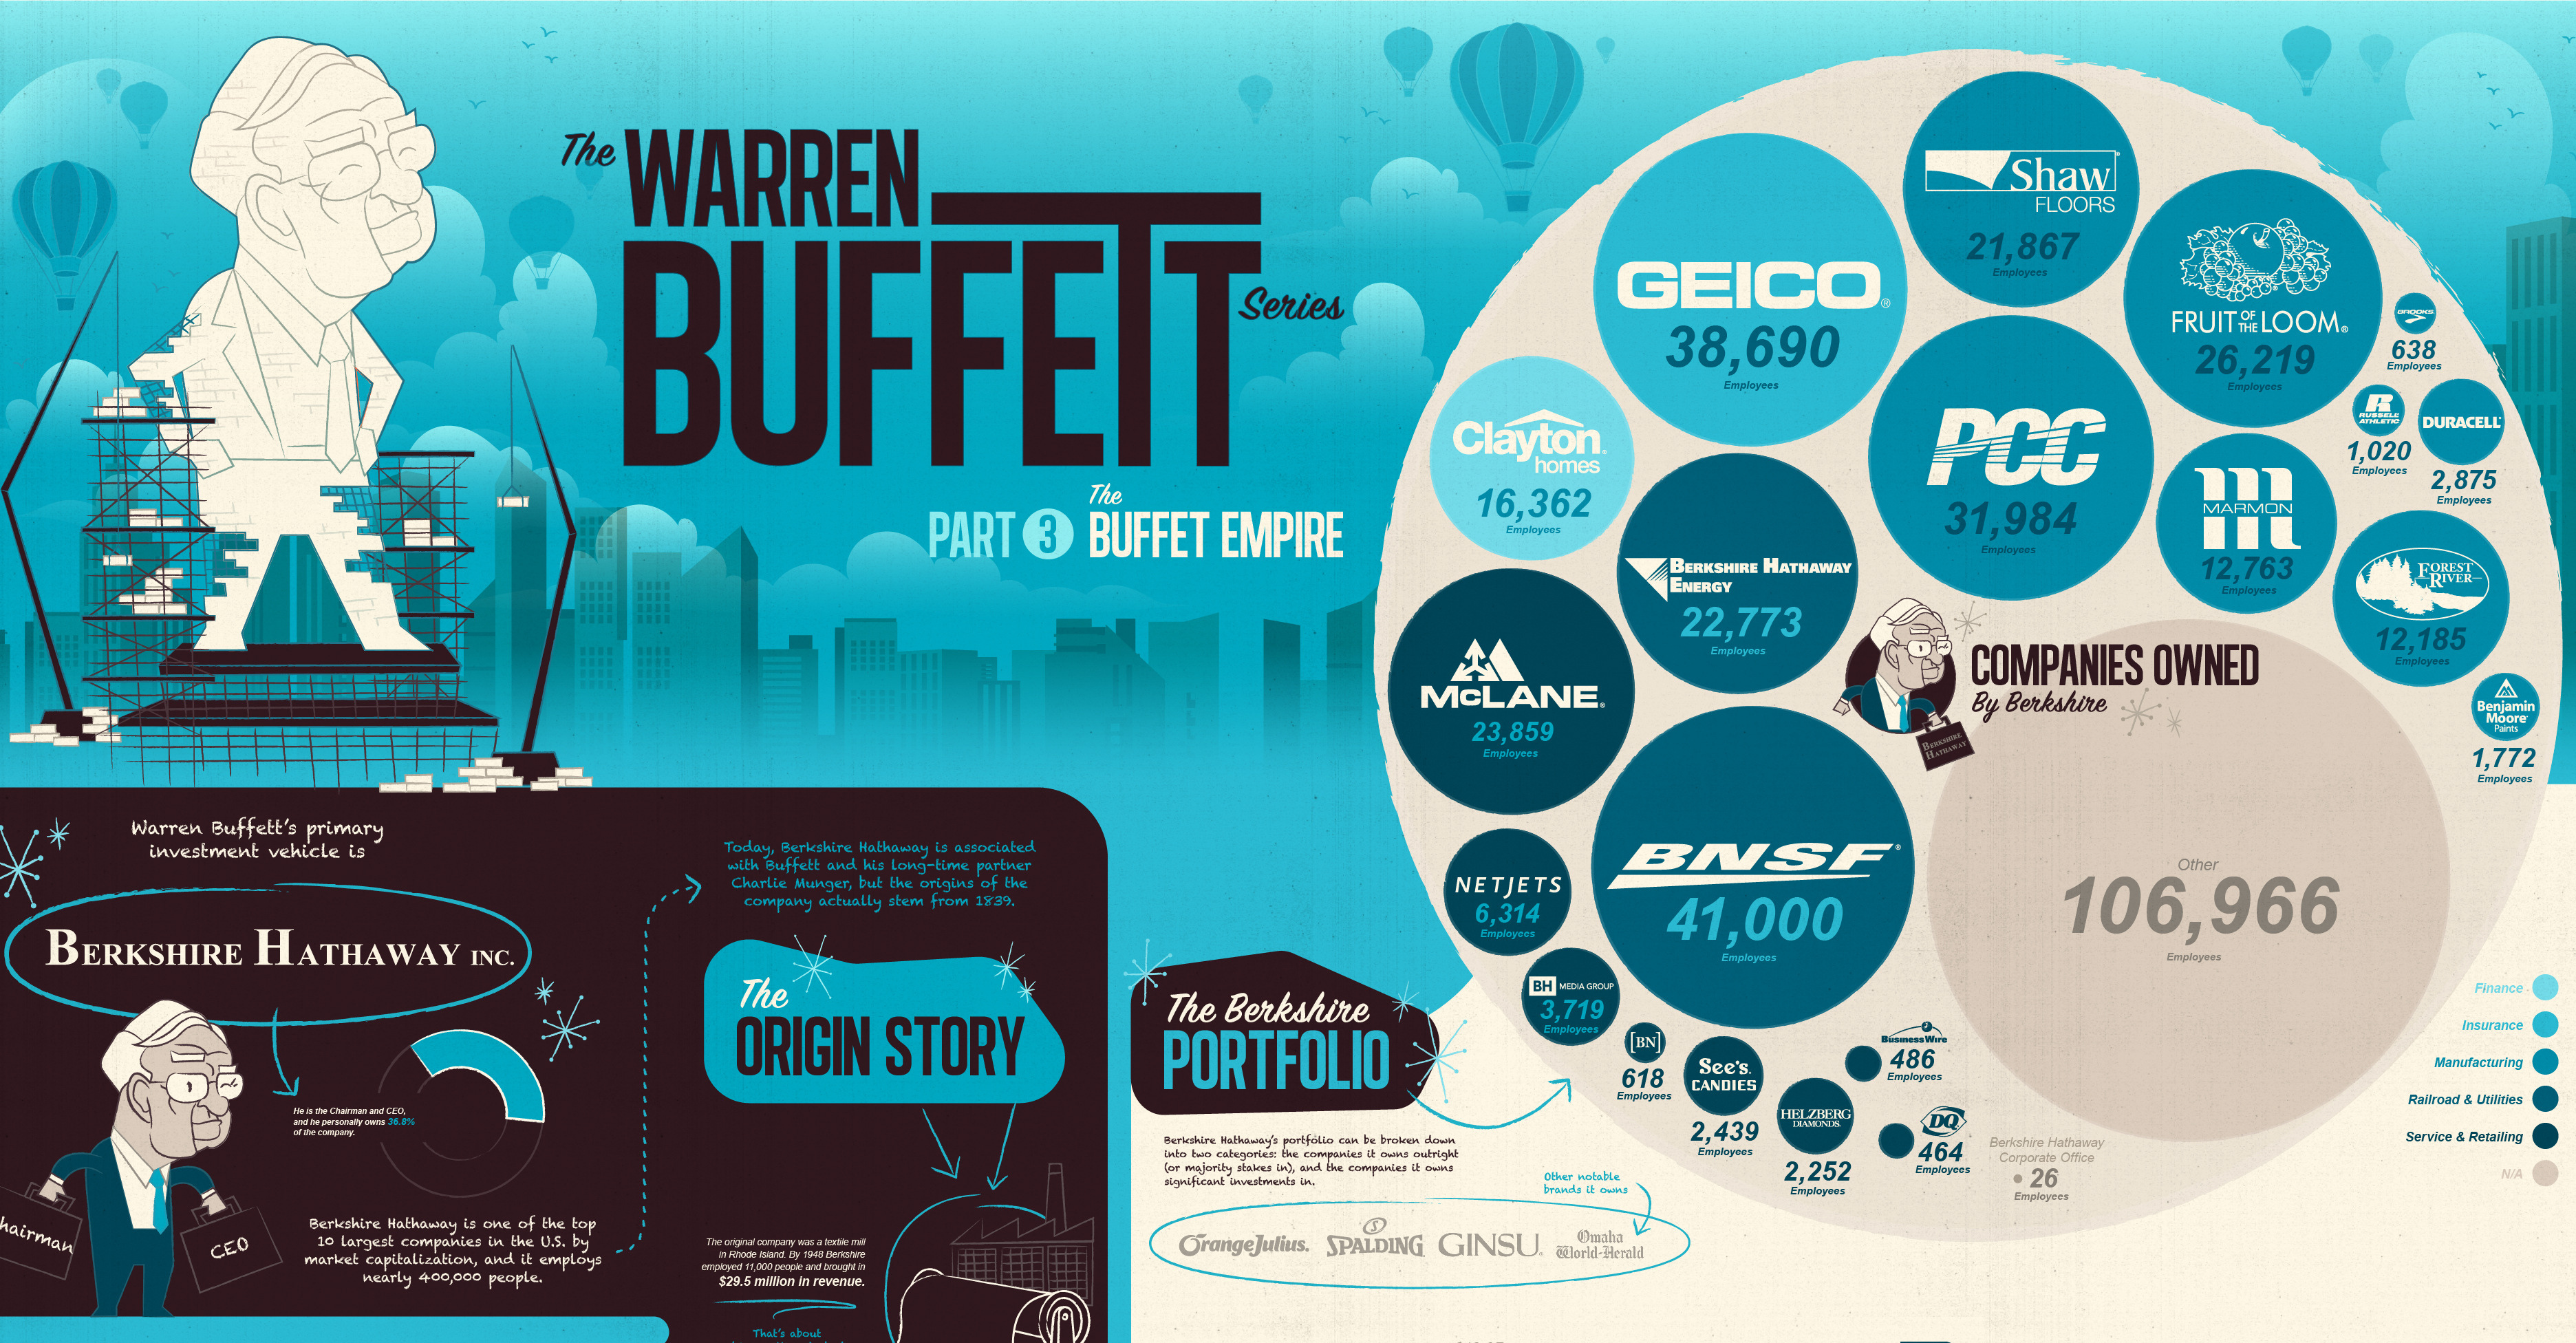
Most people know Berkshire Hathaway as the massive conglomerate that serves as the investment vehicle for Warren Buffett’s $83 billion fortune. However, far fewer people know what this giant does, and how it actually makes its money!
The Warren Buffett Series
Part 3: The Warren Buffett Empire
Today’s infographic breaks down the many companies and investments that Berkshire Hathaway owns.
It’s the third part of the Warren Buffett Series, which we’ve done in partnership with finder.com, a personal finance site that helps people make better decisions – whether they want to jump on the cryptocurrency craze or follow Buffett’s more traditional path to financial success.


Explore the full-screen version of this graphic
The Warren Buffett Empire in One Giant Chart
This giant infographic is best viewed using the full-size version. Also, don’t forget to check out Part 1 and Part 2 of our Warren Buffett Series.
If you look at any ranking of the world’s richest people, you will notice that most of the names derive their wealth from building individual, successful companies.
Topping today’s rich list is Jeff Bezos, who started Amazon in 1994. Further down, you see familiar names like Bill Gates (Microsoft), Amancio Ortega (Zara), Mark Zuckerberg (Facebook), Larry Ellison (Oracle), and so on.
Warren Buffett, who appears third on such a list, is completely unique in this sense. Through his holding company Berkshire Hathaway, he has bought, sold, or invested in hundreds of companies over the years, and their industries are all over the map. These investments include consumer goods companies like Coca-Cola, daily national newspapers like The Washington Post, and insurance companies like GEICO.
Buffett currently owns 36.8% of Berkshire – and at the time of publishing, Berkshire Hathaway is worth an impressive $480 billion, employing 377,000 people across many different industries.
Origin Story
Although Berkshire Hathaway is today associated with Buffett and his long-time partner Charlie Munger, the origins of the company actually stem from 1839.
The original company was a textile mill in Rhode Island, and by 1948 Berkshire employed 11,000 people and brought in $29.5 million in revenue (about $300 million in today’s dollars).
After Berkshire’s stock began to decline in the late 1950s, Buffett saw value in the company and started accumulating shares. By 1964, Buffett wanted out, and the company’s CEO Seabury Stanton tendered an offer to buy Buffett’s shares for $11.37, which was $0.13 less than he had promised.
This made Buffett mad, and instead of taking the offer, he opted to buy more shares. Eventually he took control of the company and fired Stanton.
The company was his, and the rest is history.
The Scoreboard
In the long-running contest of Warren Buffett vs. the market, the scoreboard isn’t even close:
| Berkshire Hathaway | S&P 500 | |
|---|---|---|
| Total gain (1964-2017) | 2,404,748% | 15,508% |
| Compound annualized gain | 20.9% | 9.9% |
Source: BH Annual Report. BH’s market value is after-tax, and S&P 500 is pre-tax, including dividends.
If you’re wondering how Warren Buffett developed such an impressive investing record, it’s worth seeing Part 2 of this series: Inside Buffett’s Brain.
Revenue by Business Segments
The Warren Buffett Empire is diverse, and made up of hundreds of companies in different industries.
However, segmenting by revenue does give an idea of how Berkshire makes its money:
| Revenue (Billions, 2017) | % of Total | |
|---|---|---|
| Insurance | $65.5 | 27% |
| BNSF | $21.4 | 9% |
| Berkshire Hathaway Energy | $18.9 | 8% |
| Manufacturing | $50.4 | 21% |
| McLane Company | $49.8 | 21% |
| Service and Retailing | $26.3 | 11% |
| Finance | $8.4 | 3% |
| Total | $240.7 | 100% |
The Berkshire Portfolio
Berkshire Hathaway’s portfolio can be broken down into two categories: the companies it owns outright (or majority stakes in), and the companies it owns significant investments in.
Companies Owned by Berkshire
Berkshire Hathaway owns well-known brands ranging from Dairy Queen to Duracell. Here are all those companies listed by number of employees:
| Industry | Company | Employees |
|---|---|---|
| Finance | Clayton Homes | 16,362 |
| Insurance | GEICO | 38,690 |
| Manufacturing | Precision Castparts | 31,984 |
| Manufacturing | Fruit of the Loom | 26,219 |
| Manufacturing | Shaw Industries | 21,867 |
| Manufacturing | The Marmon Group | 12,763 |
| Manufacturing | Forest River | 12,185 |
| Manufacturing | Duracell | 2,875 |
| Manufacturing | Benjamin Moore | 1,772 |
| Manufacturing | Russell Athletic | 1,020 |
| Manufacturing | Brooks Sports | 638 |
| Railroad and Utilities | BNSF Railways | 41,000 |
| Railroad and Utilities | Berkshire Hathaway Energy | 22,773 |
| Service and Retailing | McLane Company | 23,859 |
| Service and Retailing | NetJets | 6,314 |
| Service and Retailing | BH Media Group | 3,719 |
| Service and Retailing | See’s Candies | 2,439 |
| Service and Retailing | Helzberg Diamonds | 2,252 |
| Service and Retailing | The Buffalo News | 618 |
| Service and Retailing | Business Wire | 486 |
| Service and Retailing | Dairy Queen | 464 |
| n/a | Berkshire Hathaway Corporate Office | 26 |
| n/a | Other | 106,966 |
| Total | 377,291 |
Importantly, you’ll notice that there are only 26 employees in Berkshire Hathaway’s corporate office – that’s because Buffett is adamant that portfolio companies need to be well-managed in their own right, and he thinks this decentralization is a key to his success.
Investments
Here are the companies Berkshire Hathaway has significant investments in – the whole portfolio is worth nearly $200 billion:
| Company | Value (Billions) | % of Portfolio |
|---|---|---|
| Apple | 28.0 | 14.6% |
| Wells Fargo | 27.8 | 14.5% |
| Kraft Heinz | 25.3 | 13.2% |
| Bank of America | 20.0 | 10.5% |
| Coca Cola | 18.4 | 9.6% |
| American Express | 15.1 | 7.9% |
| Phillips 66 | 8.2 | 4.3% |
| U.S. Bancorp | 4.7 | 2.5% |
| Moody's | 3.6 | 1.9% |
| Bank of NY Mellon | 3.3 | 1.7% |
| Southwest Airlines | 3.1 | 1.6% |
| Delta Airlines | 3.0 | 1.6% |
| Charter Communications | 2.9 | 1.5% |
| Goldman Sachs | 2.8 | 1.5% |
| American Airlines | 2.4 | 1.3% |
| GM | 2.0 | 1.0% |
| Monsanto | 1.4 | 0.7% |
| Visa | 1.2 | 0.6% |
| Other | 18.0 | 9.4% |
| Total | 191.2 | 100.0% |
The portfolio is pretty much a microcosm of the American economy: it features banks, airlines, consumer goods companies, and even tech behemoths like Apple.
Other Brands
Lastly, it’s worth noting that Buffett doesn’t stop there – his company also owns 80 auto dealerships, the second-largest real estate broker in the country (HomeServices of America), and even 32 daily newspapers.
Deals that Made the Empire
The Warren Buffett Empire wouldn’t exist without Buffett being involved in some of most famous deals in business history. Below are some of the big names Buffett has been involved with.
ABC
Buffett helped finance the Capital Cities takeover of ABC – at the time, the largest non-oil merger in history. Eventually, CapCities/ABC was sold to Disney.
ESPN
Before ESPN was the household name it is today, Buffett owned a big chunk of it as an upstart sports brand in 1985, as a part of the CapCities/ABC deal.
Heinz
Berkshire Hathaway and 3G Capital led a takeover of Heinz in 2013. This gave Buffett control of trusted brands like HP Sauce, Lea & Perrins, as well as the namesake brand.
Washington Post
Buffett delivered the newspaper as a kid, but later in his life would be the largest outside shareholder of the famous paper.
Salomon Brothers
Buffett helped lead a desperate shakeup at one of Wall Street’s most famous investment banks.
USAir
After almost losing all the $358 million he had invested, Buffett called buying preferred shares in the airline one of his biggest mistakes.
Gillette
Buffett started buying shares in the last 1980s, and became Gillette’s biggest shareholder. Buffett made $4.4 billion in paper profit when it sold the company to Proctor & Gamble.


Investor Education
How MSCI Builds Thematic Indexes: A Step-by-Step Guide
From developing an index objective to choosing relevant stocks, this graphic breaks down how MSCI builds thematic indexes using examples.


How MSCI Builds Thematic Indexes: A Step-by-Step Guide
Have you ever wondered how MSCI builds its thematic indexes?
To capture long-term, structural trends that could drive business performance in the future, the company follows a systematic approach. This graphic from MSCI breaks down each step in the process used to create its thematic indexes.
Step 1: Develop an Index Objective
MSCI first builds a broad statement of what the theme aims to capture based on extensive research and insights from industry experts.
Steps 2 and 3: List Sub-Themes, Generate Keyword List
Together with experts, MSCI creates a list of sub-themes or “seedwords” to identify aligned business activities.
The team then assembles a collection of suitable documents describing the theme. Natural language processing efficiently analyzes word frequency and relevance to generate a more detailed set of keywords contextually similar to the seedwords.
Step 4: Find Relevant Companies
By analyzing financial reports, MSCI picks companies relevant to the theme using two methods:
- Direct approach: Revenue from a company’s business segment is considered 100% relevant if the segment name matches a theme keyword. Standard Industrial Classification (SIC) codes from these directly-matched segments make up the eligible SIC code list used in the indirect approach.
- Indirect approach: If a segment name doesn’t match theme keywords, MSCI will:
- Analyze the density of theme keywords mentioned in the company’s description. A minimum of two unique keywords is required.
- The keyword density determines a “discount factor” to reflect lower certainty in theme alignment.
- Revenue from business segments with an eligible SIC code, regardless of how they are named, is scaled down by the discount factor.
The total percentage of revenue applicable to the theme from both approaches determines a company’s relevance score.
Step 5: Select the Stocks
Finally, MSCI narrows down the stocks that will be included:
- Global parent universe: The ACWI Investable Market Index (IMI) is the starting point for standard thematic indexes.
- Relevance filter: The universe is filtered for companies with a relevance score of at least 25%.
- False positive control: Eligible companies that are mapped to un-related GICS sub-industries are removed.
Companies with higher relevance scores and market caps have a higher weighting in the index, with the maximum weighting for any one issuer capped at 5%. The final selected stocks span various sectors.
MSCI Thematic Indexes: Regularly Updated and Rules-Based
Once an index is built, it is reviewed semi-annually and updated based on:
- Changes to the parent index
- Changes at individual companies
- Theme developments based on expert input
Theme keywords are reviewed yearly in May. Overall, MSCI’s thematic index construction process is objective, scalable, and flexible. The process can be customized based on the theme(s) you want to capture.
Learn more about MSCI’s thematic indexes.

-

 Investor Education6 months ago
The 20 Most Common Investing Mistakes, in One Chart
Here are the most common investing mistakes to avoid, from emotionally-driven investing to paying too much in fees.
-

 Stocks10 months ago
Visualizing BlackRock’s Top Equity Holdings
BlackRock is the world’s largest asset manager, with over $9 trillion in holdings. Here are the company’s top equity holdings.
-

 Investor Education11 months ago
10-Year Annualized Forecasts for Major Asset Classes
This infographic visualizes 10-year annualized forecasts for both equities and fixed income using data from Vanguard.
-

 Investor Education1 year ago
Visualizing 90 Years of Stock and Bond Portfolio Performance
How have investment returns for different portfolio allocations of stocks and bonds compared over the last 90 years?
-

 Debt2 years ago
Countries with the Highest Default Risk in 2022
In this infographic, we examine new data that ranks the top 25 countries by their default risk.
-

 Markets2 years ago
The Best Months for Stock Market Gains
This infographic analyzes over 30 years of stock market performance to identify the best and worst months for gains.


-

 Mining1 week ago
Gold vs. S&P 500: Which Has Grown More Over Five Years?
-

 Markets2 weeks ago
Ranked: The Most Valuable Housing Markets in America
-

 Money2 weeks ago
Which States Have the Highest Minimum Wage in America?
-

 AI2 weeks ago
Ranked: Semiconductor Companies by Industry Revenue Share
-

 Markets2 weeks ago
Ranked: The World’s Top Flight Routes, by Revenue
-

 Countries2 weeks ago
Population Projections: The World’s 6 Largest Countries in 2075
-

 Markets2 weeks ago
The Top 10 States by Real GDP Growth in 2023
-

 Demographics2 weeks ago
The Smallest Gender Wage Gaps in OECD Countries