Misc
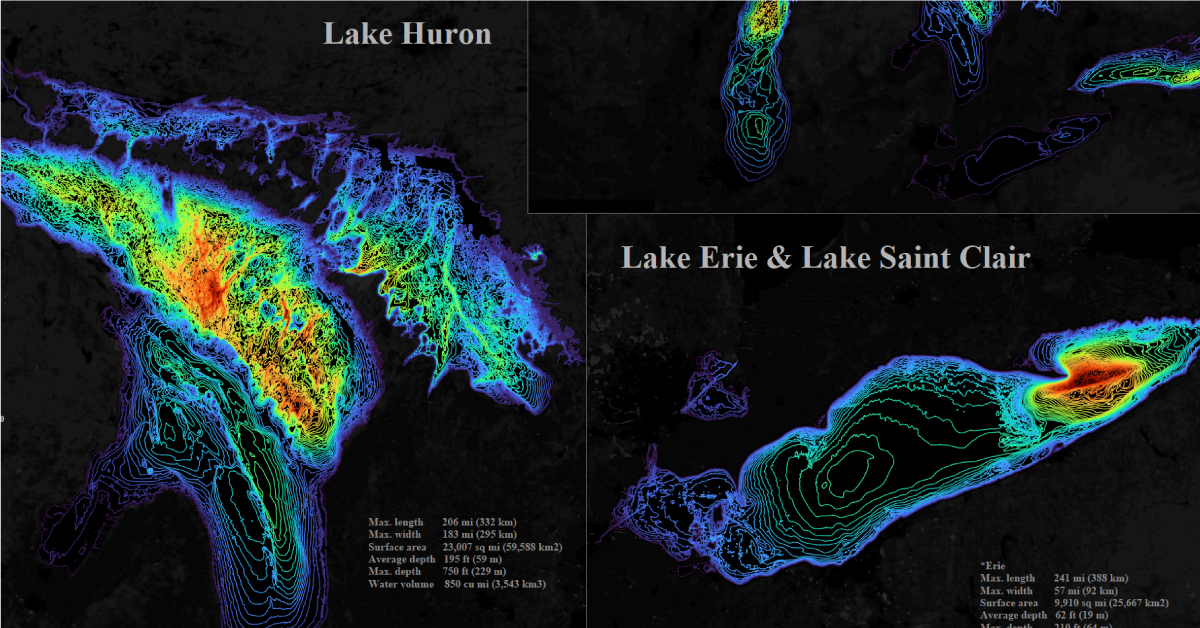
Visualizing the Depth of the Great Lakes
View the full-resolution version of this infographic
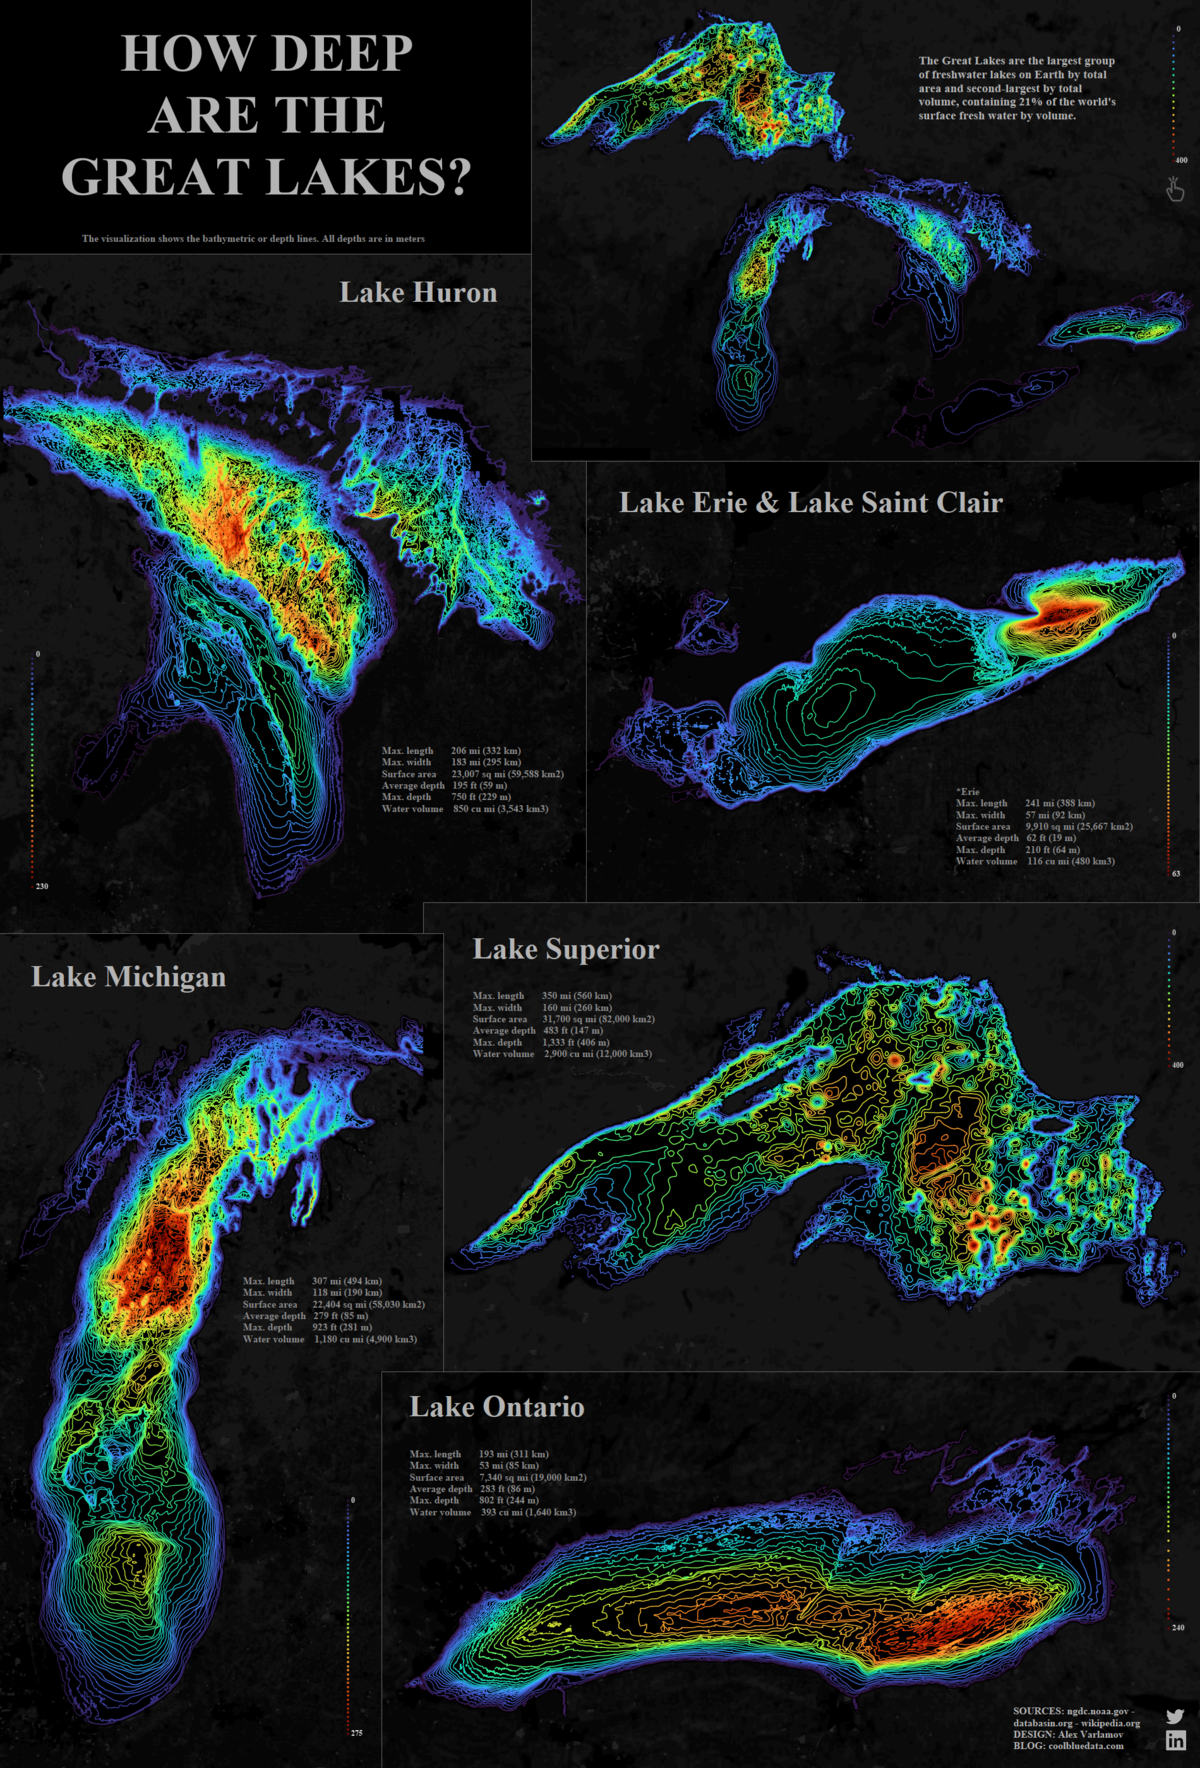
Visualized: The Depth of The Great Lakes
Click here to view the interactive version of the visualization on Tableau.
As the seasons change, it’s natural to want to enjoy the outdoors to the fullest. The Great Lakes, a distinct geographical region sandwiched between the U.S. and Canada, provides immense opportunity for millions of tourists to do just that every year.
But did you know that altogether the Great Lakes contain 21% of the world’s surface freshwater by volume—or 84% of the surface freshwater in North America?
This bathymetric visualization, created by Alex Varlamov, helps put the sheer size and depth of all five of the Great Lakes into perspective.
What is Bathymetry?
Bathymetry is the study of the underwater depth of ocean or lake floors, a geographical science that falls under the wider umbrella of hydrography.
In essence, it is the underwater equivalent of topography. Contour lines help to represent and study the physical features of bodies of water, from oceans to lakes.
Most bathymetric studies are conducted via sonar systems, transmitting pulses that ‘ping’ off the ocean and lake floor, uncovering what lies below.
The Depth of the Great Lakes, Compared
High on the list of the world’s largest lakes, the five Great Lakes altogether account for over 244,700 km² (94,250 mi²) in total surface area. That’s bigger than the entire United Kingdom.
Lake Superior emerges, well, superior in terms of total surface area, water volume, and both average and maximum depth.
| Surface area | Water volume | Average depth | Maximum depth | |
|---|---|---|---|---|
| Lake Ontario | 19,000 km² (7,340 mi²) | 1,640 km³ (393 mi³) | 86 m (283 ft) | 245 m (804 ft) |
| Lake Erie | 25,700 km² (9,910 mi²) | 480 km³ (116 mi³) | 19 m (62 ft) | 64 m (210 ft) |
| Lake Michigan | 58,000 km² (22,300 mi²) | 4,900 km³ (1,180 mi³) | 85 m (279 ft) | 282 m (925 ft) |
| Lake Huron | 60,000 km² (23,000 mi²) | 3,500 km³ (850 mi³) | 59 m (195 ft) | 228 m (748 ft) |
| Lake Superior | 82,000 km² (31,700 mi²) | 12,000 km³ (2,900 mi³) | 147 m (483 ft) | 406 m (1,333 ft) |
Lake Erie is by far the shallowest of the lakes, with an average depth of just 19 meters (62 ft). That means on average, Lake Superior is about eight times deeper.
With that in mind, one drawback of the visualization is that it doesn’t provide an accurate view of how deep these lakes are in relation to one another.
For that, check out this additional visualization also created by Alex Varlamov, which is scaled to the same 20 meter step—in this view, Lake Erie practically disappears.
More than Meets the Eye
The Great Lakes are not only notable for their form, but also their function—they’re a crucial waterway contributing to the economy of the area, supporting over 50 million jobs and contributing $6 trillion to gross domestic product (GDP).
Together, the five Great Lakes feed into the Atlantic Ocean—and when we expand the scope to compare these lakes to vast oceans, trenches, and drill holes, the depth of the Great Lakes barely scratches the surface.


Misc
The Top 25 Nationalities of U.S. Immigrants
Mexico is the largest source of immigrants to the U.S., with almost 11 million immigrants.


The Top 25 Nationalities of U.S. Immigrants
This was originally posted on our Voronoi app. Download the app for free on iOS or Android and discover incredible data-driven charts from a variety of trusted sources.
The United States is home to more than 46 million immigrants, constituting approximately 14% of its total population.
This graphic displays the top 25 countries of origin for U.S. immigrants, based on 2022 estimates. The data is sourced from the Migration Policy Institute (MPI), which analyzed information from the U.S. Census Bureau’s 2022 American Community Survey.
In this context, “immigrants” refer to individuals residing in the United States who were not U.S. citizens at birth.
Mexico Emerges as a Leading Source of Immigration
Mexico stands out as the largest contributor to U.S. immigration due to its geographical proximity and historical ties.
Various economic factors, including wage disparities and employment opportunities, motivate many Mexicans to seek better prospects north of the border.
| Country | Region | # of Immigrants |
|---|---|---|
| 🇲🇽 Mexico | Latin America & Caribbean | 10,678,502 |
| 🇮🇳 India | Asia | 2,839,618 |
| 🇨🇳 China | Asia | 2,217,894 |
| 🇵🇭 Philippines | Asia | 1,982,333 |
| 🇸🇻 El Salvador | Latin America & Caribbean | 1,407,622 |
| 🇻🇳 Vietnam | Asia | 1,331,192 |
| 🇨🇺 Cuba | Latin America & Caribbean | 1,312,510 |
| 🇩🇴 Dominican Republic | Latin America & Caribbean | 1,279,900 |
| 🇬🇹 Guatemala | Latin America & Caribbean | 1,148,543 |
| 🇰🇷 Korea | Asia | 1,045,100 |
| 🇨🇴 Colombia | Latin America & Caribbean | 928,053 |
| 🇭🇳 Honduras | Latin America & Caribbean | 843,774 |
| 🇨🇦 Canada | Northern America | 821,322 |
| 🇯🇲 Jamaica | Latin America & Caribbean | 804,775 |
| 🇭🇹 Haiti | Latin America & Caribbean | 730,780 |
| 🇬🇧 United Kingdom | Europe | 676,652 |
| 🇻🇪 Venezuela | Latin America & Caribbean | 667,664 |
| 🇧🇷 Brazil | Latin America & Caribbean | 618,525 |
| 🇩🇪 Germany | Europe | 537,484 |
| 🇪🇨 Ecuador | Latin America & Caribbean | 518,287 |
| 🇵🇪 Peru | Latin America & Caribbean | 471,988 |
| 🇳🇬 Nigeria | Africa | 448,405 |
| 🇺🇦 Ukraine | Europe | 427,163 |
| 🇮🇷 Iran | Middle East | 407,283 |
| 🇵🇰 Pakistan | Asia | 399,086 |
| Rest of World | 11,637,634 | |
| Total | 46,182,089 |
Mexicans are followed in this ranking by Indians, Chinese, and Filipinos, though most immigrants on this list come from countries in the Latin American and Caribbean region.
On the other hand, only three European countries are among the top sources of U.S. immigrants: the UK, Germany, and Ukraine.
Immigration continues to be a significant factor contributing to the overall growth of the U.S. population. Overall population growth has decelerated over the past decade primarily due to declining birth rates.
Between 2021 and 2022, the increase in the immigrant population accounted for 65% of the total population growth in the U.S., representing 912,000 individuals out of nearly 1.4 million.
If you enjoyed this post, be sure to check out Visualized: Why Do People Immigrate to the U.S.? This visualization shows the different reasons cited by new arrivals to America in 2021.

-

 Personal Finance1 week ago
Visualizing the Tax Burden of Every U.S. State
-

 Misc6 days ago
Visualized: Aircraft Carriers by Country
-

 Culture6 days ago
How Popular Snack Brand Logos Have Changed
-

 Mining1 week ago
Visualizing Copper Production by Country in 2023
-

 Misc1 week ago
Charted: How Americans Feel About Federal Government Agencies
-

 Healthcare1 week ago
Which Countries Have the Highest Infant Mortality Rates?
-

 Demographics1 week ago
Mapped: U.S. Immigrants by Region
-

 Maps1 week ago
Mapped: Southeast Asia’s GDP Per Capita, by Country