Misc
Box Office Blockbusters: The Top Grossing Movies in the Last 30 Years
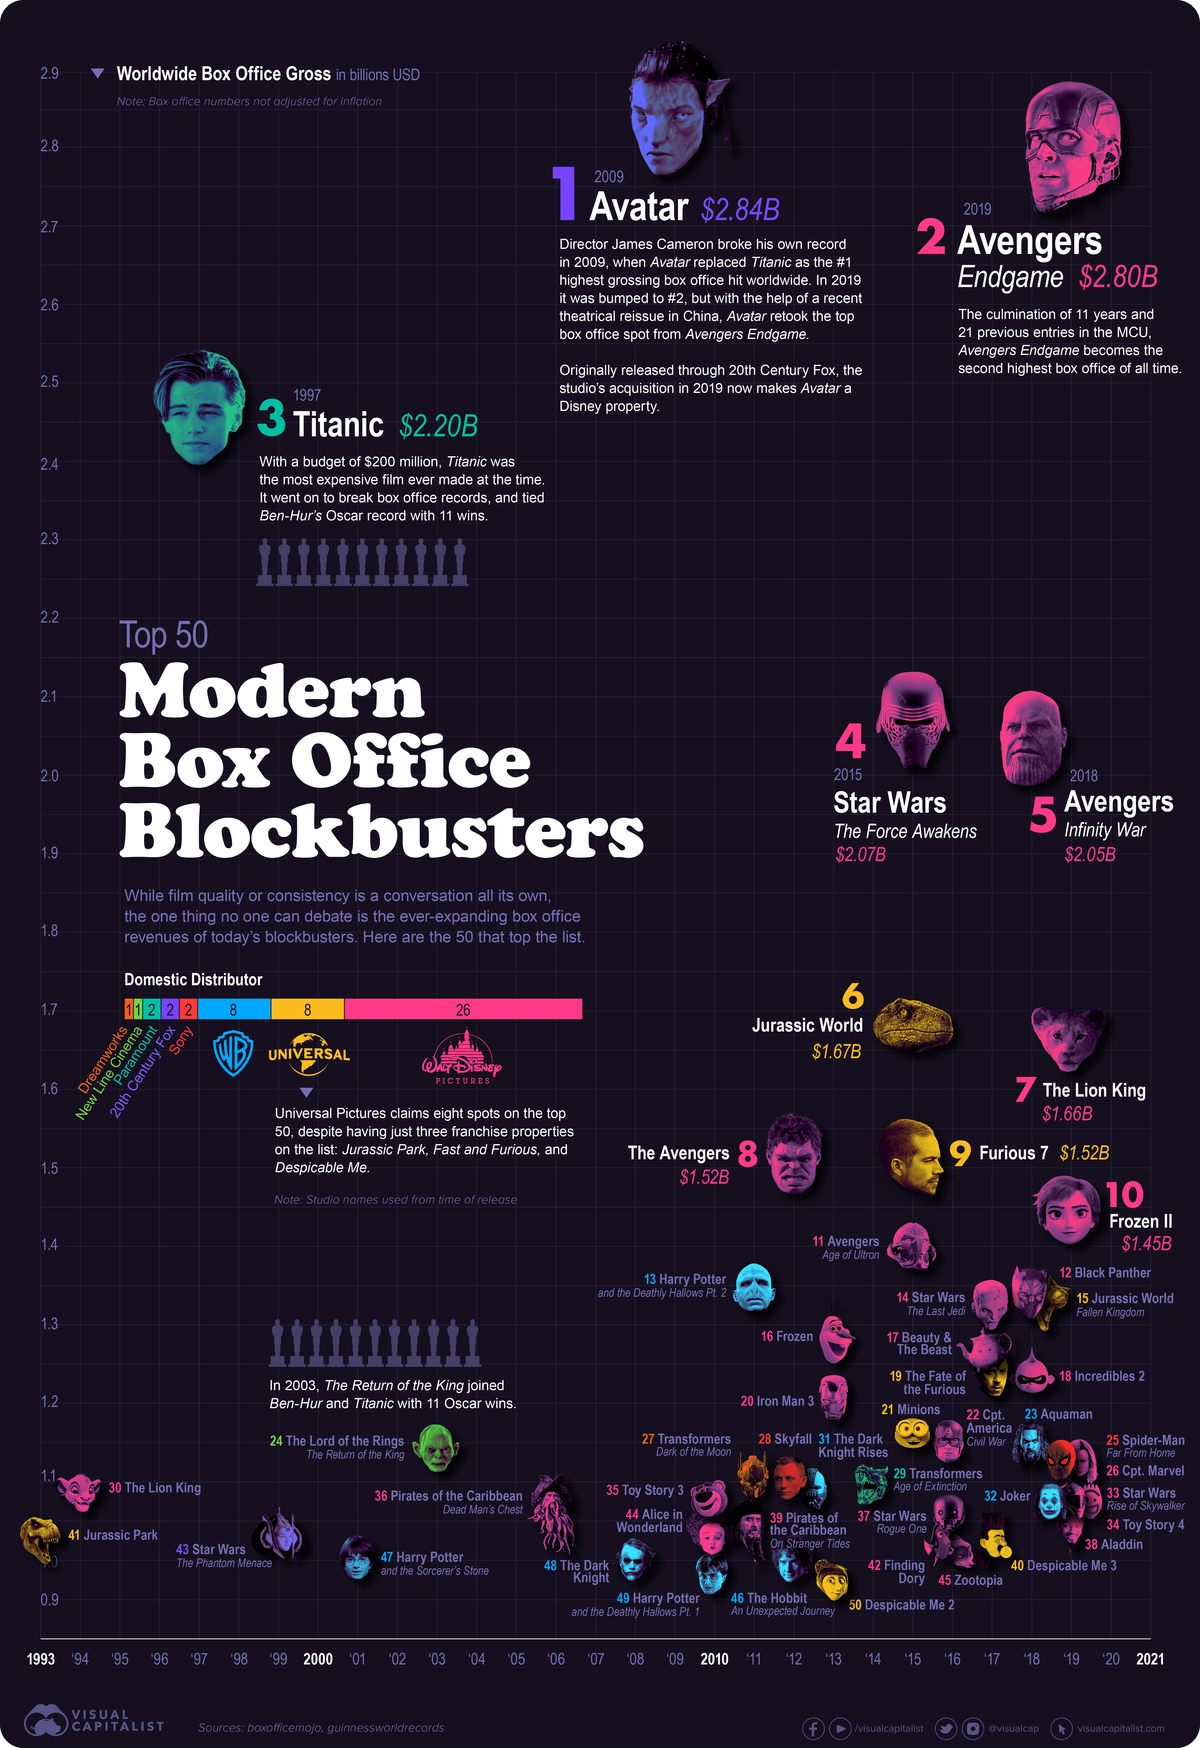


The Top Grossing Movies in the Last 30 Years
People have varying opinions on what constitutes a good movie. And while it’s nearly impossible to identify a film’s intrinsic quality—at least, in an objective way—one thing that can be measured is the revenue that a movie generates.
With this in mind, here’s a look at the top grossing movies worldwide since the early 1990s, using data from Box Office Mojo. These figures include box office revenue as of May 2021, but don’t consider other revenue sources like merchandise sales.
The Full List: Top 50 Highest Grossing Movies
Coming in at number one on the list is Avatar—since its release in 2009, this Oscar-winning hit has grossed $2.84 billion in box office sales.
| Rank | Title | Lifetime Gross | Year |
|---|---|---|---|
| 1 | Avatar | $2,847,246,203 | 2009 |
| 2 | Avengers: Endgame | $2,797,501,328 | 2019 |
| 3 | Titanic | $2,201,647,264 | 1997 |
| 4 | Star Wars: Episode VII - The Force Awakens | $2,068,455,677 | 2015 |
| 5 | Avengers: Infinity War | $2,048,359,754 | 2018 |
| 6 | Jurassic World | $1,670,516,444 | 2015 |
| 7 | The Lion King | $1,657,870,986 | 2019 |
| 8 | The Avengers | $1,518,815,515 | 2012 |
| 9 | Furious 7 | $1,515,255,622 | 2015 |
| 10 | Frozen II | $1,450,026,933 | 2019 |
| 11 | Avengers: Age of Ultron | $1,402,809,540 | 2015 |
| 12 | Black Panther | $1,347,597,973 | 2018 |
| 13 | Harry Potter and the Deathly Hallows: Part 2 | $1,342,321,665 | 2011 |
| 14 | Star Wars: Episode VIII - The Last Jedi | $1,332,698,830 | 2017 |
| 15 | Jurassic World: Fallen Kingdom | $1,310,464,680 | 2018 |
| 16 | Frozen | $1,281,835,246 | 2013 |
| 17 | Beauty and the Beast | $1,264,434,525 | 2017 |
| 18 | Incredibles 2 | $1,243,089,244 | 2018 |
| 19 | The Fate of the Furious | $1,236,005,118 | 2017 |
| 20 | Iron Man 3 | $1,214,811,252 | 2013 |
| 21 | Minions | $1,159,444,662 | 2015 |
| 22 | Captain America: Civil War | $1,153,337,496 | 2016 |
| 23 | Aquaman | $1,148,485,886 | 2018 |
| 24 | The Lord of the Rings: The Return of the King | $1,142,630,912 | 2003 |
| 25 | Spider-Man: Far from Home | $1,131,927,996 | 2019 |
| 26 | Captain Marvel | $1,128,462,972 | 2019 |
| 27 | Transformers: Dark of the Moon | $1,123,794,079 | 2011 |
| 28 | Skyfall | $1,108,569,499 | 2012 |
| 29 | Transformers: Age of Extinction | $1,104,054,072 | 2014 |
| 30 | The Lion King | $1,083,720,877 | 1994 |
| 31 | The Dark Knight Rises | $1,081,142,612 | 2012 |
| 32 | Joker | $1,074,251,311 | 2019 |
| 33 | Star Wars: Episode IX - The Rise of Skywalker | $1,074,148,486 | 2019 |
| 34 | Toy Story 4 | $1,073,394,593 | 2019 |
| 35 | Toy Story 3 | $1,066,970,811 | 2010 |
| 36 | Pirates of the Caribbean: Dead Man's Chest | $1,066,179,747 | 2006 |
| 37 | Rogue One: A Star Wars Story | $1,056,057,720 | 2016 |
| 38 | Aladdin | $1,050,693,953 | 2019 |
| 39 | Pirates of the Caribbean: On Stranger Tides | $1,045,713,802 | 2011 |
| 40 | Despicable Me 3 | $1,034,800,131 | 2017 |
| 41 | Jurassic Park | $1,033,928,303 | 1993 |
| 42 | Finding Dory | $1,028,570,942 | 2016 |
| 43 | Star Wars: Episode I - The Phantom Menace | $1,027,082,707 | 1999 |
| 44 | Alice in Wonderland | $1,025,468,216 | 2010 |
| 45 | Zootopia | $1,023,792,558 | 2016 |
| 46 | The Hobbit: An Unexpected Journey | $1,017,003,568 | 2012 |
| 47 | Harry Potter and the Sorcerer's Stone | $1,006,968,171 | 2001 |
| 48 | The Dark Knight | $1,005,973,645 | 2008 |
| 49 | Harry Potter and the Deathly Hallows: Part 1 | $977,043,483 | 2010 |
| 50 | Despicable Me 2 | $970,766,005 | 2013 |
Avatar cost $237 million to produce, meaning it’s turned a considerable profit over the years. But Avatar’s success was fairly unsurprising, considering the stellar track record of the film’s writer and director, James Cameron.
Cameron also directed Titanic, which broke records back in 1998 when it became the first film to break $1 billion in worldwide box office revenue. In fact, Titanic was the top grossing movie for years, until Avatar stole its title in 2009.
Interestingly, in 2019, Avatar was temporarily dethroned by Avengers: Endgame, which held the number one spot for a couple of years. But thanks to a recent theatrical reissue in China (which alone grossed an estimated $21.1 million) Avatar has since reclaimed its title as the top grossing movie worldwide.
Avengers: Endgame remains a close second, with $2.80 billion in gross revenue. It’s one of 23 films in the Marvel Cinematic Universe (MCU) and besides Endgame, eight other movies from the MCU also appear on the top grossing movies list:
- Avengers: Infinity War – #5
- The Avengers – #8
- Avengers: Age of Ultron – #11
- Black Panther – #12
- Iron Man 3 – #20
- Captain America: Civil War – #22
- Spider-man: Far From Home – #25
- Captain Marvel – #26
Disney acquired Marvel Entertainment back in 2009. And while Marvel honored its existing contracts with other distributors, Disney owns the lion’s share of Marvel film rights and has earned over $18.2 billion as a result.
The Top Distributors
Marvel movies aren’t the only Disney productions to make the list. In fact, 26 of the 50 top grossing films were originally released by Disney, making it the top distributor.
| Rank | Film Studio | # of Top Grossing Titles |
|---|---|---|
| 1 | Disney | 26 |
| 2 | Universal Studios | 8 |
| 3 | Warner Bros | 8 |
| 4 | 20th Century Fox | 2 |
| 5 | Paramount | 2 |
| 6 | New Line Cinema | 1 |
| 7 | Dreamworks | 1 |
| 8 | Sony | 2 |
Warner Bros. and Universal Pictures tie for second. Warner Bros. was the domestic distributor of some pop culture classics like Harry Potter, The Dark Knight, and The Hobbit, while Universal Pictures released Fast and Furious, Despicable Me, and Jurassic Park.
It’s worth mentioning that several of the distributors on the list are labels of larger studios. For instance, Warner Bros. is the parent company of New Line Cinema, Dreamworks is a branch of Universal, and 20th Century Fox was recently bought by Disney and rebranded to 20th Century Studios.
The COVID-19 Impact
The entertainment business was significantly impacted by the global pandemic, like many other industries across the globe. In 2020, global box office revenue totaled $12.4 billion—a 70% dip from 2019.
Despite recent setbacks, industry professionals are feeling confident that things will recover post-pandemic. In a recent interview with The Deadline, Chairman of STXfilms Adam Fogelson said, “People like leaving their homes and having fun, emotional, communal experiences together…I don’t think that will change.”


Misc
The Top 25 Nationalities of U.S. Immigrants
Mexico is the largest source of immigrants to the U.S., with almost 11 million immigrants.


The Top 25 Nationalities of U.S. Immigrants
This was originally posted on our Voronoi app. Download the app for free on iOS or Android and discover incredible data-driven charts from a variety of trusted sources.
The United States is home to more than 46 million immigrants, constituting approximately 14% of its total population.
This graphic displays the top 25 countries of origin for U.S. immigrants, based on 2022 estimates. The data is sourced from the Migration Policy Institute (MPI), which analyzed information from the U.S. Census Bureau’s 2022 American Community Survey.
In this context, “immigrants” refer to individuals residing in the United States who were not U.S. citizens at birth.
Mexico Emerges as a Leading Source of Immigration
Mexico stands out as the largest contributor to U.S. immigration due to its geographical proximity and historical ties.
Various economic factors, including wage disparities and employment opportunities, motivate many Mexicans to seek better prospects north of the border.
| Country | Region | # of Immigrants |
|---|---|---|
| 🇲🇽 Mexico | Latin America & Caribbean | 10,678,502 |
| 🇮🇳 India | Asia | 2,839,618 |
| 🇨🇳 China | Asia | 2,217,894 |
| 🇵🇭 Philippines | Asia | 1,982,333 |
| 🇸🇻 El Salvador | Latin America & Caribbean | 1,407,622 |
| 🇻🇳 Vietnam | Asia | 1,331,192 |
| 🇨🇺 Cuba | Latin America & Caribbean | 1,312,510 |
| 🇩🇴 Dominican Republic | Latin America & Caribbean | 1,279,900 |
| 🇬🇹 Guatemala | Latin America & Caribbean | 1,148,543 |
| 🇰🇷 Korea | Asia | 1,045,100 |
| 🇨🇴 Colombia | Latin America & Caribbean | 928,053 |
| 🇭🇳 Honduras | Latin America & Caribbean | 843,774 |
| 🇨🇦 Canada | Northern America | 821,322 |
| 🇯🇲 Jamaica | Latin America & Caribbean | 804,775 |
| 🇭🇹 Haiti | Latin America & Caribbean | 730,780 |
| 🇬🇧 United Kingdom | Europe | 676,652 |
| 🇻🇪 Venezuela | Latin America & Caribbean | 667,664 |
| 🇧🇷 Brazil | Latin America & Caribbean | 618,525 |
| 🇩🇪 Germany | Europe | 537,484 |
| 🇪🇨 Ecuador | Latin America & Caribbean | 518,287 |
| 🇵🇪 Peru | Latin America & Caribbean | 471,988 |
| 🇳🇬 Nigeria | Africa | 448,405 |
| 🇺🇦 Ukraine | Europe | 427,163 |
| 🇮🇷 Iran | Middle East | 407,283 |
| 🇵🇰 Pakistan | Asia | 399,086 |
| Rest of World | 11,637,634 | |
| Total | 46,182,089 |
Mexicans are followed in this ranking by Indians, Chinese, and Filipinos, though most immigrants on this list come from countries in the Latin American and Caribbean region.
On the other hand, only three European countries are among the top sources of U.S. immigrants: the UK, Germany, and Ukraine.
Immigration continues to be a significant factor contributing to the overall growth of the U.S. population. Overall population growth has decelerated over the past decade primarily due to declining birth rates.
Between 2021 and 2022, the increase in the immigrant population accounted for 65% of the total population growth in the U.S., representing 912,000 individuals out of nearly 1.4 million.
If you enjoyed this post, be sure to check out Visualized: Why Do People Immigrate to the U.S.? This visualization shows the different reasons cited by new arrivals to America in 2021.

-

 Personal Finance1 week ago
Visualizing the Tax Burden of Every U.S. State
-

 Misc6 days ago
Visualized: Aircraft Carriers by Country
-

 Culture7 days ago
How Popular Snack Brand Logos Have Changed
-

 Mining1 week ago
Visualizing Copper Production by Country in 2023
-

 Misc1 week ago
Charted: How Americans Feel About Federal Government Agencies
-

 Healthcare1 week ago
Which Countries Have the Highest Infant Mortality Rates?
-

 Demographics1 week ago
Mapped: U.S. Immigrants by Region
-

 Maps1 week ago
Mapped: Southeast Asia’s GDP Per Capita, by Country