Markets
Mapped: The Top Global Financial Centers in 2023
Subscribe to the Advisor Channel free mailing list for more like this
The Top Global Financial Centers in 2023
This was originally posted on Advisor Channel. Sign up to the free mailing list to get beautiful visualizations on financial markets that help advisors and their clients.
For centuries, global financial centers have served as a linchpin for capital market activity.
These hubs share important features, from the infrastructure to facilitate billions of transactions to the regulatory framework to promote more transparent markets. As economies have evolved, so have centers for global business—however the transition can shift slowly.
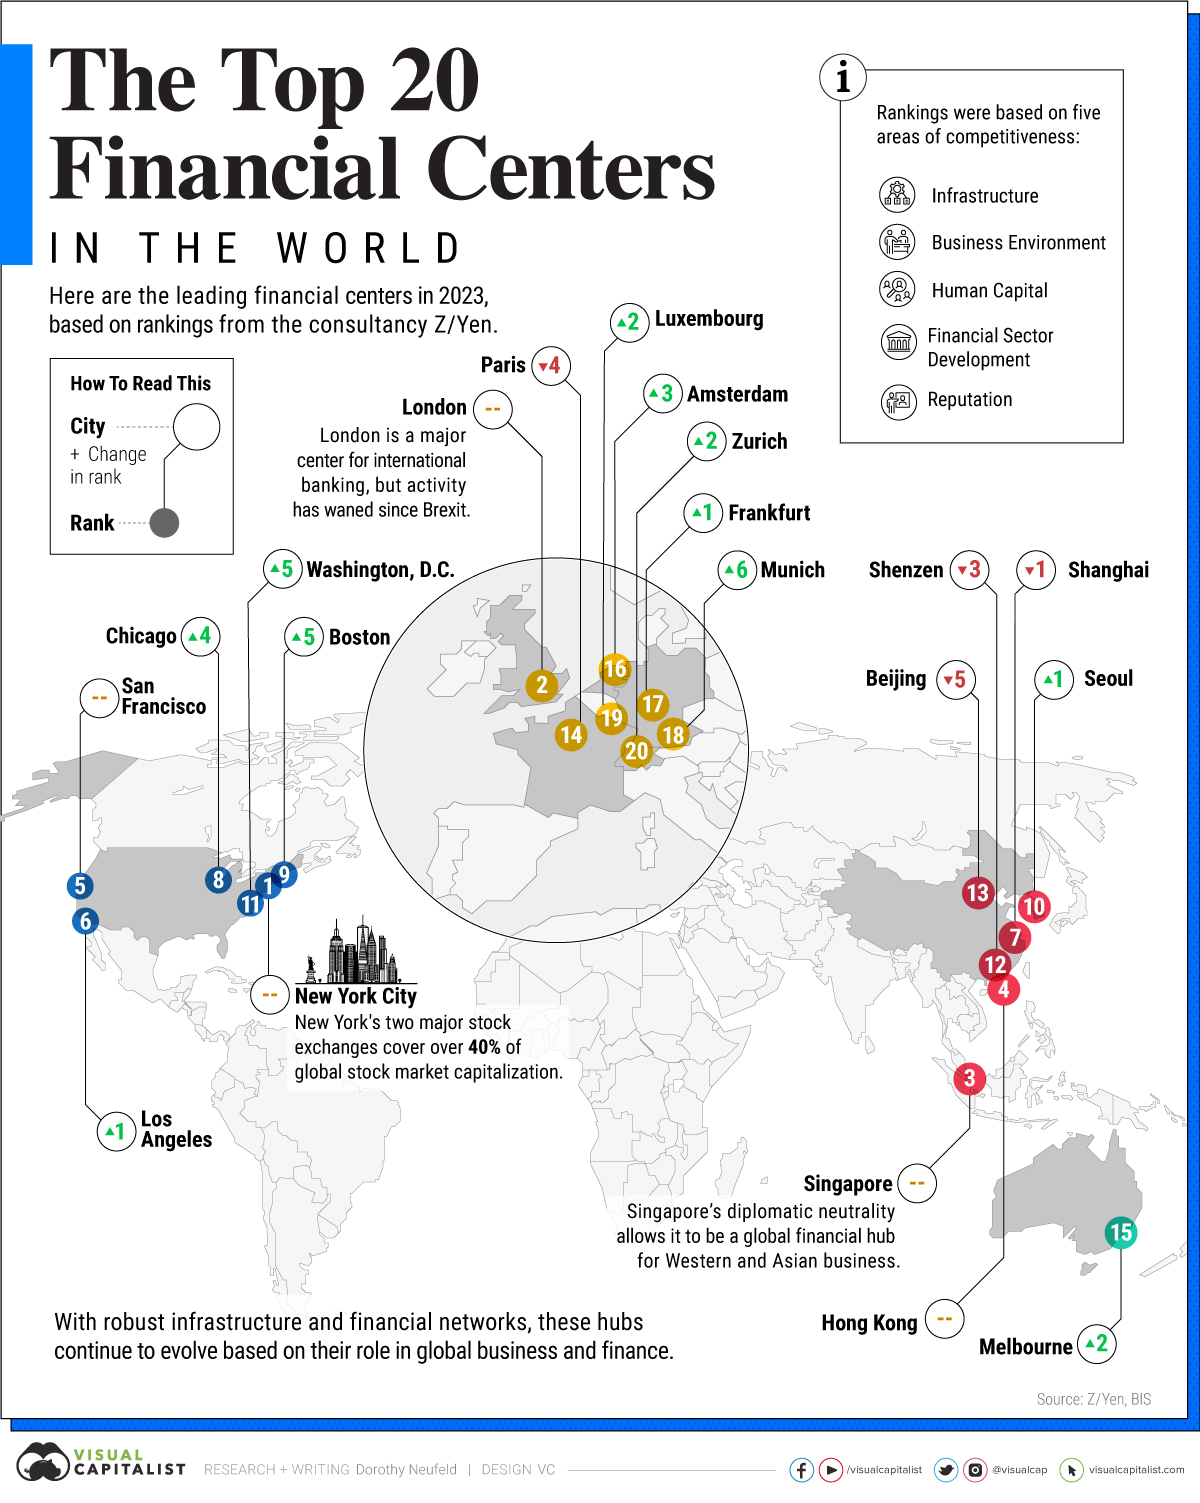
This graphic shows the top global financial centers in 2023, based on rankings from the consultancy group Z/Yen.
How Cities Were Ranked
To analyze the strength of each financial center, Z/Yen looked at the following areas of competitiveness:
- Financial Sector Development
- Business Environment
- Human Capital
- Infrastructure
- Reputation
Each of these categories has four subcomponents, which altogether arrive at a cities score.
The World’s Leading Financial Centers
In 2023, New York remained the epicenter for global finance.
With $46 trillion in stock market capitalization, it captures 40% of the world’s total, thanks to the depth and liquidity of its markets. Domestic and international companies look to list on its exchanges due to their broad investor base.
Roughly 330,000 people work in financial services, however, financial firms are increasingly moving out of the city. Since the end of 2019, $993 billion in assets across 158 companies have moved headquarters driven by lower taxes in other states.
| Ranking | Financial Center | Country | Change in Rank 2022-2023 |
|---|---|---|---|
| 1 | New York | 🇺🇸 U.S. | +0 |
| 2 | London | 🇬🇧 UK | +0 |
| 3 | Singapore | 🇸🇬 Singapore | +0 |
| 4 | Hong Kong SAR | 🇭🇰 Hong Kong SAR | +0 |
| 5 | San Francisco | 🇺🇸 U.S. | +0 |
| 6 | Los Angeles | 🇺🇸 U.S. | +1 |
| 7 | Shanghai | 🇨🇳 China | -1 |
| 8 | Chicago | 🇺🇸 U.S. | +4 |
| 9 | Boston | 🇺🇸 U.S. | +5 |
| 10 | Seoul | 🇰🇷 South Korea | +1 |
| 11 | Washington DC | 🇺🇸 U.S. | +4 |
| 12 | Shenzhen | 🇨🇳 China | -3 |
| 13 | Beijing | 🇨🇳 China | -5 |
| 14 | Paris | 🇫🇷 France | -4 |
| 15 | Sydney | 🇦🇺 Australia | -2 |
| 16 | Amsterdam | 🇳🇱 Netherlands | +3 |
| 17 | Frankfurt | 🇩🇪 Germany | +1 |
| 18 | Munich | 🇩🇪 Germany | +6 |
| 19 | Luxembourg | 🇱🇺 Luxembourg | +2 |
| 20 | Zurich | 🇨🇭 Switzerland | +2 |
London ranked second given its role as an investment banking and foreign-exchange trading hub. While it remains a dominant center, international banking has waned since Brexit as business has shifted to the euro area.
With a population of six million people, Singapore fell in third. Its diplomatic neutrality allows Asian and Western companies to conduct business in the country, operating as the “Switzerland of Asia”. Tech giants from Google to Alibaba have their regional headquarters based in the commerce hub.
This year, Hong Kong ranked fourth, followed by San Francisco and Los Angeles.
Shanghai (7th) is home to the largest stock exchange in Asia, at $6.6 trillion. However, it fell in rank over the last year along with other major Chinese financial centers.
The Future of Global Financial Centers
Along with ranking the global centers of commerce, Z/Yen highlighted the top centers likely to grow in significance over the next two to three years.
Seoul featured at the top of this list, followed by Singapore and Kigali, Rwanda’s capital.
To attract foreign investors and expand its role as a financial center, Seoul has proposed new tax revisions that exempt income and corporate taxes for foreign companies for three years. While these are still in discussion, obstacles remain.
Overall, the majority of up-and-coming hubs were located in Asia, likely driven by the region’s increasing economic influence over the last several decades.


Markets
Mapped: Europe’s GDP Per Capita, by Country
Which European economies are richest on a GDP per capita basis? This map shows the results for 44 countries across the continent.


Mapped: Europe’s GDP Per Capita, by Country (2024)
This was originally posted on our Voronoi app. Download the app for free on iOS or Android and discover incredible data-driven charts from a variety of trusted sources.
Europe is home to some of the largest and most sophisticated economies in the world. But how do countries in the region compare with each other on a per capita productivity basis?
In this map, we show Europe’s GDP per capita levels across 44 nations in current U.S. dollars. Data for this visualization and article is sourced from the International Monetary Fund (IMF) via their DataMapper tool, updated April 2024.
Europe’s Richest and Poorest Nations, By GDP Per Capita
Luxembourg, Ireland, and Switzerland, lead the list of Europe’s richest nations by GDP per capita, all above $100,000.
| Rank | Country | GDP Per Capita (2024) |
|---|---|---|
| 1 | 🇱🇺 Luxembourg | $131,380 |
| 2 | 🇮🇪 Ireland | $106,060 |
| 3 | 🇨🇭 Switzerland | $105,670 |
| 4 | 🇳🇴 Norway | $94,660 |
| 5 | 🇮🇸 Iceland | $84,590 |
| 6 | 🇩🇰 Denmark | $68,900 |
| 7 | 🇳🇱 Netherlands | $63,750 |
| 8 | 🇸🇲 San Marino | $59,410 |
| 9 | 🇦🇹 Austria | $59,230 |
| 10 | 🇸🇪 Sweden | $58,530 |
| 11 | 🇧🇪 Belgium | $55,540 |
| 12 | 🇫🇮 Finland | $55,130 |
| 13 | 🇩🇪 Germany | $54,290 |
| 14 | 🇬🇧 UK | $51,070 |
| 15 | 🇫🇷 France | $47,360 |
| 16 | 🇦🇩 Andorra | $44,900 |
| 17 | 🇲🇹 Malta | $41,740 |
| 18 | 🇮🇹 Italy | $39,580 |
| 19 | 🇨🇾 Cyprus | $37,150 |
| 20 | 🇪🇸 Spain | $34,050 |
| 21 | 🇸🇮 Slovenia | $34,030 |
| 22 | 🇪🇪 Estonia | $31,850 |
| 23 | 🇨🇿 Czech Republic | $29,800 |
| 24 | 🇵🇹 Portugal | $28,970 |
| 25 | 🇱🇹 Lithuania | $28,410 |
| 26 | 🇸🇰 Slovakia | $25,930 |
| 27 | 🇱🇻 Latvia | $24,190 |
| 28 | 🇬🇷 Greece | $23,970 |
| 29 | 🇭🇺 Hungary | $23,320 |
| 30 | 🇵🇱 Poland | $23,010 |
| 31 | 🇭🇷 Croatia | $22,970 |
| 32 | 🇷🇴 Romania | $19,530 |
| 33 | 🇧🇬 Bulgaria | $16,940 |
| 34 | 🇷🇺 Russia | $14,390 |
| 35 | 🇹🇷 Türkiye | $12,760 |
| 36 | 🇲🇪 Montenegro | $12,650 |
| 37 | 🇷🇸 Serbia | $12,380 |
| 38 | 🇦🇱 Albania | $8,920 |
| 39 | 🇧🇦 Bosnia & Herzegovina | $8,420 |
| 40 | 🇲🇰 North Macedonia | $7,690 |
| 41 | 🇧🇾 Belarus | $7,560 |
| 42 | 🇲🇩 Moldova | $7,490 |
| 43 | 🇽🇰 Kosovo | $6,390 |
| 44 | 🇺🇦 Ukraine | $5,660 |
| N/A | 🇪🇺 EU Average | $44,200 |
Note: Figures are rounded.
Three Nordic countries (Norway, Iceland, Denmark) also place highly, between $70,000-90,000. Other Nordic peers, Sweden and Finland rank just outside the top 10, between $55,000-60,000.
Meanwhile, Europe’s biggest economies in absolute terms, Germany, UK, and France, rank closer to the middle of the top 20, with GDP per capitas around $50,000.
Finally, at the end of the scale, Eastern Europe as a whole tends to have much lower per capita GDPs. In that group, Ukraine ranks last, at $5,660.
A Closer Look at Ukraine
For a broader comparison, Ukraine’s per capita GDP is similar to Iran ($5,310), El Salvador ($5,540), and Guatemala ($5,680).
According to experts, Ukraine’s economy has historically underperformed to expectations. After the fall of the Berlin Wall, the economy contracted for five straight years. Its transition to a Western, liberalized economic structure was overshadowed by widespread corruption, a limited taxpool, and few revenue sources.
Politically, its transformation from authoritarian regime to civil democracy has proved difficult, especially when it comes to institution building.
Finally, after the 2022 invasion of the country, Ukraine’s GDP contracted by 30% in a single year—the largest loss since independence. Large scale emigration—to the tune of six million refugees—is also playing a role.
Despite these challenges, the country’s economic growth has somewhat stabilized while fighting continues.

-

 Brands5 days ago
The Evolution of U.S. Beer Logos
-

 Culture2 weeks ago
The World’s Top Media Franchises by All-Time Revenue
-

 voronoi2 weeks ago
Best Visualizations of April on the Voronoi App
-

 Wealth2 weeks ago
Charted: Which Country Has the Most Billionaires in 2024?
-

 Business1 week ago
The Top Private Equity Firms by Country
-

 Markets1 week ago
The Best U.S. Companies to Work for According to LinkedIn
-

 Economy1 week ago
Ranked: The Top 20 Countries in Debt to China
-

 Politics1 week ago
Charted: Trust in Government Institutions by G7 Countries