Technology
The World’s 100 Most Valuable Brands in 2019
The World’s 100 Most Valuable Brands in 2019
Brand equity can be a challenging thing to build.
Even with access to deep pockets and an innovative product, it can take decades of grit to scrape your way into the mainstream consciousness of consumers.
On the path to becoming established as a globally significant brand, companies must fight through fierce competition, publicity scandals, changing regulations, and rapidly-evolving consumer tastes – all to take a bite from the same piece of pie.
Cream of the Crop
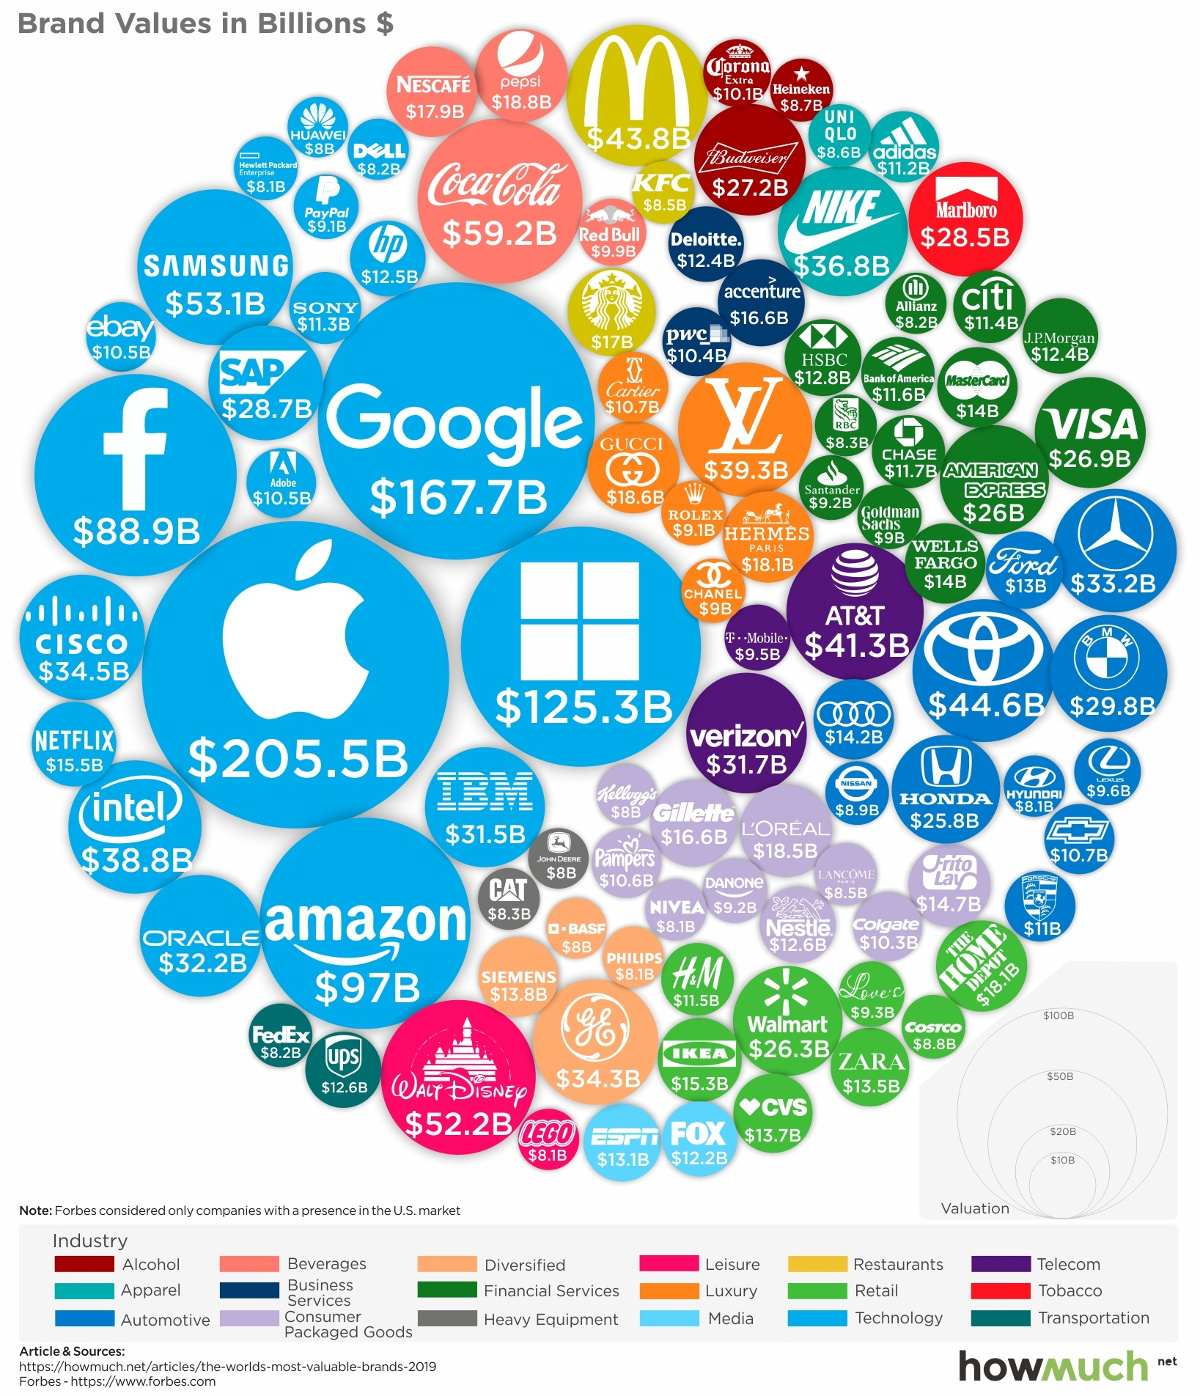
Today’s visualization comes to us from HowMuch.net, and it showcases the 100 most valuable brands in the world, according to Forbes.
Here are the powerful brands that sit at the very top of the list:
| Rank | Brand | Brand Value ($B) | 1-Yr Value Change | Industry |
|---|---|---|---|---|
| #1 | Apple | $205.5 | +12% | Technology |
| #2 | $167.7 | +27% | Technology | |
| #3 | Microsoft | $125.3 | +20% | Technology |
| #4 | Amazon | $97.0 | +37% | Technology |
| #5 | $88.9 | -6% | Technology | |
| #6 | Coca-Cola | $59.2 | +3% | Beverages |
| #7 | Samsung | $53.1 | +11% | Technology |
| #8 | Disney | $52.2 | +10% | Leisure |
| #9 | Toyota | $44.6 | +0% | Automotive |
| #10 | McDonald's | $43.8 | +6% | Restaurants |
It should be noted that the list is ordered by brand value, a measure that tries to calculate each brand’s ultimate contribution in financial terms to the parent company. You can see that full methodology here.
Finally, it’s also worth mentioning that brands with only a token representation in the United States have been excluded from the rankings. This means companies like Alibaba or Vodafone are not represented in this particular visualization.
Tech Rules Again in 2019
For another straight year, technology dominates the list of the 100 most valuable brands in 2019 – this time, with six of the top seven entries.
Most of these brands saw double-digit growth in value from the previous year, including Apple (12%), Google (27%), Amazon (37%), Microsoft (20%), and Samsung (11%). The one notable exception here is Facebook, which experienced a 6% drop in value attributed to various struggles around the company’s reputation.
Here’s a look at how industries break down more generally on the list:
| Industry | # of Brands | Brand Value ($B) |
|---|---|---|
| Technology | 20 | $957.6 |
| Financial Services | 13 | $198.1 |
| Automotive | 11 | $208.9 |
| Consumer Goods | 10 | $123.8 |
| Retail | 8 | $133.0 |
| Luxury | 6 | $124.1 |
| Beverages | 4 | $49.3 |
| Diversified | 4 | $56.8 |
| Alcohol | 3 | $69.8 |
| Apparel | 3 | $34.7 |
| Business Services | 3 | $33.5 |
| Restaurants | 3 | $73.0 |
| Telecom | 3 | $24.3 |
| Heavy Equipment | 2 | $36.7 |
| Leisure | 2 | $19.8 |
| Media | 2 | $34.8 |
| Transportation | 2 | $41.1 |
| Tobacco | 1 | $12.6 |
| Total | 100 | $2,231.9 |
As you can see, technology brands make up 20% of the list in terms of the number of entries – and a whopping 43% of the list’s cumulative valuation.
In total, technologies brands combined for $957.6 billion in value. Even when including Facebook’s recent drop, this is an impressive 9.7% increase on last year’s numbers.
Will the double-digit increases for the world’s largest tech giants continue into 2020, or are brands such as Amazon and Google going to start seeing the same type of pushback that Facebook has grappled with among consumers and regulators?


Technology
Visualizing AI Patents by Country
See which countries have been granted the most AI patents each year, from 2012 to 2022.


Visualizing AI Patents by Country
This was originally posted on our Voronoi app. Download the app for free on iOS or Android and discover incredible data-driven charts from a variety of trusted sources.
This infographic shows the number of AI-related patents granted each year from 2010 to 2022 (latest data available). These figures come from the Center for Security and Emerging Technology (CSET), accessed via Stanford University’s 2024 AI Index Report.
From this data, we can see that China first overtook the U.S. in 2013. Since then, the country has seen enormous growth in the number of AI patents granted each year.
| Year | China | EU and UK | U.S. | RoW | Global Total |
|---|---|---|---|---|---|
| 2010 | 307 | 137 | 984 | 571 | 1,999 |
| 2011 | 516 | 129 | 980 | 581 | 2,206 |
| 2012 | 926 | 112 | 950 | 660 | 2,648 |
| 2013 | 1,035 | 91 | 970 | 627 | 2,723 |
| 2014 | 1,278 | 97 | 1,078 | 667 | 3,120 |
| 2015 | 1,721 | 110 | 1,135 | 539 | 3,505 |
| 2016 | 1,621 | 128 | 1,298 | 714 | 3,761 |
| 2017 | 2,428 | 144 | 1,489 | 1,075 | 5,136 |
| 2018 | 4,741 | 155 | 1,674 | 1,574 | 8,144 |
| 2019 | 9,530 | 322 | 3,211 | 2,720 | 15,783 |
| 2020 | 13,071 | 406 | 5,441 | 4,455 | 23,373 |
| 2021 | 21,907 | 623 | 8,219 | 7,519 | 38,268 |
| 2022 | 35,315 | 1,173 | 12,077 | 13,699 | 62,264 |
In 2022, China was granted more patents than every other country combined.
While this suggests that the country is very active in researching the field of artificial intelligence, it doesn’t necessarily mean that China is the farthest in terms of capability.
Key Facts About AI Patents
According to CSET, AI patents relate to mathematical relationships and algorithms, which are considered abstract ideas under patent law. They can also have different meaning, depending on where they are filed.
In the U.S., AI patenting is concentrated amongst large companies including IBM, Microsoft, and Google. On the other hand, AI patenting in China is more distributed across government organizations, universities, and tech firms (e.g. Tencent).
In terms of focus area, China’s patents are typically related to computer vision, a field of AI that enables computers and systems to interpret visual data and inputs. Meanwhile America’s efforts are more evenly distributed across research fields.
Learn More About AI From Visual Capitalist
If you want to see more data visualizations on artificial intelligence, check out this graphic that shows which job departments will be impacted by AI the most.

-

 Mining1 week ago
Gold vs. S&P 500: Which Has Grown More Over Five Years?
-

 Markets2 weeks ago
Ranked: The Most Valuable Housing Markets in America
-

 Money2 weeks ago
Which States Have the Highest Minimum Wage in America?
-

 AI2 weeks ago
Ranked: Semiconductor Companies by Industry Revenue Share
-

 Markets2 weeks ago
Ranked: The World’s Top Flight Routes, by Revenue
-

 Countries2 weeks ago
Population Projections: The World’s 6 Largest Countries in 2075
-

 Markets2 weeks ago
The Top 10 States by Real GDP Growth in 2023
-

 Demographics2 weeks ago
The Smallest Gender Wage Gaps in OECD Countries