Politics
Mapped: The State of Press Freedom Around the World
View a more detailed version of this map


Mapped: The State of Press Freedom Around the World
View a more detailed version of the above map by clicking here
In many Western countries, it’s easy to take press freedom for granted.
Instances of fake news, clickbait, and hyper-partisan reporting are points of consternation in the modern media landscape, and can sometimes overshadow the greater good that unrestricted journalism provides to society.
Of course, the ability to do that important work can vary significantly around the world. Being an investigative journalist in Sweden comes with a very different set of circumstances and considerations than doing the same thing in a country such as Saudi Arabia or Venezuela.
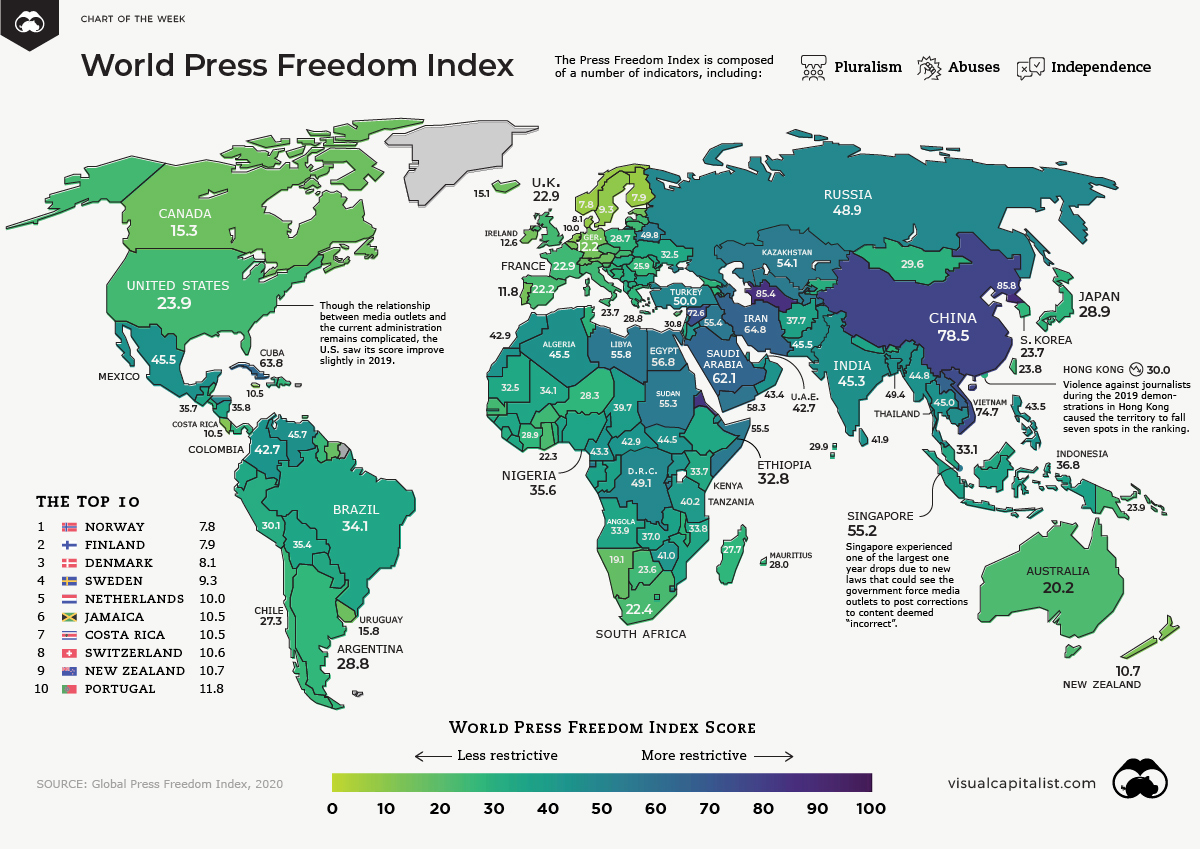
Today’s map highlights the results of the 2020 Global Press Freedom Index, produced by Reporters Without Borders. The report looks at press freedom in 180 countries and territories.
A Profession Not Without Its Risks
Today, nearly 75% of countries are in categories that the report describes as problematic, difficult, and very serious.
While these negative forces often come in the form of censorship and intimidation, journalism can be a risky profession in some of the more restrictive countries. One example is Mexico, where nearly 60 journalists were killed as a direct result of their reporting over the last decade.
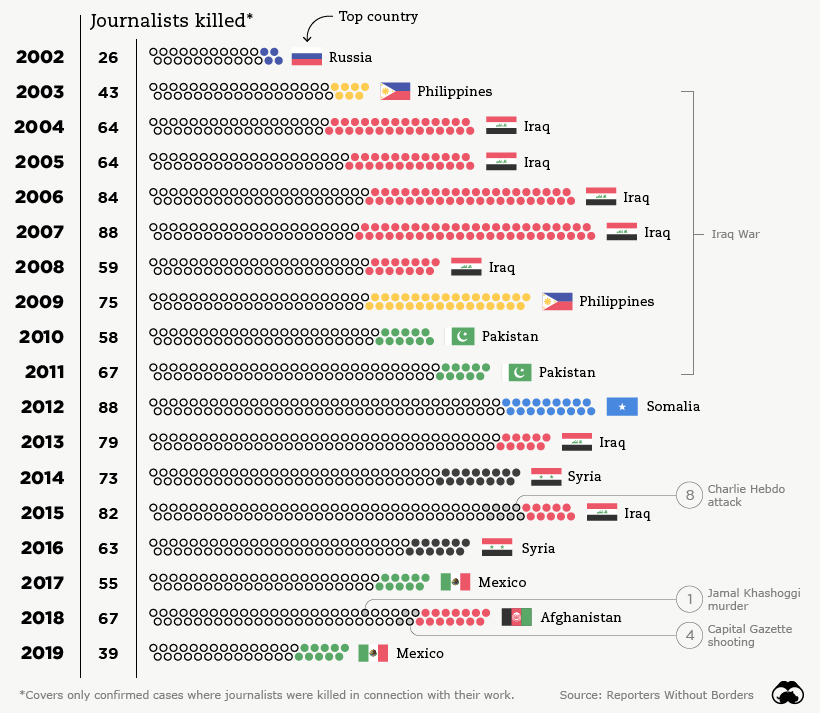
There is good news though: the number of journalists killed last year was the lowest since the report began in 2002.
Even better, press freedom scores increased around the world in the 2020 report.
Press Freedom: The Good, The Bad, The Ugly
Here are the scores for all 180 countries and territories covered in the report, sorted by 2020 ranking and score:
| Rank (2020) | Country or Region | Score (2020) | Prev. Rank (2019) | Change in Rank |
|---|---|---|---|---|
| #1 | 🇳🇴 Norway | 7.84 | 1 | 0 |
| #2 | 🇫🇮 Finland | 7.93 | 2 | 0 |
| #3 | 🇩🇰 Denmark | 8.13 | 5 | 2 |
| #4 | 🇸🇪 Sweden | 9.25 | 3 | -1 |
| #5 | 🇳🇱 Netherlands | 9.96 | 4 | -1 |
| #6 | 🇯🇲 Jamaica | 10.51 | 8 | 2 |
| #7 | 🇨🇷 Costa Rica | 10.53 | 10 | 3 |
| #8 | 🇨🇭 Switzerland | 10.62 | 6 | -2 |
| #9 | 🇳🇿 New Zealand | 10.69 | 7 | -2 |
| #10 | 🇵🇹 Portugal | 11.83 | 12 | 2 |
| #11 | Germany | 12.16 | 13 | 2 |
| #12 | Belgium | 12.57 | 9 | -3 |
| #13 | Ireland | 12.60 | 15 | 2 |
| #14 | Estonia | 12.61 | 11 | -3 |
| #15 | Iceland | 15.12 | 14 | -1 |
| #16 | Canada | 15.29 | 18 | 2 |
| #17 | Luxembourg | 15.46 | 17 | 0 |
| #18 | Austria | 15.78 | 16 | -2 |
| #19 | Uruguay | 15.79 | 19 | 0 |
| #20 | Suriname | 17.50 | 20 | 0 |
| #21 | Samoa | 18.25 | 22 | 1 |
| #22 | Latvia | 18.56 | 24 | 2 |
| #23 | Namibia | 19.25 | 23 | 0 |
| #24 | Liechtenstein | 19.52 | 26 | 2 |
| #25 | Cape Verde | 20.15 | 25 | 0 |
| #26 | Australia | 20.21 | 21 | -5 |
| #27 | Cyprus | 20.45 | 28 | 1 |
| #28 | Lithuania | 21.19 | 30 | 2 |
| #29 | Spain | 22.16 | 29 | 0 |
| #30 | Ghana | 22.26 | 27 | -3 |
| #31 | South Africa | 22.41 | 31 | 0 |
| #32 | Slovenia | 22.64 | 34 | 2 |
| #33 | Slovakia | 22.67 | 35 | 2 |
| #34 | France | 22.92 | 32 | -2 |
| #35 | United Kingdom | 22.93 | 33 | -2 |
| #36 | Trinidad and Tobago | 23.22 | 39 | 3 |
| #37 | Andorra | 23.23 | 37 | 0 |
| #38 | Burkina Faso | 23.47 | 36 | -2 |
| #39 | Botswana | 23.56 | 44 | 5 |
| #40 | Czech Republic | 23.57 | 40 | 0 |
| #41 | Italy | 23.69 | 43 | 2 |
| #42 | South Korea | 23.70 | 41 | -1 |
| #43 | Taiwan | 23.76 | 42 | -1 |
| #44 | OECS | 23.78 | 50 | 6 |
| #45 | United States | 23.85 | 48 | 3 |
| #46 | Papua New Guinea | 23.93 | 38 | -8 |
| #47 | Senegal | 23.99 | 49 | 2 |
| #48 | Romania | 25.91 | 47 | -1 |
| #49 | Guyana | 26.63 | 51 | 2 |
| #50 | Tonga | 27.27 | 45 | -5 |
| #51 | Chile | 27.31 | 46 | -5 |
| #52 | Fiji | 27.41 | 52 | 0 |
| #53 | Belize | 27.50 | 53 | 0 |
| #54 | Madagascar | 27.68 | 54 | 0 |
| #55 | Dominican Republic | 27.90 | 55 | 0 |
| #56 | Mauritius | 28.00 | 58 | 2 |
| #57 | Niger | 28.25 | 66 | 9 |
| #58 | Bosnia and Herzegovina | 28.51 | 63 | 5 |
| #59 | Croatia | 28.51 | 64 | 5 |
| #60 | Georgia | 28.59 | 60 | 0 |
| #61 | Armenia | 28.60 | 61 | 0 |
| #62 | Poland | 28.65 | 59 | -3 |
| #63 | Seychelles | 28.66 | 69 | 6 |
| #64 | Argentina | 28.78 | 57 | -7 |
| #65 | Greece | 28.80 | 65 | 0 |
| #66 | Japan | 28.86 | 67 | 1 |
| #67 | Bhutan | 28.90 | 80 | 13 |
| #68 | Ivory Coast | 28.94 | 71 | 3 |
| #69 | Malawi | 29.32 | 68 | -1 |
| #70 | Kosovo | 29.33 | 75 | 5 |
| #71 | Togo | 29.33 | 76 | 5 |
| #72 | Tunisia | 29.45 | 72 | 0 |
| #73 | Mongolia | 29.61 | 70 | -3 |
| #74 | El Salvador | 29.70 | 81 | 7 |
| #75 | Comoros | 29.77 | 56 | -19 |
| #76 | Panama | 29.78 | 79 | 3 |
| #77 | Cyprus North | 29.79 | 74 | -3 |
| #78 | East Timor | 29.90 | 84 | 6 |
| #79 | Maldives | 29.93 | 98 | 19 |
| #80 | Hong Kong | 30.01 | 73 | -7 |
| #81 | Malta | 30.16 | 77 | -4 |
| #82 | Kyrgyzstan | 30.19 | 83 | 1 |
| #83 | Haiti | 30.20 | 62 | -21 |
| #84 | Albania | 30.25 | 82 | -2 |
| #85 | Sierra Leone | 30.28 | 86 | 1 |
| #86 | Lesotho | 30.45 | 78 | -8 |
| #87 | Gambia | 30.62 | 92 | 5 |
| #88 | Israel | 30.84 | 88 | 0 |
| #89 | Hungary | 30.84 | 87 | -2 |
| #90 | Peru | 30.94 | 85 | -5 |
| #91 | Moldova | 31.16 | 91 | 0 |
| #92 | Macedonia | 31.28 | 95 | 3 |
| #93 | Serbia | 31.62 | 90 | -3 |
| #94 | Guinea-Bissau | 32.06 | 89 | -5 |
| #95 | Liberia | 32.25 | 93 | -2 |
| #96 | Ukraine | 32.52 | 102 | 6 |
| #97 | Mauritania | 32.54 | 94 | -3 |
| #98 | Ecuador | 32.62 | 97 | -1 |
| #99 | Ethiopia | 32.82 | 110 | 11 |
| #100 | Paraguay | 32.97 | 99 | -1 |
| #101 | Malaysia | 33.12 | 123 | 22 |
| #102 | Lebanon | 33.19 | 101 | -1 |
| #103 | Kenya | 33.72 | 100 | -3 |
| #104 | Mozambique | 33.79 | 103 | -1 |
| #105 | Montenegro | 33.83 | 104 | -1 |
| #106 | Angola | 33.92 | 109 | 3 |
| #107 | Brazil | 34.05 | 105 | -2 |
| #108 | Mali | 34.12 | 112 | 4 |
| #109 | Kuwait | 34.30 | 108 | -1 |
| #110 | Guinea | 34.34 | 107 | -3 |
| #111 | Bulgaria | 35.06 | 111 | 0 |
| #112 | Nepal | 35.10 | 106 | -6 |
| #113 | Benin | 35.11 | 96 | -17 |
| #114 | Bolivia | 35.37 | 113 | -1 |
| #115 | Nigeria | 35.63 | 120 | 5 |
| #116 | Guatemala | 35.74 | 116 | 0 |
| #117 | Nicaragua | 35.81 | 114 | -3 |
| #118 | Congo | 36.56 | 117 | -1 |
| #119 | Indonesia | 36.82 | 124 | 5 |
| #120 | Zambia | 37.00 | 119 | -1 |
| #121 | Gabon | 37.20 | 115 | -6 |
| #122 | Afghanistan | 37.70 | 121 | -1 |
| #123 | Chad | 39.70 | 122 | -1 |
| #124 | Tanzania | 40.25 | 118 | -6 |
| #125 | Uganda | 40.95 | 125 | 0 |
| #126 | Zimbabwe | 40.95 | 127 | 1 |
| #127 | Sri Lanka | 41.94 | 126 | -1 |
| #128 | Jordan | 42.08 | 130 | 2 |
| #129 | Qatar | 42.51 | 128 | -1 |
| #130 | Colombia | 42.66 | 129 | -1 |
| #131 | United Arab Emirates | 42.69 | 133 | 2 |
| #132 | C.A.R. | 42.87 | 145 | 13 |
| #133 | Morocco | 42.88 | 135 | 2 |
| #134 | Cameroon | 43.28 | 131 | -3 |
| #135 | Oman | 43.42 | 132 | -3 |
| #136 | Philippines | 43.54 | 134 | -2 |
| #137 | Palestine | 44.09 | 137 | 0 |
| #138 | South Sudan | 44.49 | 139 | 1 |
| #139 | Myanmar | 44.77 | 138 | -1 |
| #140 | Thailand | 44.94 | 136 | -4 |
| #141 | Swaziland | 45.15 | 147 | 6 |
| #142 | India | 45.33 | 140 | -2 |
| #143 | Mexico | 45.45 | 144 | 1 |
| #144 | Cambodia | 45.46 | 143 | -1 |
| #145 | Pakistan | 45.52 | 142 | -3 |
| #146 | Algeria | 45.52 | 141 | -5 |
| #147 | Venezuela | 45.66 | 148 | 1 |
| #148 | Honduras | 48.20 | 146 | -2 |
| #149 | Russian Federation | 48.92 | 149 | 0 |
| #150 | Congo (DRC) | 49.09 | 154 | 4 |
| #151 | Bangladesh | 49.37 | 150 | -1 |
| #152 | Brunei | 49.65 | 152 | 0 |
| #153 | Belarus | 49.75 | 153 | 0 |
| #154 | Turkey | 50.02 | 157 | 3 |
| #155 | Rwanda | 50.34 | 155 | 0 |
| #156 | Uzbekistan | 53.07 | 160 | 4 |
| #157 | Kazakhstan | 54.11 | 158 | 1 |
| #158 | Singapore | 55.23 | 151 | -7 |
| #159 | Sudan | 55.33 | 175 | 16 |
| #160 | Burundi | 55.33 | 159 | -1 |
| #161 | Tajikistan | 55.34 | 161 | 0 |
| #162 | Iraq | 55.37 | 156 | -6 |
| #163 | Somalia | 55.45 | 164 | 1 |
| #164 | Libya | 55.77 | 162 | -2 |
| #165 | Equatorial Guinea | 56.38 | 165 | 0 |
| #166 | Egypt | 56.82 | 163 | -3 |
| #167 | Yemen | 58.25 | 168 | 1 |
| #168 | Azerbaijan | 58.48 | 166 | -2 |
| #169 | Bahrain | 60.13 | 167 | -2 |
| #170 | Saudi Arabia | 62.14 | 172 | 2 |
| #171 | Cuba | 63.81 | 169 | -2 |
| #172 | Laos | 64.28 | 171 | -1 |
| #173 | Iran | 64.81 | 170 | -3 |
| #174 | Syria | 72.57 | 174 | 0 |
| #175 | Vietnam | 74.71 | 176 | 1 |
| #176 | Djibouti | 76.73 | 173 | -3 |
| #177 | China | 78.48 | 177 | 0 |
| #178 | Eritrea | 83.50 | 178 | 0 |
| #179 | Turkmenistan | 85.44 | 180 | 1 |
| #180 | North Korea | 85.82 | 179 | -1 |
Which countries stood out in this year’s edition of the press freedom rankings?
Norway: Nordic Countries have topped the Press Freedom Index since its inception, and Norway (Rank: #1) in particular is an example for the world. Despite a very free media environment, the government recently mandated a commission to conduct a comprehensive review of the conditions for freedom of speech. Members will consider measures to promote the broadest possible participation in the public debate, and means to hamper the spread of fake news and hate speech.
Malaysia: A new government ushered in a less restrictive era in Malaysia in 2018. Journalists and media outlets that had been blacklisted were able to resume working, and anti-fake news laws that were viewed as problematic were repealed. As a result, Malaysia’s index score has improved by 15 points in the past two years. This is in sharp contrast to neighbor, Singapore, which is ranked 158th out of 180 countries.
Ethiopia: When Abiy Ahmed Ali took power in Africa’s second most populous country in 2018, his government restored access to over 200 news websites and blogs that had been previously blocked. As well, many detained journalists and bloggers were released as the chill over the country’s highly restrictive media environment began to thaw. As a result, Ethiopia (#99) jumped up eleven spots in the Press Freedom Index in 2020.
The Middle East: Though the situation in this region has begun to stabilize somewhat, restrictions still remain – even in relatively safe and stable countries. Both Saudi Arabia (#170) and Egypt (#166) have imprisoned a number of journalists in recent years, and the former is still dealing with the reputational fallout from the assassination of Saudi dissident and Washington Post columnist, Jamal Khashoggi.
China: Sitting near the bottom of the list is China (#176). More than 100 journalists and bloggers are currently detained as the country maintains a tight grip over the press – particularly as COVID-19 began to spread. Earlier this year, the Chinese government also expelled over a dozen journalists representing U.S. publications.
2020: A Pivotal Year for the Press
As the world grapples with a deadly pandemic, a global economic shutdown, and a crucial election year, the media could find itself in the spotlight more than in previous years.
How the stories of 2020 are told will influence our collective future – and how regimes choose to treat journalists under this atypical backdrop will tell us a lot about press freedom going forward.
Politics
Charted: Trust in Government Institutions by G7 Countries
How much do you trust the government and its various institutions? We look at data for G7 countries for the time period of 2006-2023.


Trust in Government Institutions by G7 Countries
This was originally posted on our Voronoi app. Download the app for free on iOS or Android and discover incredible data-driven charts from a variety of trusted sources.
How much do you trust the government, and its various institutions?
It’s likely that your level of confidence probably depends on a wide range of factors, such as perceived competency, historical context, economic performance, accountability, social cohesion, and transparency.
And for these same reasons, trust levels in government institutions also change all the time, even in the world’s most developed countries: the G7.
Confidence in Government by G7 Countries (2006-2023)
This chart looks at the changes in trust in government institutions between the years 2006 and 2023, based on data from a multi-country Gallup poll.
Specifically, this dataset aggregates confidence in multiple national institutions, including the military, the judicial system, the national government, and the integrity of the electoral system.
| Country | Confidence (2006) | Confidence (2023) | Change (p.p.) |
|---|---|---|---|
| Canada | 57% | 64% | +7 |
| Britain | 63% | 63% | +0 |
| Germany | 55% | 61% | +6 |
| France | 54% | 60% | +6 |
| Japan | 48% | 59% | +11 |
| Italy | 41% | 54% | +13 |
| United States | 63% | 50% | -13 |
What’s interesting here is that in the G7, a group of the world’s most developed economies, there is only one country bucking the general trend: the United States.
Across most G7 countries, confidence in institutions has either improved or stayed the same between 2006 and 2023. The largest percentage point (p.p.) increases occur in Italy and Japan, which saw +13 p.p. and +11 p.p. increases in trust over the time period.
In the U.S., however, confidence in government institutions has fallen by 13 p.p. over the years. What happened?
Key Figures on U.S. Trust in Institutions
In 2006, the U.S. was tied with the UK as having the highest confidence in government institutions, at 63%.
But here’s where the scores stand in 2023, across various institutions:
| 🇺🇸 Institutions | Confidence (2023) |
|---|---|
| Military | 81% |
| Judiciary | 42% |
| National Government | 30% |
| Elections | 44% |
| Overall | 49% |
Based on this data, it’s clear that the U.S. lags behind in three key indicators: confidence in the national government, confidence in the justice system, and confidence in fair elections. It ranked in last place for each indicator in the G7.
One other data point that stands out: despite leading the world in military spending, the U.S. is only the third most confident in its military in the G7. It lags behind France (86%) and the United Kingdom (83%).

-

 Technology6 days ago
All of the Grants Given by the U.S. CHIPS Act
-

 Uranium2 weeks ago
The World’s Biggest Nuclear Energy Producers
-

 Education2 weeks ago
How Hard Is It to Get Into an Ivy League School?
-

 Debt2 weeks ago
How Debt-to-GDP Ratios Have Changed Since 2000
-

 Sports2 weeks ago
The Highest Earning Athletes in Seven Professional Sports
-

 Science2 weeks ago
Visualizing the Average Lifespans of Mammals
-

 Brands1 week ago
How Tech Logos Have Evolved Over Time
-

 Energy1 week ago
Ranked: The Top 10 EV Battery Manufacturers in 2023