Energy
How Much Solar Energy is Consumed Per Capita? (1965-2019)
Press play above to watch how per capita solar energy consumption increases over 54 years.
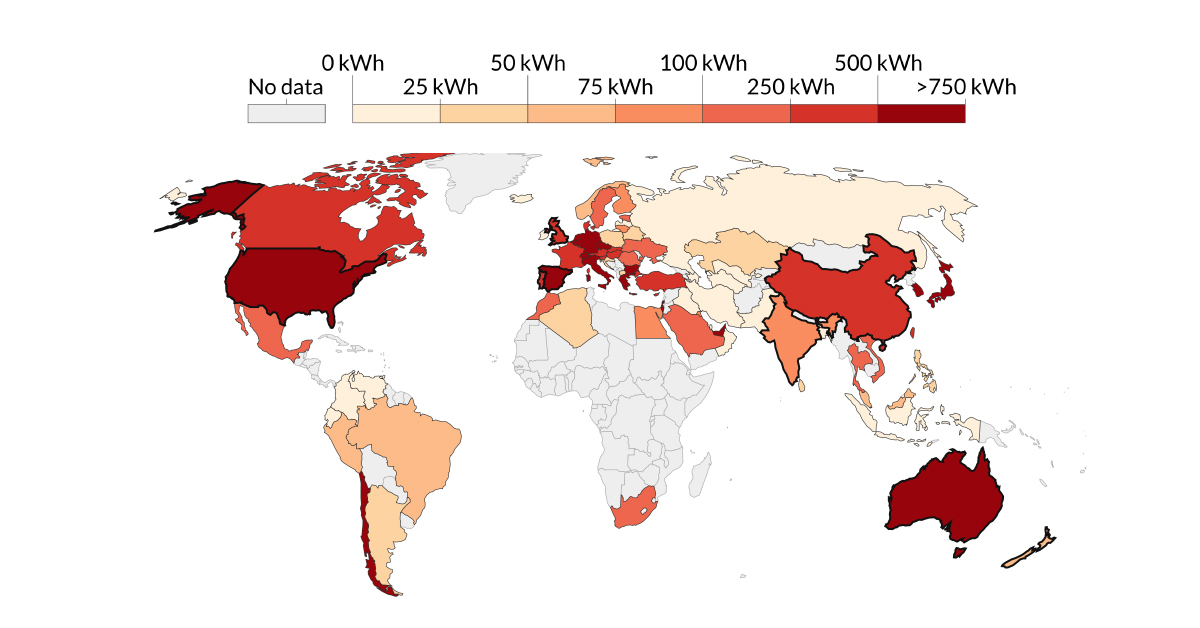
How Much Solar Energy is Consumed Per Capita?
The long history of solar energy use dates as far back as 4,000 B.C.—when ancient civilizations would use solar architecture to design dwellings that would use more of the sun’s warmth in the winter, while reducing excess heat in the summer.
But despite its long history, we’ve only recently started to rely on solar energy as a renewable power source. This Our World in Data visualization pulls data from BP’s Statistical Review of World Energy to highlight how solar energy consumption per capita has grown in countries around the world over 54 years.
Solar Success: The Top Consumers Per Capita
Solar energy consumption is measured in kilowatt hours (kWh)—and as of the latest estimates, Australia leads the world in terms of highest solar energy consumption per capita at 1,764 kWh in 2019. A combination of factors help achieve this:
- Optimal weather conditions
- High gross domestic product (GDP) per capita
- Tariffs incentivizing the shift to solar
In fact, government subsidies such as financial assistance with installation and feed-in tariffs help bring down the costs of residential solar systems to a mere AUD$1 (US$0.70) per watt.
| Rank | Country | Solar consumption per capita (kWh, 2019) | Solar’s share of total (per capita consumption) |
|---|---|---|---|
| #1 | 🇦🇺 Australia | 1,764 | 2.50% |
| #2 | 🇯🇵 Japan | 1,469 | 3.59% |
| #3 | 🇩🇪 Germany | 1,409 | 3.22% |
| #4 | 🇦🇪 UAE | 1,056 | 0.77% |
| #5 | 🇮🇹 Italy | 995 | 3.40% |
| #6 | 🇬🇷 Greece | 936 | 3.08% |
| #7 | 🇧🇪 Belgium | 847 | 1.30% |
| #8 | 🇨🇱 Chile | 823 | 3.39% |
| #9 | 🇺🇸 U.S. | 815 | 1.02% |
| #10 | 🇪🇸 Spain | 797 | 2.34% |
Source: Our World in Data, BP Statistical Review of World Energy 2020
Note that some conversions have been made for primary energy consumption values from Gigajoules (GJ) to kWh.
Coming in second place, Japan has the highest share of solar (3.59%) compared to its total primary energy consumption per capita. After the Fukushima nuclear disaster in 2011, the nation made plans to double its renewable energy use by 2030.
Japan has achieved its present high rates of solar energy use through creative means, from repurposing abandoned golf courses to building floating “solar islands”.
Solar Laggards: The Bottom Consumers Per Capita
On the flip side, several countries that lag behind on solar use are heavily reliant on fossil fuels. These include several members of OPEC—Iraq, Iran, and Venezuela—and former member state Indonesia.
This reliance may also explain why, despite being located in regions that receive the most annual “sunshine hours” in the world, this significant solar potential is yet unrealized.
| Rank | Country | Solar consumption per capita (kWh, 2019) | Primary energy consumption per capita (kWh, 2019) |
|---|---|---|---|
| #1 | 🇮🇸 Iceland | 0 | No data available |
| #2 | 🇱🇻 Latvia | 0 | No data available |
| #3 | 🇮🇩 Indonesia | <1 | 9,140 |
| #4 | 🇺🇿 Uzbekistan | <1 | 15,029 |
| #5 | 🇭🇰 Hong Kong | <1 | 46,365 |
| #6 | 🇻🇪 Venezuela | 1 | 21,696 |
| #7 | 🇴🇲 Oman | 2 | 84,535 |
| #8 | 🇹🇲 Turkmenistan | 3 | 67,672 |
| #9 | 🇮🇶 Iraq | 4 | 15,723 |
| #10 | 🇮🇷 Iran | 5 | 41,364 |
Source: Our World in Data, BP Statistical Review of World Energy 2020
Note that some conversions have been made for primary energy consumption values from Gigajoules (GJ) to kWh.
Interestingly, Iceland is on this list for a different reason. Although the country still relies on renewable energy, it gets this from different sources than solar—a significant share comes from hydropower as well as geothermal power.
The Future of Solar
One thing the visualization above makes clear is that solar’s impact on the global energy mix has only just begun. As the costs associated with producing solar power continue to fall, we’re on a steady track to transform solar energy into a more significant means of generating power.
All in all, with the world’s projected energy mix from total renewables set to increase over 300% by 2040, solar energy is on a rising trend upwards.


Energy
Charted: 4 Reasons Why Lithium Could Be the Next Gold Rush
Visual Capitalist has partnered with EnergyX to show why drops in prices and growing demand may make now the right time to invest in lithium.


4 Reasons Why You Should Invest in Lithium
Lithium’s importance in powering EVs makes it a linchpin of the clean energy transition and one of the world’s most precious minerals.
In this graphic, Visual Capitalist partnered with EnergyX to explore why now may be the time to invest in lithium.
1. Lithium Prices Have Dropped
One of the most critical aspects of evaluating an investment is ensuring that the asset’s value is higher than its price would indicate. Lithium is integral to powering EVs, and, prices have fallen fast over the last year:
| Date | LiOH·H₂O* | Li₂CO₃** |
|---|---|---|
| Feb 2023 | $76 | $71 |
| March 2023 | $71 | $61 |
| Apr 2023 | $43 | $33 |
| May 2023 | $43 | $33 |
| June 2023 | $47 | $45 |
| July 2023 | $44 | $40 |
| Aug 2023 | $35 | $35 |
| Sept 2023 | $28 | $27 |
| Oct 2023 | $24 | $23 |
| Nov 2023 | $21 | $21 |
| Dec 2023 | $17 | $16 |
| Jan 2024 | $14 | $15 |
| Feb 2024 | $13 | $14 |
Note: Monthly spot prices were taken as close to the 14th of each month as possible.
*Lithium hydroxide monohydrate MB-LI-0033
**Lithium carbonate MB-LI-0029
2. Lithium-Ion Battery Prices Are Also Falling
The drop in lithium prices is just one reason to invest in the metal. Increasing economies of scale, coupled with low commodity prices, have caused the cost of lithium-ion batteries to drop significantly as well.
In fact, BNEF reports that between 2013 and 2023, the price of a Li-ion battery dropped by 82%.
| Year | Price per KWh |
|---|---|
| 2023 | $139 |
| 2022 | $161 |
| 2021 | $150 |
| 2020 | $160 |
| 2019 | $183 |
| 2018 | $211 |
| 2017 | $258 |
| 2016 | $345 |
| 2015 | $448 |
| 2014 | $692 |
| 2013 | $780 |

3. EV Adoption is Sustainable
One of the best reasons to invest in lithium is that EVs, one of the main drivers behind the demand for lithium, have reached a price point similar to that of traditional vehicle.
According to the Kelly Blue Book, Tesla’s average transaction price dropped by 25% between 2022 and 2023, bringing it in line with many other major manufacturers and showing that EVs are a realistic transport option from a consumer price perspective.
| Manufacturer | September 2022 | September 2023 |
|---|---|---|
| BMW | $69,000 | $72,000 |
| Ford | $54,000 | $56,000 |
| Volkswagon | $54,000 | $56,000 |
| General Motors | $52,000 | $53,000 |
| Tesla | $68,000 | $51,000 |
4. Electricity Demand in Transport is Growing
As EVs become an accessible transport option, there’s an investment opportunity in lithium. But possibly the best reason to invest in lithium is that the IEA reports global demand for the electricity in transport could grow dramatically by 2030:
| Transport Type | 2022 | 2025 | 2030 |
|---|---|---|---|
| Buses 🚌 | 23,000 GWh | 50,000 GWh | 130,000 GWh |
| Cars 🚙 | 65,000 GWh | 200,000 GWh | 570,000 GWh |
| Trucks 🛻 | 4,000 GWh | 15,000 GWh | 94,000 GWh |
| Vans 🚐 | 6,000 GWh | 16,000 GWh | 72,000 GWh |
The Lithium Investment Opportunity
Lithium presents a potentially classic investment opportunity. Lithium and battery prices have dropped significantly, and recently, EVs have reached a price point similar to other vehicles. By 2030, the demand for clean energy, especially in transport, will grow dramatically.
With prices dropping and demand skyrocketing, now is the time to invest in lithium.
EnergyX is poised to exploit lithium demand with cutting-edge lithium extraction technology capable of extracting 300% more lithium than current processes.

-

 Lithium4 days ago
Ranked: The Top 10 EV Battery Manufacturers in 2023
Asia dominates this ranking of the world’s largest EV battery manufacturers in 2023.
-

 Energy1 week ago
The World’s Biggest Nuclear Energy Producers
China has grown its nuclear capacity over the last decade, now ranking second on the list of top nuclear energy producers.
-

 Energy1 month ago
The World’s Biggest Oil Producers in 2023
Just three countries accounted for 40% of global oil production last year.
-

 Energy1 month ago
How Much Does the U.S. Depend on Russian Uranium?
Currently, Russia is the largest foreign supplier of nuclear power fuel to the U.S.
-

 Uranium2 months ago
Charted: Global Uranium Reserves, by Country
We visualize the distribution of the world’s uranium reserves by country, with 3 countries accounting for more than half of total reserves.
-

 Energy3 months ago
Visualizing the Rise of the U.S. as Top Crude Oil Producer
Over the last decade, the United States has established itself as the world’s top producer of crude oil, surpassing Saudi Arabia and Russia.


-

 Mining1 week ago
Gold vs. S&P 500: Which Has Grown More Over Five Years?
-

 Markets2 weeks ago
Ranked: The Most Valuable Housing Markets in America
-

 Money2 weeks ago
Which States Have the Highest Minimum Wage in America?
-

 AI2 weeks ago
Ranked: Semiconductor Companies by Industry Revenue Share
-

 Markets2 weeks ago
Ranked: The World’s Top Flight Routes, by Revenue
-

 Countries2 weeks ago
Population Projections: The World’s 6 Largest Countries in 2075
-

 Markets2 weeks ago
The Top 10 States by Real GDP Growth in 2023
-

 Demographics2 weeks ago
The Smallest Gender Wage Gaps in OECD Countries