Markets
The Growth of $100 Invested in Jim Simons’ Medallion Fund
![]() See this visualization first on the Voronoi app.
See this visualization first on the Voronoi app.

$100 Invested in Jim Simons’ Medallion Fund vs. the S&P 500
This was originally posted on our Voronoi app. Download the app for free on iOS or Android and discover incredible data-driven charts from a variety of trusted sources.
The late Jim Simons was arguably the best trader of all-time, achieving 66% average gross annual returns over the span of three decades.
At the age of 40, the former mathematics professor at the Massachusetts Institute of Technology and Harvard built the renowned hedge fund, Renaissance Technologies, out of a strip mall in Long Island. Notably, Simons applied artificial intelligence and massive datasets to build an automated trading system that detected price patterns back in the 1980s.
This graphic shows the extraordinary performance of Simons’ flagship Medallion Fund in comparison to the S&P 500 over the same time period, based on data from Gregory Zuckerman’s The Man Who Solved the Market via Cornell Capital Group.
The Best Performing Fund in Modern History
Below, we show the performance of the Medallion Fund between 1988 and 2018 compared with the S&P 500 index using data from TradingView. Figures are based on net returns, which factor in fund and performance fees:
| Year | Medallion Fund Net Return | $100 invested in the Medallion Fund (net returns) | S&P 500 Return | $100 invested in the S&P 500 |
|---|---|---|---|---|
| 1988 | 9.04% | $109.04 | 12.40% | $112.40 |
| 1989 | -3.20% | $105.55 | 27.25% | $143.03 |
| 1990 | 58.24% | $167.02 | -6.56% | $133.65 |
| 1991 | 39.44% | $232.90 | 26.31% | $168.81 |
| 1992 | 33.60% | $311.15 | 4.46% | $176.34 |
| 1993 | 39.12% | $432.87 | 7.06% | $188.79 |
| 1994 | 70.72% | $739.00 | -1.13% | $186.65 |
| 1995 | 38.32% | $1,022.19 | 33.56% | $249.29 |
| 1996 | 31.52% | $1,344.38 | 20.26% | $299.80 |
| 1997 | 21.20% | $1,629.39 | 31.01% | $392.77 |
| 1998 | 41.68% | $2,308.52 | 26.67% | $497.52 |
| 1999 | 24.48% | $2,873.64 | 19.53% | $594.69 |
| 2000 | 98.48% | $5,703.61 | -10.12% | $534.51 |
| 2001 | 33.02% | $7,586.94 | -13.05% | $464.75 |
| 2002 | 25.82% | $9,545.88 | -23.37% | $356.14 |
| 2003 | 21.90% | $11,636.43 | 26.38% | $450.09 |
| 2004 | 24.92% | $14,536.23 | 8.99% | $490.55 |
| 2005 | 29.51% | $18,825.87 | 3.00% | $505.27 |
| 2006 | 44.30% | $27,165.74 | 13.62% | $574.09 |
| 2007 | 73.42% | $47,110.82 | 3.53% | $594.35 |
| 2008 | 83.38% | $86,391.82 | -38.49% | $365.59 |
| 2009 | 38.98% | $120,067.36 | 23.45% | $451.32 |
| 2010 | 29.40% | $155,367.16 | 12.78% | $508.99 |
| 2011 | 37.02% | $212,884.08 | 0.00% | $508.99 |
| 2012 | 29.01% | $274,641.76 | 13.41% | $577.25 |
| 2013 | 46.93% | $403,531.13 | 29.60% | $748.12 |
| 2014 | 39.20% | $561,715.34 | 11.39% | $833.33 |
| 2015 | 36.01% | $763,989.03 | -0.73% | $827.24 |
| 2016 | 35.62% | $1,036,121.93 | 9.54% | $906.16 |
| 2017 | 45.02% | $1,502,584.02 | 19.42% | $1,082.14 |
| 2018 | 39.98% | $2,103,317.11 | -6.24% | $1,014.61 |
| Total percentage return (1988-2018) | 2,103,217.1% | 914.61% |
As the above table shows, the value of $100 invested in the Medallion Fund in 1998 would have grown to over $2.1 million by 2018 net of fees.
It’s worth noting these fees were significant. They included a 5% fixed fee and a 44% performance fee after 2002. When accounting for these factors, the fund averaged 39% in annual returns.
Even so, the fund outperformed the S&P 500 by a substantial margin, along with surpassing the returns of many other investing giants of that time, including Warren Buffett and Peter Lynch. As one of the pioneers of quantitative investing, Simons’ investing style was built on sophisticated models that analyzed correlations between investments.
Despite the fund’s success, its investors are exclusively former and current employees of Renaissance Technologies. While the fund was open to outside investors for a handful of years, it privatized in 1993.
How Jim Simons Built a World-Class Fund
While the strategy behind the fund remains veiled in secrecy, Zuckerman points out a number of key factors that underscored its success.
Among them were Simons’ ability to recruit top talent, including math and science professors at leading institutions thanks to his connections in academia. Prior to his success in finance, Simons wrote one of the most cited math papers in modern history, based on the Chern-Simons theory.
Another key factor was Renaissance Technologies’ unique corporate culture. Unlike competitors, Simons’ created a flat structure where employees worked on projects together rather than in silos. Employees were never hired for a specific role, they were instead hired to make the trading system even better.
“The most important thing we did is have an open atmosphere.”
– Jim Simons
Overall, Simons is credited with managing a number of brilliant minds, from quantum physicists to number theorists to achieve superior returns. While Simons’ own mathematical genius played an instrumental role in the fund’s performance, it was patching together the minds of highly accomplished employees that led Medallion returns to reach stratospheric heights.


Markets
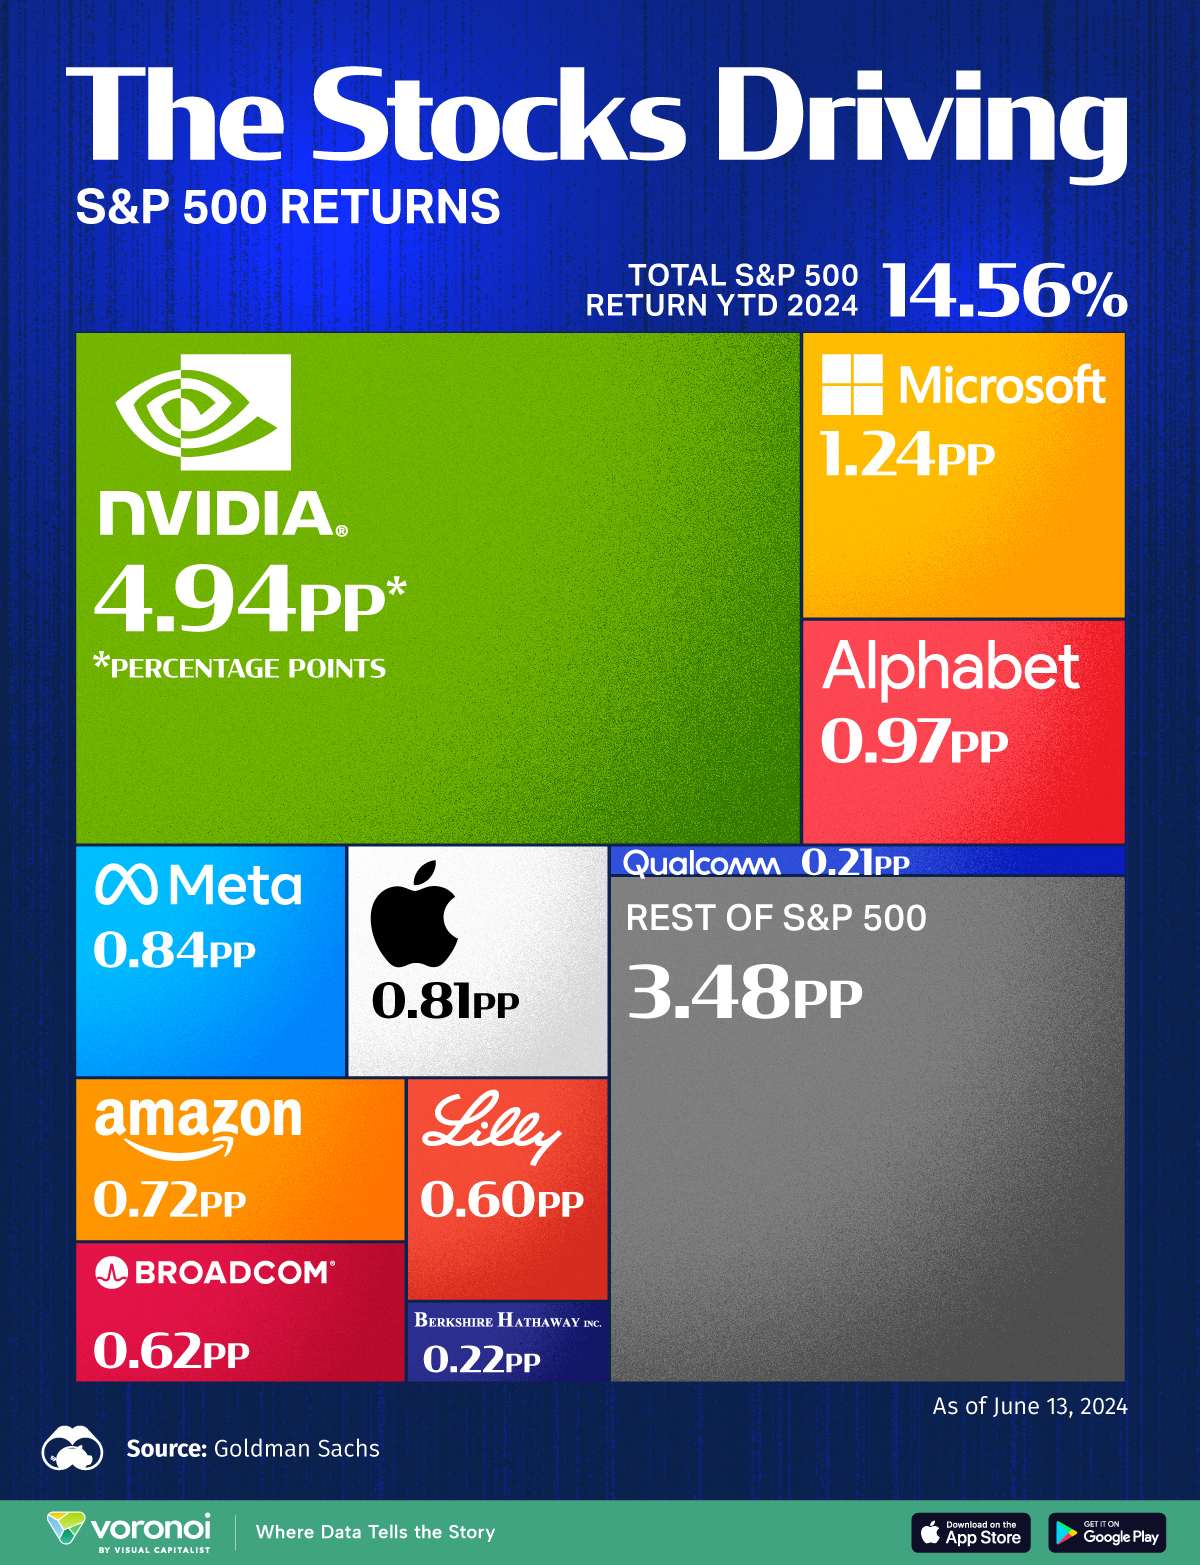
The Stocks Driving S&P 500 Returns in 2024
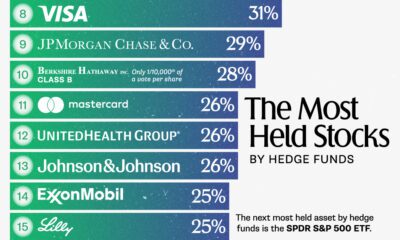
We show the top 10 S&P 500 stocks that are fueling the market’s rally as the index hovers near record-highs.

The Stocks Driving S&P 500 Returns in 2024
This was originally posted on our Voronoi app. Download the app for free on iOS or Android and discover incredible data-driven charts from a variety of trusted sources.
The S&P 500 is sitting at near-record highs, returning 15% year-to-date as of June 26, 2024.
Today, a limited number of stocks are powering the stock market’s rally as investors pour money into companies that are advancing AI technologies. As share prices skyrocket, many wonder if company valuations are overheated—or if they are supported by strong corporate fundamentals.
This graphic shows the top 10 S&P 500 stocks driving stock market returns in 2024, based on data from Goldman Sachs.
Big Tech Stocks Are Fueling Gains
Below, we show the companies making the largest contribution to the S&P 500’s rally:
| Rank | Company | Ticker | Contribution to S&P 500 Return YTD as of June 13, 2024 |
|---|---|---|---|
| 1 | Nvidia | NVDA | 4.94% |
| 2 | Microsoft | MSFT | 1.24% |
| 3 | Alphabet | GOOGL | 0.97% |
| 4 | Meta | META | 0.84% |
| 5 | Apple | AAPL | 0.81% |
| 6 | Amazon | AMZN | 0.72% |
| 7 | Broadcom | AVGO | 0.62% |
| 8 | Eli Lilly & Co. | LLY | 0.60% |
| 9 | Berkshire Hathaway | BRK.B | 0.22% |
| 10 | QUALCOMM | QCOM | 0.21% |
| Total S&P 500 Return YTD 2024 | 14.65% |
As of June 13, 2024.
Chipmaker Nvidia has driven over a third of S&P 500 returns this year, with its share price soaring 162% year-to-date as of June 13, 2024.
In June, Nvidia became the world’s most valuable firm, commanding an estimated 70% to 95% of the AI chip market. In the latest quarter, revenue surged by threefold compared to a year earlier amid high chip demand. Overall, big tech companies such as Meta, Amazon, and Microsoft made up roughly 45% of its data-center revenue, with Meta running a staggering 350,000 H100 chips to power its AI systems this year alone.
Falling in second is Microsoft, which has invested billions in AI startups including OpenAI and Wayve, a self-driving car firm. Microsoft is a cloud service provider for ChatGPT, the large language model built by OpenAI. As AI demand exceeds capacity, and other business segments see solid growth, Microsoft’s revenue increased 17% year-over-year as of the second quarter of 2024.
Google’s parent, Alphabet, ranks next, followed by Meta and Apple. Each of these companies is working on their own large language model which costs millions to train and run. Together, the top five stocks are driving about 60% of the S&P 500’s returns.
As we can see, just two of the top 10 S&P 500 stocks are not big tech names: pharmaceutical giant Eli Lilly and Berkshire Hathaway. This year, Eli Lilly’s share price is surging due to strong demand for its weight loss drug, Zepbound. During the first quarter of 2024, the newly-approved drug generated over $517 million in sales. Given its reported effectiveness, some analysts are forecasting it could be the best-selling drug ever in American history.

-

 Money1 week ago
Visualizing the Wealth of Americans Under 40 (1989-2023)
-

 Maps1 week ago
Mapped: 15 Countries with the Highest Smoking Rates
-
 Markets1 week ago
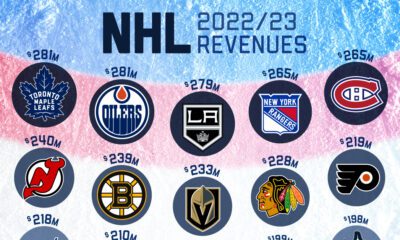
Ranked: Which NHL Team Takes Home the Most Revenue?
-

 Maps1 week ago
Mapped: Highest and Lowest Doctor Density Around the World
-

 Money1 week ago
Ranked: The World’s Top 10 Billionaires in 2024
-

 Stocks1 week ago
All of the World’s Trillion-Dollar Companies in One Chart
-

 Stocks1 week ago
Charted: Four Decades of U.S. Tech IPOs
-

 Retail1 week ago
Ranked: The 20 Top Retailers Worldwide, by Revenue