Chart of the Week
Will a Robot Take Your Job?
Will a Robot Take Your Job?
The Chart of the Week is a weekly Visual Capitalist feature on Fridays.
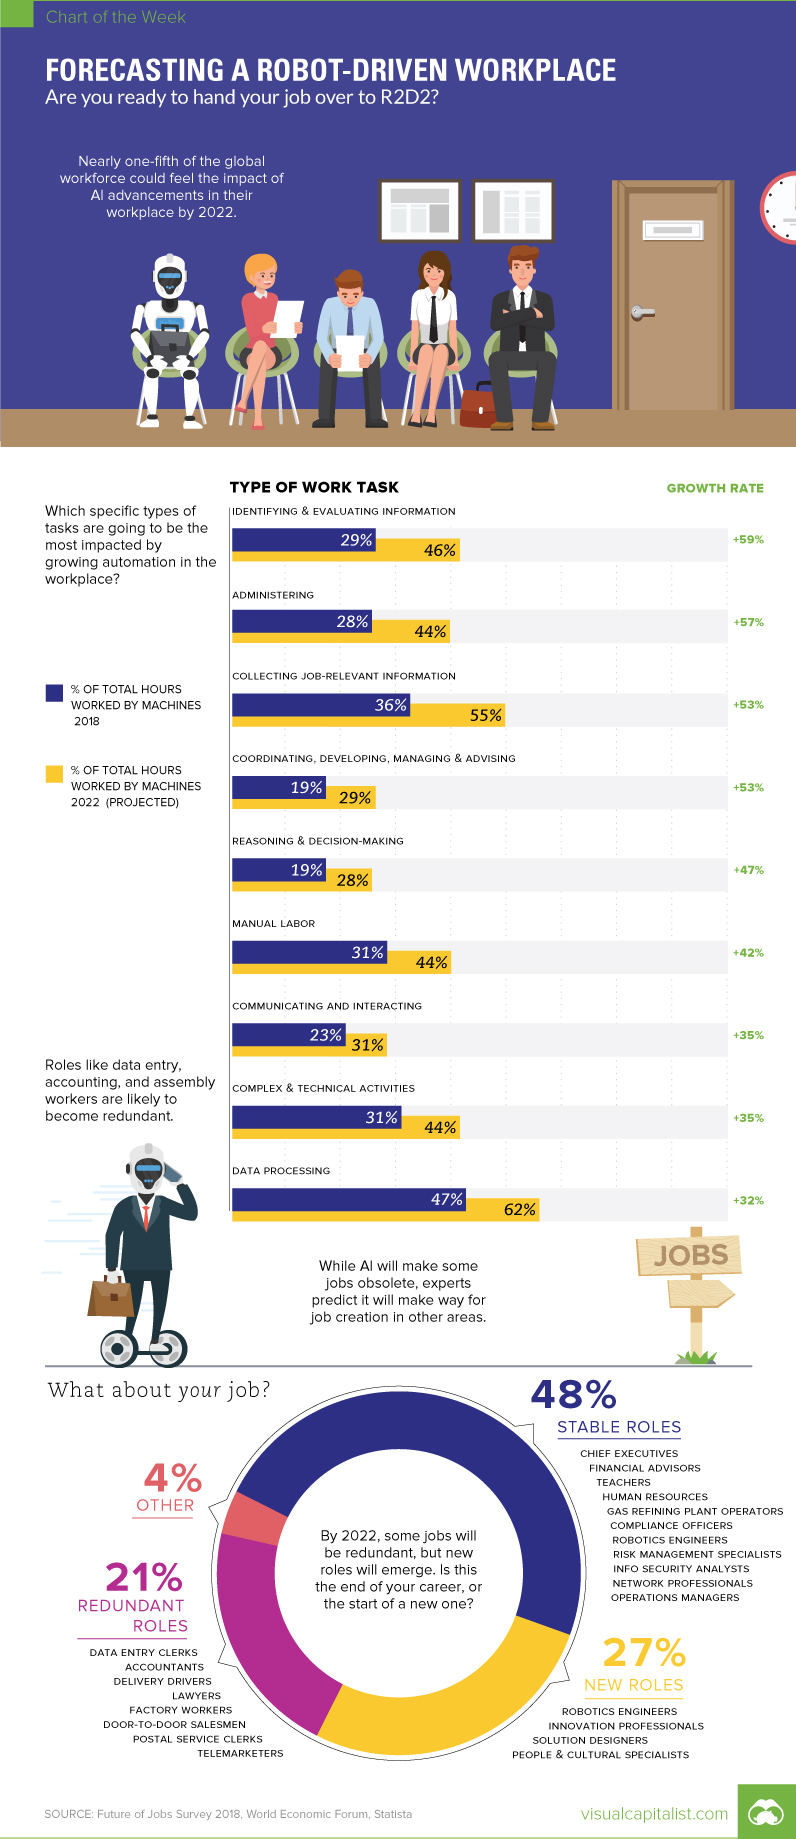
Are you ready to hand your job over to R2D2?
A recent study by the Mckinsey Global Institute forecasts up to 800 million workers worldwide could lose their jobs to automation by 2030.
Industrial machine operators, administrators, and service workers will be the first to take a hit. Meanwhile, poorer countries with lower investment in tech are less likely to feel the pinch.
Jobs Out, Jobs In
Today’s chart uses data from the Future of Jobs Report 2018 by the World Economic Forum to take a peek at the changes technology will bring over the next four years.
It shows while humans are handing over a larger share of labor hours to their robot counterparts, the future isn’t all bleak. Although 75 million jobs could be displaced by the coming shift in labor, there will be 133 million new jobs created as well. While certain jobs are becoming redundant, human skills remain in demand in other areas.
Here is the full list of jobs on the chopping block in 2022, as well as the careers that will rise in importance:
| Stable Roles | New Roles | Redundant Roles |
|---|---|---|
| Managing Directors and Chief Executives | Data Analysts and Scientists* | Data Entry Clerks |
| General and Operations Managers* | AI and Machine Learning Specialists | Accounting, Bookkeeping and Payroll Clerks |
| Software and Applications Developers and Analysts* | General and Operations Managers* | Administrative and Executive Secretaries |
| Data Analysts and Scientists* | Big Data Specialists | Assembly and Factory Workers |
| Sales and Marketing Professionals* | Digital Transformation Specialists | Client Information and Customer Service Workers* |
| Sales Representatives, Wholesale and Manufacturing, Technical and Scientific Products | Sales and Marketing Professionals* | Business Services and Administration Managers |
| Human Resources Specialists | New Technology Specialists | Accountants and Auditors |
| Financial and Investment Advisers | Organizational Development Specialists* | Material-Recording and Stock-Keeping Clerks |
| Database and Network Professionals | Software and Applications Developers and Analysts* | General and Operations Managers* |
| Supply Chain and Logistics Specialists | Information Technology Services | Postal Service Clerks |
| Risk Management Specialists | Process Automation Specialists | Financial Analysts |
| Information Security Analysts* | Innovation Professionals | Cashiers and Ticket Clerks |
| Management and Organization Analysts | Information Security Analysts* | Mechanics and Machinery Repairers |
| Electrotechnology Engineers | Ecommerce and Social Media Specialists | Telemarketers |
| Organizational Development Specialists* | User Experience and Human-Machine | Electronics and Telecommunications Installers and Repairers |
| Chemical Processing Plant Operators | Interaction Designers | Bank Tellers and Related Clerks |
| University and Higher Education Teachers | Training and Development Specialists | Car, Van and Motorcycle Drivers |
| Compliance Officers | Robotics Specialists and Engineers | Sales and Purchasing Agents and Brokers |
| Energy and Petroleum Engineers | People and Culture Specialists | Door-To-Door Sales Workers, News and Street Vendors, and Related Workers |
| Robotics Specialists and Engineers | Client Information and Customer Service Workers* | Statistical, Finance and Insurance Clerks |
| Petroleum and Natural Gas Refining Plant Operators | Service and Solutions Designers | Lawyers |
| Digital Marketing and Strategy Specialists |
Source: Future of Jobs Survey 2018, World Economic Forum. Roles marked with * appear across multiple columns. This reflects the fact that they might be seeing stable or declining demand across one industry, but be in demand in another.
New Jobs For A New World
While this coming wave of automation is bound impact the workplace, for now you might want to leave that torch and pitchfork at home – the robots aren’t out to steal your job just yet.
Oxford University researchers predict 47% of American jobs are likely to face automation over the next 20 years. However, the same study reveals 53% of jobs are unlikely to be affected at all. Robots are less likely to take over roles dependent on human interaction – like doctors and teachers. Workers in specialized roles, such as plumbing and care work, can breathe easy too.
Jobs in manufacturing, transport, and administration may decrease. But a potential rise in health, science, tech, and hospitality jobs is likely to offset this trend.
So the real question is, will robots replace your job, or make room for you to pursue a new career?
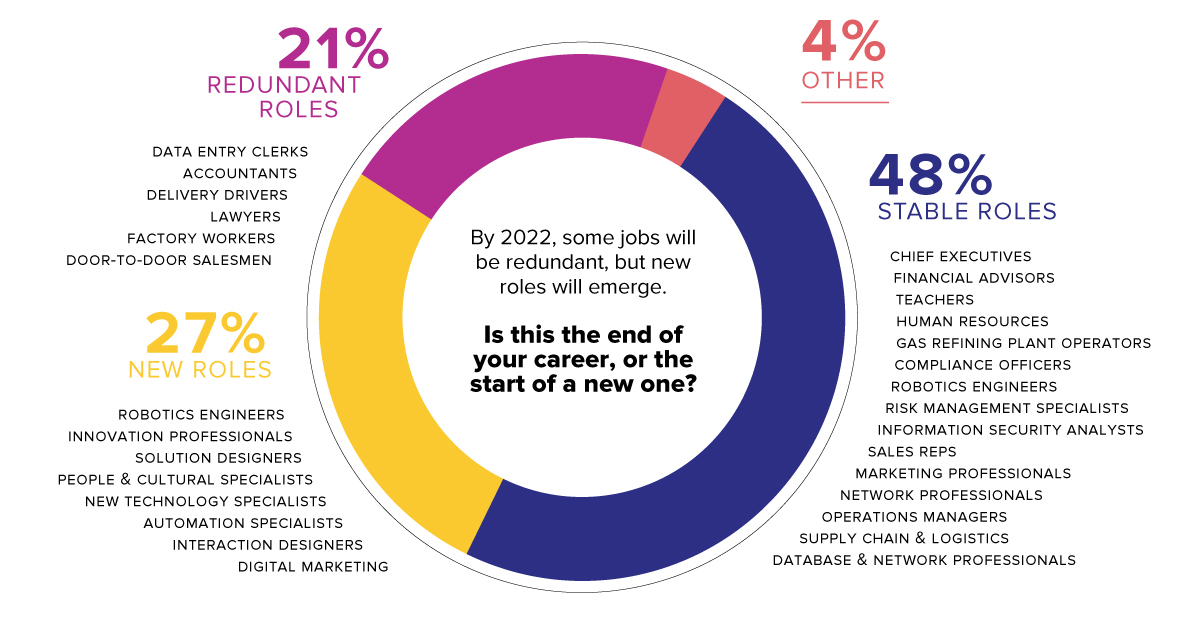


Chart of the Week
The Road to Recovery: Which Economies are Reopening?
We look at mobility rates as well as COVID-19 recovery rates for 41 economies, to see which countries are reopening for business.

The Road to Recovery: Which Economies are Reopening?
COVID-19 has brought the world to a halt—but after months of uncertainty, it seems that the situation is slowly taking a turn for the better.
Today’s chart measures the extent to which 41 major economies are reopening, by plotting two metrics for each country: the mobility rate and the COVID-19 recovery rate:
- Mobility Index
This refers to the change in activity around workplaces, subtracting activity around residences, measured as a percentage deviation from the baseline. - COVID-19 Recovery Rate
The number of recovered cases in a country is measured as the percentage of total cases.
Data for the first measure comes from Google’s COVID-19 Community Mobility Reports, which relies on aggregated, anonymous location history data from individuals. Note that China does not show up in the graphic as the government bans Google services.
COVID-19 recovery rates rely on values from CoronaTracker, using aggregated information from multiple global and governmental databases such as WHO and CDC.
Reopening Economies, One Step at a Time
In general, the higher the mobility rate, the more economic activity this signifies. In most cases, mobility rate also correlates with a higher rate of recovered people in the population.
Here’s how these countries fare based on the above metrics.
| Country | Mobility Rate | Recovery Rate | Total Cases | Total Recovered |
|---|---|---|---|---|
| Argentina | -56% | 31.40% | 14,702 | 4,617 |
| Australia | -41% | 92.03% | 7,150 | 6,580 |
| Austria | -100% | 91.93% | 16,628 | 15,286 |
| Belgium | -105% | 26.92% | 57,849 | 15,572 |
| Brazil | -48% | 44.02% | 438,812 | 193,181 |
| Canada | -67% | 52.91% | 88,512 | 46,831 |
| Chile | -110% | 41.58% | 86,943 | 36,150 |
| Colombia | -73% | 26.28% | 25,366 | 6,665 |
| Czechia | -29% | 70.68% | 9,140 | 6,460 |
| Denmark | -93% | 88.43% | 11,512 | 10,180 |
| Finland | -93% | 81.57% | 6,743 | 5,500 |
| France | -100% | 36.08% | 186,238 | 67,191 |
| Germany | -99% | 89.45% | 182,452 | 163,200 |
| Greece | -32% | 47.28% | 2,906 | 1,374 |
| Hong Kong | -10% | 97.00% | 1,067 | 1,035 |
| Hungary | -49% | 52.31% | 3,816 | 1,996 |
| India | -65% | 42.88% | 165,386 | 70,920 |
| Indonesia | -77% | 25.43% | 24,538 | 6,240 |
| Ireland | -79% | 88.92% | 24,841 | 22,089 |
| Israel | -31% | 87.00% | 16,872 | 14,679 |
| Italy | -52% | 64.99% | 231,732 | 150,604 |
| Japan | -33% | 84.80% | 16,683 | 14,147 |
| Malaysia | -53% | 80.86% | 7,629 | 6,169 |
| Mexico | -69% | 69.70% | 78,023 | 54,383 |
| Netherlands | -97% | 0.01% | 45,950 | 3 |
| New Zealand | -21% | 98.01% | 1,504 | 1,474 |
| Norway | -100% | 91.87% | 8,411 | 7,727 |
| Philippines | -87% | 23.08% | 15,588 | 3,598 |
| Poland | -36% | 46.27% | 22,825 | 10,560 |
| Portugal | -65% | 58.99% | 31,596 | 18,637 |
| Singapore | -105% | 55.02% | 33,249 | 18,294 |
| South Africa | -74% | 52.44% | 27,403 | 14,370 |
| South Korea | -4% | 91.15% | 11,344 | 10,340 |
| Spain | -67% | 69.11% | 284,986 | 196,958 |
| Sweden | -93% | 13.91% | 35,727 | 4,971 |
| Switzerland | -101% | 91.90% | 30,796 | 28,300 |
| Taiwan | 4% | 95.24% | 441 | 420 |
| Thailand | -36% | 96.08% | 3,065 | 2,945 |
| U.S. | -56% | 28.20% | 1,768,346 | 498,720 |
| United Kingdom | -82% | 0.05% | 269,127 | 135 |
| Vietnam | 15% | 85.02% | 327 | 278 |
Mobility data as of May 21, 2020 (Latest available). COVID-19 case data as of May 29, 2020.
In the main scatterplot visualization, we’ve taken things a step further, assigning these countries into four distinct quadrants:
1. High Mobility, High Recovery
High recovery rates are resulting in lifted restrictions for countries in this quadrant, and people are steadily returning to work.
New Zealand has earned praise for its early and effective pandemic response, allowing it to curtail the total number of cases. This has resulted in a 98% recovery rate, the highest of all countries. After almost 50 days of lockdown, the government is recommending a flexible four-day work week to boost the economy back up.
2. High Mobility, Low Recovery
Despite low COVID-19 related recoveries, mobility rates of countries in this quadrant remain higher than average. Some countries have loosened lockdown measures, while others did not have strict measures in place to begin with.
Brazil is an interesting case study to consider here. After deferring lockdown decisions to state and local levels, the country is now averaging the highest number of daily cases out of any country. On May 28th, for example, the country had 24,151 new cases and 1,067 new deaths.
3. Low Mobility, High Recovery
Countries in this quadrant are playing it safe, and holding off on reopening their economies until the population has fully recovered.
Italy, the once-epicenter for the crisis in Europe is understandably wary of cases rising back up to critical levels. As a result, it has opted to keep its activity to a minimum to try and boost the 65% recovery rate, even as it slowly emerges from over 10 weeks of lockdown.
4. Low Mobility, Low Recovery
Last but not least, people in these countries are cautiously remaining indoors as their governments continue to work on crisis response.
With a low 0.05% recovery rate, the United Kingdom has no immediate plans to reopen. A two-week lag time in reporting discharged patients from NHS services may also be contributing to this low number. Although new cases are leveling off, the country has the highest coronavirus-caused death toll across Europe.
The U.S. also sits in this quadrant with over 1.7 million cases and counting. Recently, some states have opted to ease restrictions on social and business activity, which could potentially result in case numbers climbing back up.
Over in Sweden, a controversial herd immunity strategy meant that the country continued business as usual amid the rest of Europe’s heightened regulations. Sweden’s COVID-19 recovery rate sits at only 13.9%, and the country’s -93% mobility rate implies that people have been taking their own precautions.
COVID-19’s Impact on the Future
It’s important to note that a “second wave” of new cases could upend plans to reopen economies. As countries reckon with these competing risks of health and economic activity, there is no clear answer around the right path to take.
COVID-19 is a catalyst for an entirely different future, but interestingly, it’s one that has been in the works for a while.
Without being melodramatic, COVID-19 is like the last nail in the coffin of globalization…The 2008-2009 crisis gave globalization a big hit, as did Brexit, as did the U.S.-China trade war, but COVID is taking it to a new level.
—Carmen Reinhart, incoming Chief Economist for the World Bank
Will there be any chance of returning to “normal” as we know it?

-

 Mining2 weeks ago
Charted: The Value Gap Between the Gold Price and Gold Miners
-

 Real Estate1 week ago
Ranked: The Most Valuable Housing Markets in America
-

 Business1 week ago
Charted: Big Four Market Share by S&P 500 Audits
-

 AI1 week ago
The Stock Performance of U.S. Chipmakers So Far in 2024
-

 Misc1 week ago
Almost Every EV Stock is Down After Q1 2024
-

 Money2 weeks ago
Where Does One U.S. Tax Dollar Go?
-

 Green2 weeks ago
Ranked: Top Countries by Total Forest Loss Since 2001
-

 Real Estate2 weeks ago
Visualizing America’s Shortage of Affordable Homes