Money
U.S. Debt: Visualizing the $31.4 Trillion Owed in 2023
Article/Editing:
U.S. Debt: Visualizing the $31.4 Trillion Owed in 2023
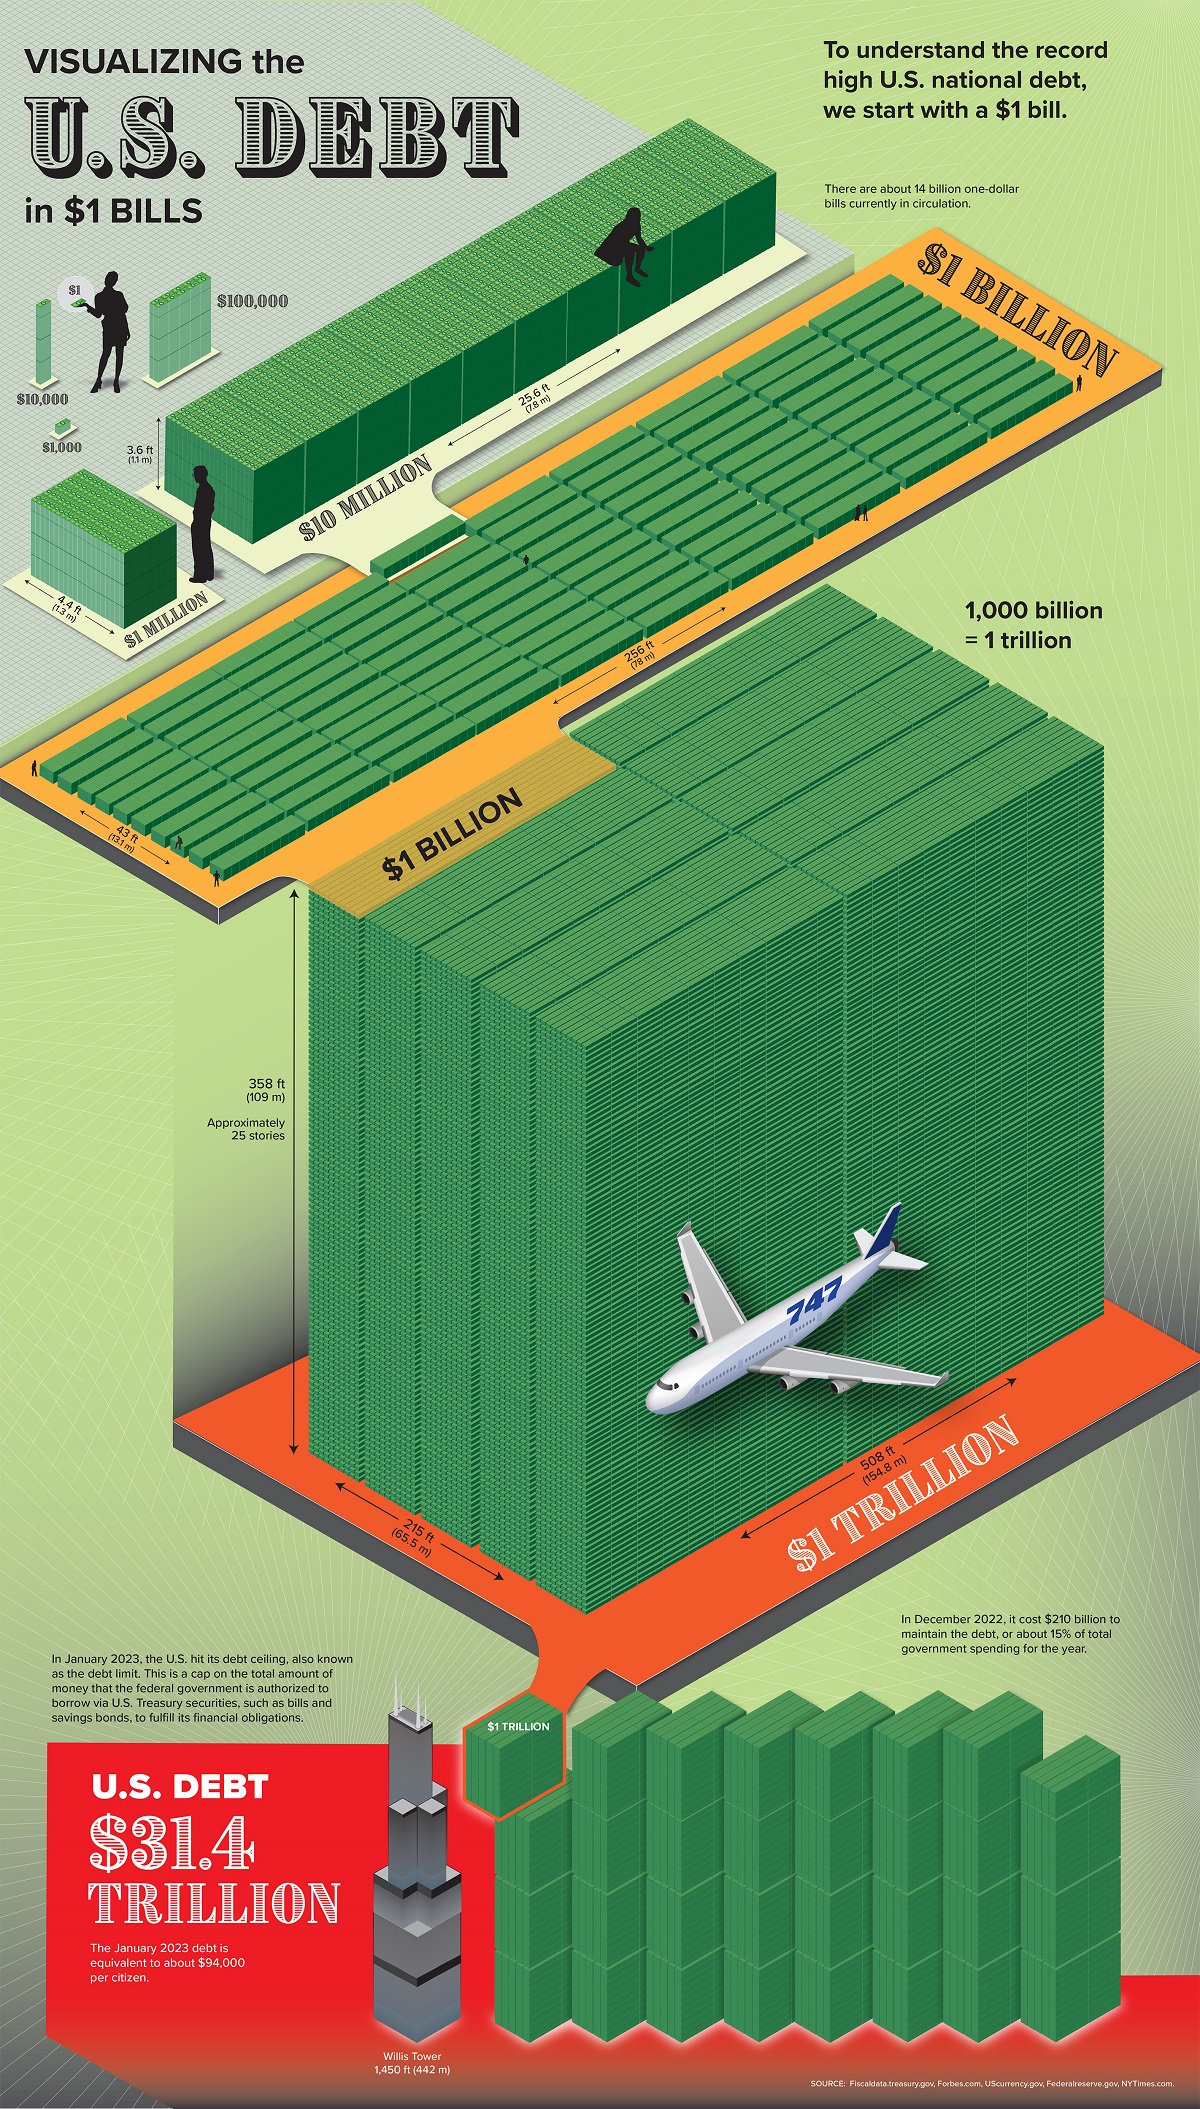
Can you picture what $31.4 trillion looks like?
The enormity of U.S. government debt is hard for the average person to wrap their head around. For instance, compared to the median U.S. mortgage, the current level of federal debt is 230 million times larger.
In this graphic, Julie Peasley shows how many one-dollar bills it would take to stack up to the total U.S. debt of $31.4 trillion.
How Did U.S. Debt Get So High?
U.S. national debt is how much money the federal government owes to creditors. When the government spends more than it earns, it has a budget deficit and must issue debt in the form of Treasury securities.
The U.S. has run a deficit for the last 20 years, substantially increasing the national debt. In fact, according to the Department of the Treasury, the current debt is $31.4 trillion.
Stacked up in one-dollar bills, the U.S. debt would be equivalent to almost eight of Chicago’s 110-story Willis Tower.
| Year | Outstanding Debt | Year-Over-Year Increase |
|---|---|---|
| 2023* | $31.4T | 2% |
| 2022 | $30.9T | 9% |
| 2021 | $28.4T | 6% |
| 2020 | $26.9T | 19% |
| 2019 | $22.7T | 6% |
| 2018 | $21.5T | 6% |
| 2017 | $20.2T | 3% |
| 2016 | $19.6T | 8% |
| 2015 | $18.2T | 2% |
| 2014 | $17.8T | 6% |
| 2013 | $16.7T | 4% |
| 2012 | $16.1T | 9% |
| 2011 | $14.8T | 9% |
| 2010 | $13.6T | 14% |
| 2009 | $11.9T | 19% |
| 2008 | $10.0T | 11% |
| 2007 | $9.0T | 6% |
| 2006 | $8.5T | 7% |
| 2005 | $7.9T | 8% |
| 2004 | $7.4T | 9% |
| 2003 | $6.8T | 9% |
| 2002 | $6.2T | 7% |
| 2001 | $5.8T | 2% |
| 2000 | $5.7T | 0% |
Source: Fiscal Data. Debt for 2023 is as of January, with the year-over-year increase reflecting the growth from October 2022 to January 2023. October is the start of the fiscal year for the U.S. government. Debt includes both debt held by the public and intragovernmental holdings.
The last time the government had a surplus was in 2001, when debt rose only 2% due to interest costs. Since then, the largest jumps in U.S. debt have been during the Global Financial Crisis—which saw three straight years of double-digit growth rates—and in 2020 due to trillions of dollars of COVID-19 stimulus.
U.S. federal debt rises during recessions because government revenue, primarily composed of taxes, decreases. At the same time, the government increases spending to help stimulate an economic recovery.
And in today’s case, the U.S. is facing additional financial issues. As the country’s senior population grows and people live longer, this puts pressure on programs that serve older Americans such as Social Security. Healthcare is becoming more expensive and is the second-fastest growing part of the U.S. budget.
The Pros and Cons of Debt
U.S. debt helps fund critical programs for Americans, including retirement and disability benefits, healthcare, economic security, and national defense.
As one example of the impact of these programs, income security nearly halved the percent of the population living below the poverty line in 2019 from 22.8% to 12.2%.
Of course, U.S. debt also comes with challenges. A chief concern is the ability to pay the interest costs on U.S. debt, especially as interest rates rise.
Before rate hikes began, interest costs amounted to 6% of the U.S. budget in the 2021 fiscal year. Fast forward to December 2022, and interest costs amounted to 15% of total government spending since the start of the fiscal year in October.
Addressing the Problem
In January 2023, the U.S. hit its debt ceiling, also known as its borrowing limit. While some countries tie their debt to GDP, the U.S. sets an exact limit in dollar terms.
The government would run out of money to pay its debts this summer if the ceiling is not raised, though policymakers have historically agreed to debt ceiling increases in the past to avoid a default. In 2011, the U.S. narrowly avoided default due to a last-minute debt ceiling negotiation and the country’s credit rating was downgraded as a result.
Tackling U.S. debt is simple in theory: raise taxes or the debt limit, reduce spending, or a combination of all three. However, it’s much more difficult in practice. Which taxes should be raised? Which programs should be cut? What happens the next time the debt limit is reached?

This article was published as a part of Visual Capitalist's Creator Program, which features data-driven visuals from some of our favorite Creators around the world.


Money
How Debt-to-GDP Ratios Have Changed Since 2000
See how much the debt-to-GDP ratios of advanced economies have grown (or shrank) since the year 2000.


How Debt-to-GDP Ratios Have Changed Since 2000
This was originally posted on our Voronoi app. Download the app for free on Apple or Android and discover incredible data-driven charts from a variety of trusted sources.
Government debt levels have grown in most parts of the world since the 2008 financial crisis, and even more so after the COVID-19 pandemic.
To gain perspective on this long-term trend, we’ve visualized the debt-to-GDP ratios of advanced economies, as of 2000 and 2024 (estimated). All figures were sourced from the IMF’s World Economic Outlook.
Data and Highlights
The data we used to create this graphic is listed in the table below. “Government gross debt” consists of all liabilities that require payment(s) of interest and/or principal in the future.
| Country | 2000 (%) | 2024 (%) | Change (pp) |
|---|---|---|---|
| 🇯🇵 Japan | 135.6 | 251.9 | +116.3 |
| 🇸🇬 Singapore | 82.3 | 168.3 | +86.0 |
| 🇺🇸 United States | 55.6 | 126.9 | +71.3 |
| 🇬🇧 United Kingdom | 36.6 | 105.9 | +69.3 |
| 🇬🇷 Greece | 104.9 | 160.2 | +55.3 |
| 🇫🇷 France | 58.9 | 110.5 | +51.6 |
| 🇵🇹 Portugal | 54.2 | 104.0 | +49.8 |
| 🇪🇸 Spain | 57.8 | 104.7 | +46.9 |
| 🇸🇮 Slovenia | 25.9 | 66.5 | +40.6 |
| 🇫🇮 Finland | 42.4 | 76.5 | +34.1 |
| 🇭🇷 Croatia | 35.4 | 61.8 | +26.4 |
| 🇨🇦 Canada | 80.4 | 103.3 | +22.9 |
| 🇨🇾 Cyprus | 56.0 | 70.9 | +14.9 |
| 🇦🇹 Austria | 65.7 | 74.0 | +8.3 |
| 🇸🇰 Slovak Republic | 50.5 | 56.5 | +6.0 |
| 🇩🇪 Germany | 59.3 | 64.0 | +4.7 |
| 🇧🇪 Belgium | 109.6 | 106.8 | -2.8 |
| 🇮🇱 Israel | 77.4 | 56.8 | -20.6 |
| 🇮🇸 Iceland | 75.8 | 54.6 | -21.2 |
The debt-to-GDP ratio indicates how much a country owes compared to the size of its economy, reflecting its ability to manage and repay debts. Percentage point (pp) changes shown above indicate the increase or decrease of these ratios.
Countries with the Biggest Increases
Japan (+116 pp), Singapore (+86 pp), and the U.S. (+71 pp) have grown their debt as a percentage of GDP the most since the year 2000.
All three of these countries have stable, well-developed economies, so it’s unlikely that any of them will default on their growing debts. With that said, higher government debt leads to increased interest payments, which in turn can diminish available funds for future government budgets.
This is a rising issue in the U.S., where annual interest payments on the national debt have surpassed $1 trillion for the first time ever.
Only 3 Countries Saw Declines
Among this list of advanced economies, Belgium (-2.8 pp), Iceland (-21.2 pp), and Israel (-20.6 pp) were the only countries that decreased their debt-to-GDP ratio since the year 2000.
According to Fitch Ratings, Iceland’s debt ratio has decreased due to strong GDP growth and the use of its cash deposits to pay down upcoming maturities.
See More Debt Graphics from Visual Capitalist
Curious to see which countries have the most government debt in dollars? Check out this graphic that breaks down $97 trillion in debt as of 2023.

-

 Maps2 weeks ago
Mapped: Average Wages Across Europe
-

 Money1 week ago
Which States Have the Highest Minimum Wage in America?
-

 Real Estate1 week ago
Ranked: The Most Valuable Housing Markets in America
-

 Markets1 week ago
Charted: Big Four Market Share by S&P 500 Audits
-

 AI1 week ago
The Stock Performance of U.S. Chipmakers So Far in 2024
-

 Automotive2 weeks ago
Almost Every EV Stock is Down After Q1 2024
-

 Money2 weeks ago
Where Does One U.S. Tax Dollar Go?
-

 Green2 weeks ago
Ranked: Top Countries by Total Forest Loss Since 2001