Markets
Charted: Tesla’s Global Sales By Model and Year (2016–2023)
![]() See this visualization first on the Voronoi app.
See this visualization first on the Voronoi app.
Charted: Tesla’s Global Sales By Model and Year (2016–2023)
This was originally posted on our Voronoi app. Download the app for free on Apple or Android and discover incredible data-driven charts from a variety of trusted sources.
In the last five years, Tesla stock has exploded upwards more than 800%.
From a company that was perpetually on the verge of bankruptcy, Tesla has emerged as the EV manufacturer to beat in the automotive market.
A huge part of the success comes from Tesla’s sales which jumped 30x in the same time period.
We take a look at the numbers, as well as the sales share between the different Tesla models from 2016-2023 using data from CleanTechnica, an archive for news and data around clean technology.
Tesla’s Global Sales Sales Through the Years
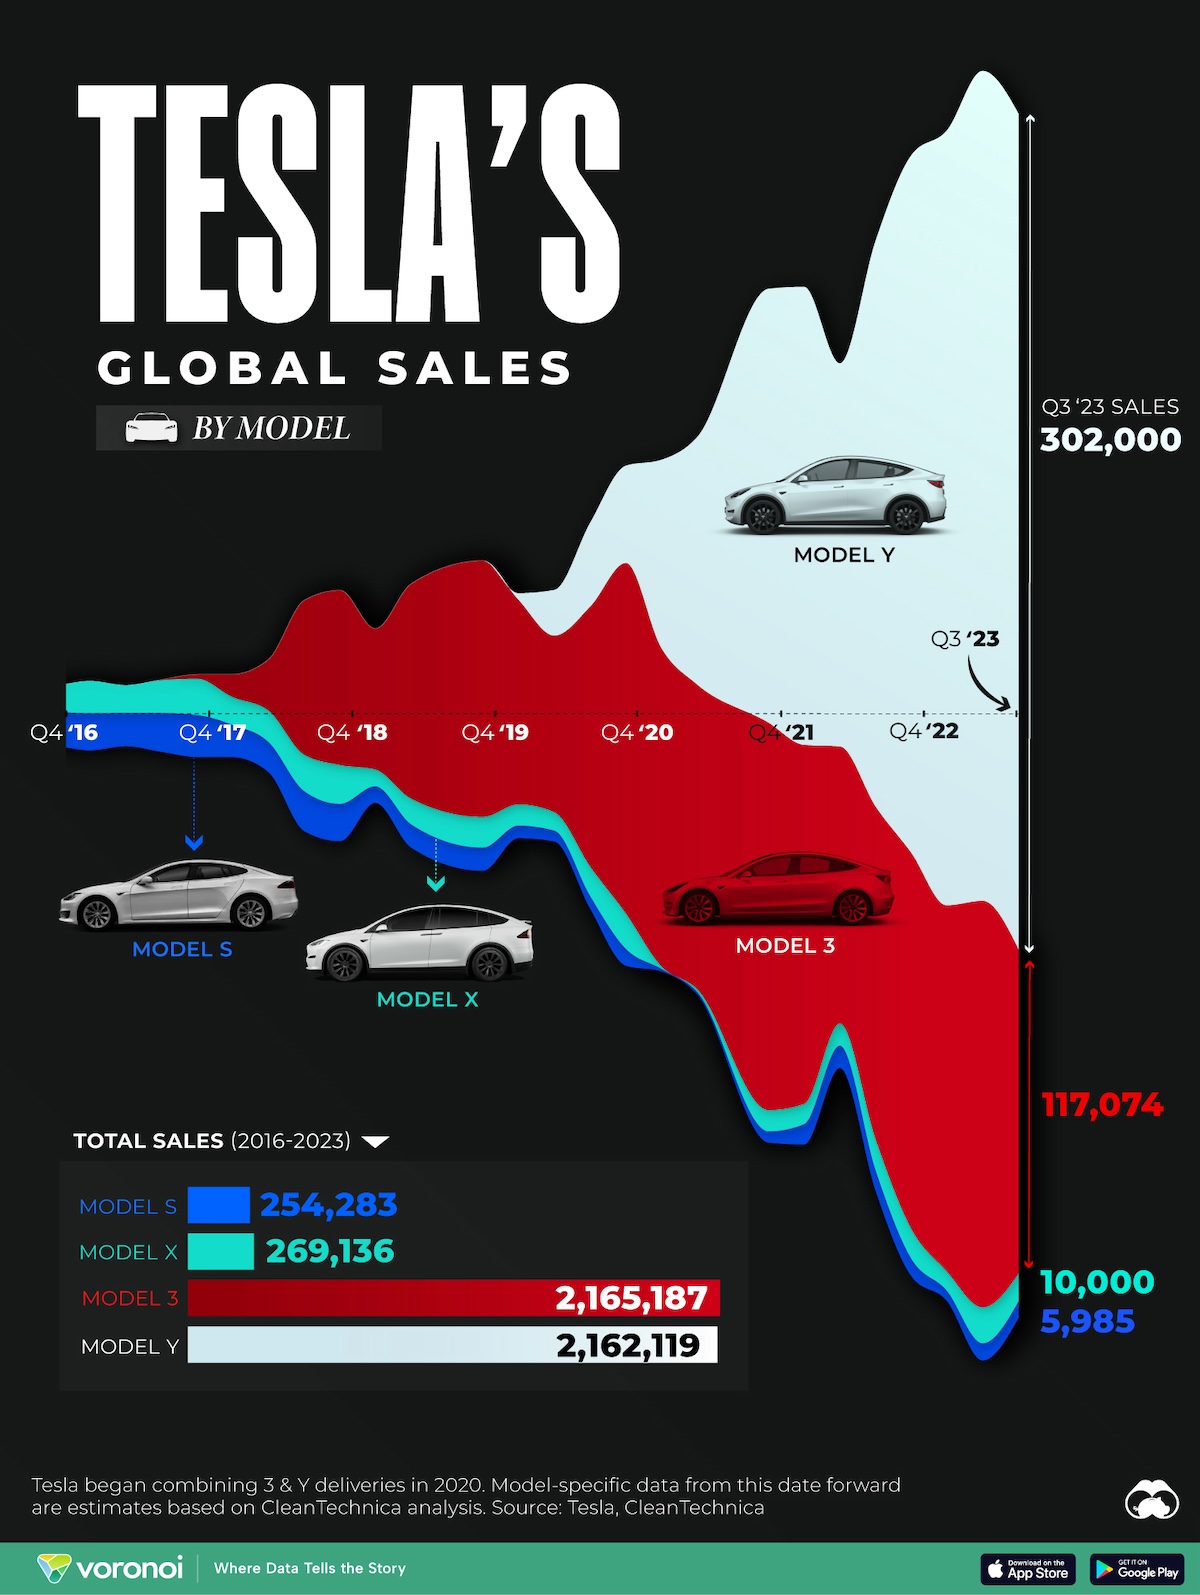
From 2018 onwards, Tesla’s global sales began to skyrocket. Though quarter-on-quarter growth wasn’t always positive, dips were followed by more breakout numbers.
Here’s the model breakdown of Tesla’s global sales, from Q2 2016 to Q3 2023.
| Date | Tesla Model S | Tesla Model X | Tesla Model 3 | Tesla Model Y |
|---|---|---|---|---|
| Q2 2016 | 9,764 | 4,638 | N/A | N/A |
| Q3 2016 | 16,047 | 8,774 | N/A | N/A |
| Q4 2016 | 12,700 | 9,500 | N/A | N/A |
| Q1 2017 | 13,481 | 11,570 | N/A | N/A |
| Q2 2017 | 12,010 | 10,010 | N/A | N/A |
| Q3 2017 | 14,065 | 11,865 | 220 | N/A |
| Q4 2017 | 15,200 | 13,120 | 1,550 | N/A |
| Q1 2018 | 11,730 | 10,070 | 8,180 | N/A |
| Q2 2018 | 10,930 | 11,370 | 18,440 | N/A |
| Q3 2018 | 14,470 | 13,190 | 55,840 | N/A |
| Q4 2018 | 13,500 | 14,050 | 63,150 | N/A |
| Q1 2019 | 6,000 | 6,100 | 50,900 | N/A |
| Q2 2019 | 8,422 | 9,300 | 77,634 | N/A |
| Q3 2019 | 8,383 | 9,100 | 79,703 | N/A |
| Q4 2019 | 8,375 | 11,100 | 92,620 | N/A |
| Q1 2020 | 4,525 | 7,705 | 73,975 | 2,291 |
| Q2 2020 | 3,927 | 6,687 | 63,793 | 16,484 |
| Q3 2020 | 4,583 | 10,693 | 94,049 | 30,269 |
| Q4 2020 | 6,060 | 12,860 | 126,624 | 35,123 |
| Q1 2021 | 1,010 | 1,010 | 115,077 | 67,780 |
| Q2 2021 | 890 | 1,000 | 110,054 | 89,360 |
| Q3 2021 | 9,000 | 275 | 111,225 | 120,800 |
| Q4 2021 | 4,050 | 7,700 | 140,000 | 156,850 |
| Q1 2022 | 7,362 | 7,362 | 129,764 | 165,560 |
| Q2 2022 | 8,081 | 8,081 | 100,066 | 138,467 |
| Q3 2022 | 7,469 | 11,203 | 120,308 | 204,850 |
| Q4 2022 | 6,344 | 10,803 | 135,846 | 252,285 |
| Q1 2023 | 3,695 | 7,000 | 132,180 | 280,000 |
| Q2 2023 | 6,225 | 13,000 | 146,915 | 300,000 |
| Q3 2023 | 5,985 | 10,000 | 117,074 | 302,000 |
| Total | 254,283 | 269,136 | 2,165,187 | 2,162,119 |
Note: Beginning in 2020, Tesla’s reporting began to combine Model 3 & Y sales together. Model-specific data from this point is based on CleanTechnica’s estimates.
Aside from this steep rise, another key factor to note is how Tesla’s lineup has changed. The company began ramping production with the Model S and X, two luxury models that helped the brand build a prestigious image.
However since 2020 , the company has successfully transitioned to cheaper high volume models like the Model 3 and Y.
In fact, 2020 was also the first year Tesla turned a profit thanks in part to the Model Y.
The Model 3 and Y were also the world’s best-selling EVs in 2023.
Tesla’s presumed rival, Amazon and Ford-backed Rivian, is planning a similar approach. Its first models include the relatively expensive, full-size R1T and R1S. However the company has hinted at a 2024 reveal for its cheaper R2 model, with production starting in 2026.


Economy
The Most Valuable Companies in Major EU Economies
From semiconductor equipment manufacturers to supercar makers, the EU’s most valuable companies run the gamut of industries.
Most Valuable Companies in the EU, by Country
This was originally posted on our Voronoi app. Download the app for free on iOS or Android and discover incredible data-driven charts from a variety of trusted sources.
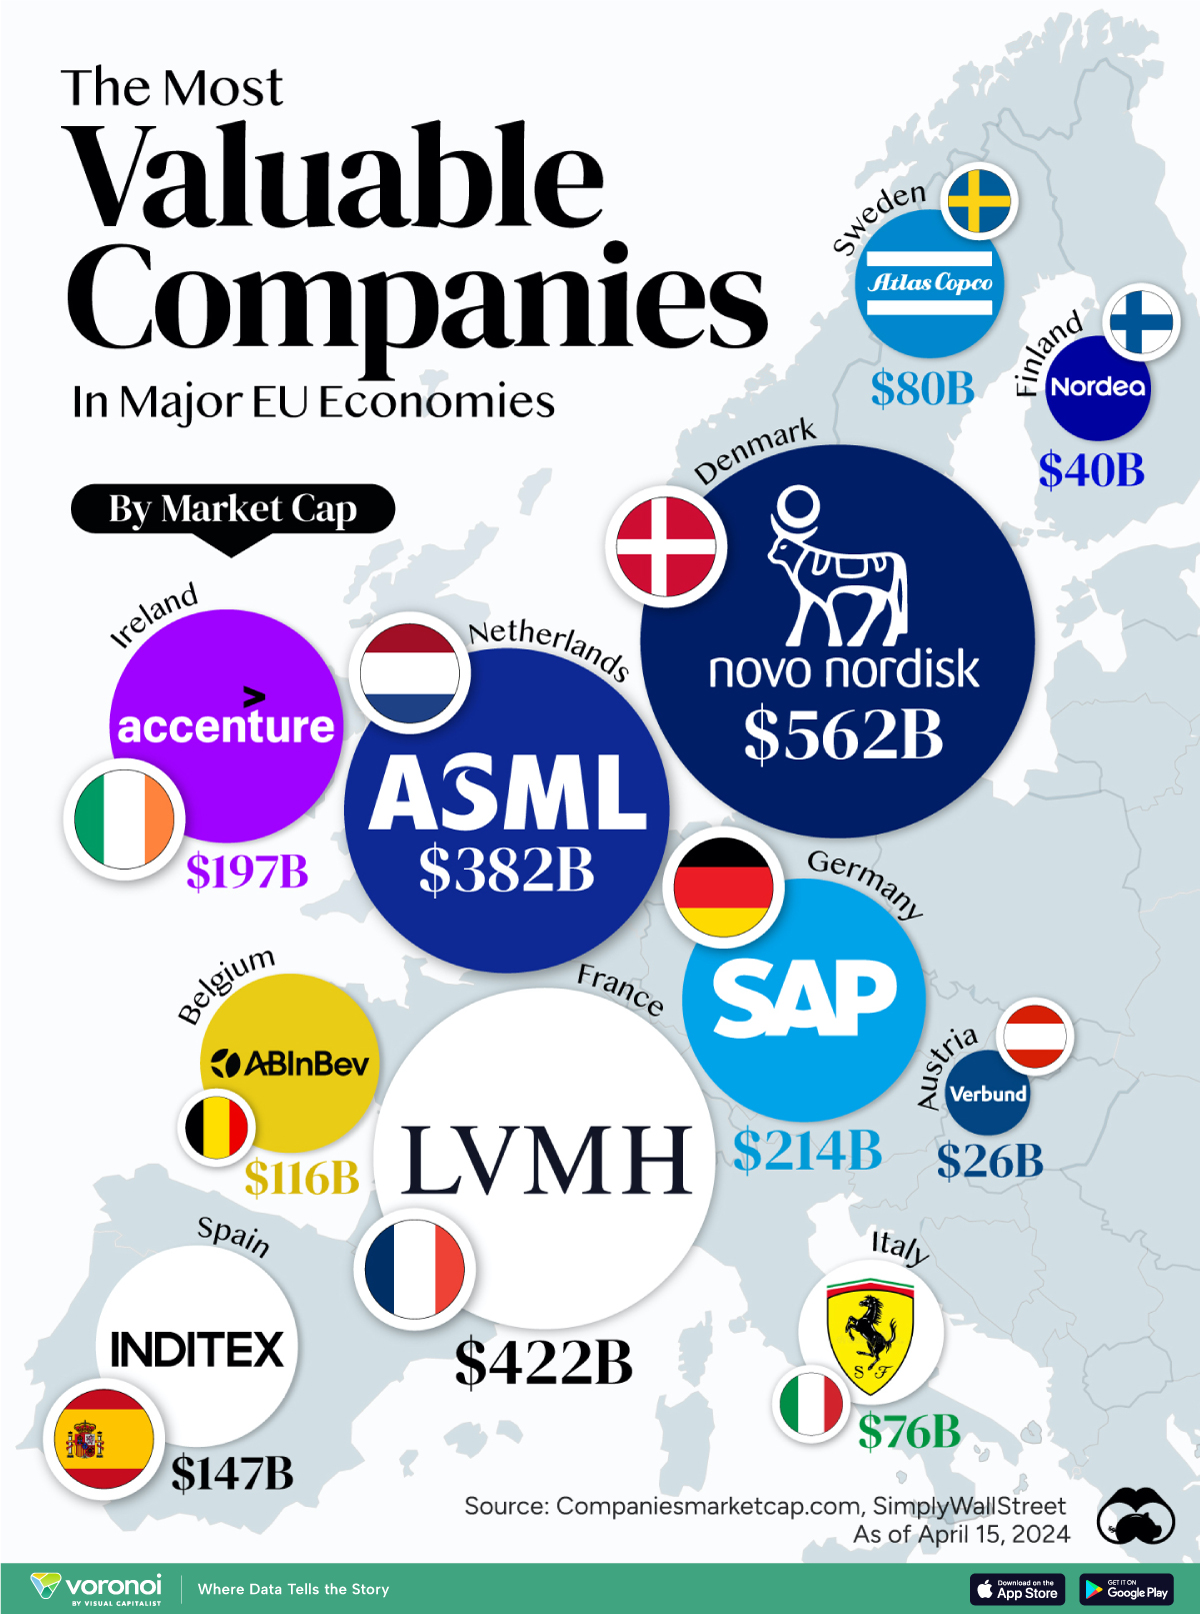
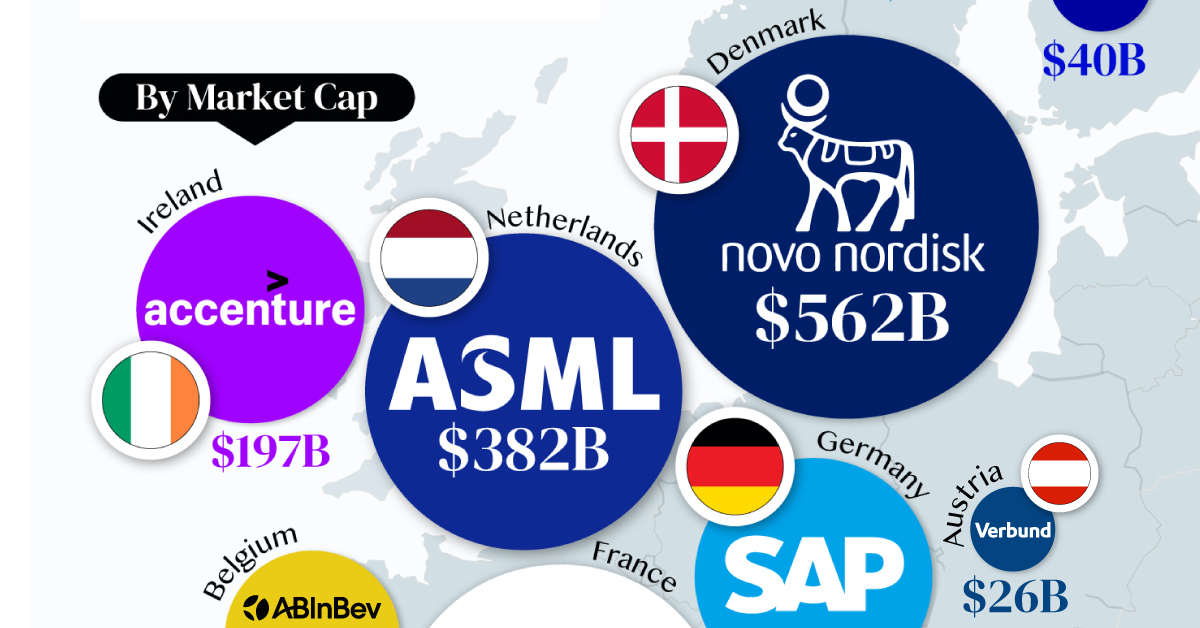
In this graphic, we mapped out the most valuable corporations in 11 major EU economies, based on their market capitalizations as of April 15th, 2024. All figures are in USD, and were sourced from Companiesmarketcap.com.
Novo Nordisk is currently worth more than $550 billion, making it Europe’s most valuable company by a wide margin. The pharmaceutical giant specializes in diabetes and weight-loss drugs. Demand for two of them, Ozempic and Wegovy, has surged due to their weight-loss capabilities, even causing nationwide shortages in the United States.
The following table includes an expanded list of the most valuable publicly-traded company in larger EU economies. Many of these were not included in the graphic due to space limitations.
| Country | Company | Sector | Market Cap |
|---|---|---|---|
| 🇩🇰 Denmark | 💊 Novo Nordisk | Pharmaceuticals | $562B |
| 🇫🇷 France | 👜 LVMH | Luxury Goods | $422B |
| 🇳🇱 Netherlands | 🔧 ASML | Semiconductor Equipment | $382B |
| 🇩🇪 Germany | 💼 SAP | Enterprise Software | $214B |
| 🇮🇪 Ireland | 🖥️ Accenture | IT Services | $197B |
| 🇪🇸 Spain | 👗 Inditex | Retail | $147B |
| 🇧🇪 Belgium | 🍻 Anheuser-Busch InBev | Beverages | $116B |
| 🇸🇪 Sweden | 🛠️ Atlas Copco | Industrial Equipment | $80B |
| 🇮🇹 Italy | 🏎️ Ferrari | Automotive | $76B |
| 🇫🇮 Finland | 🏦 Nordea Bank | Banking | $40B |
| 🇦🇹 Austria | 🔌 Verbund AG | Energy | $26B |
| 🇱🇺 Luxembourg | 🏗️ Tenaris | Oil & Gas Equipment | $22B |
| 🇨🇿 Czech Republic | 💡 CEZ Group | Energy | $20B |
| 🇵🇱 Poland | ⛽ PKN Orlen | Energy | $20B |
| 🇵🇹 Portugal | 🔌 EDP Group | Energy | $16B |
| 🇬🇷 Greece | 🏦 Eurobank | Banking | $7B |
| 🇭🇺 Hungary | ⛽ MOL Group | Energy | $7B |
| 🇭🇷 Croatia | 🏦 Zagrebacka Banka | Banking | $6B |
| 🇷🇴 Romania | ⛽ Romgaz | Energy | $4B |
| 🇸🇮 Slovenia | 💊 Krka | Pharmaceuticals | $4B |
Note: Figures are rounded and last updated on April 15th, 2024. Countries with top publicly-traded companies worth under $4 billion are excluded.
Luxury supergiant LVMH—which owns brands like Tiffany, Christian Dior, and TAG Heuer to name a few—is Europe’s second largest company by market cap, at $420 billion.
Rounding out the top three is ASML, which produces equipment crucial to chip manufacturers, worth $380 billion.
When looking at the region, there is a vast disparity between EU member states and their most valuable companies.
For example, as mentioned earlier, Denmark’s Novo Nordisk and France’s LVMH are worth between $400-550 billion each. Meanwhile, some countries don’t even have a single publicly-listed company that is worth over $1 billion.
In fact, only 12 EU countries (less than half of the union) are home to the top 100 most valuable companies within the bloc. An additional four countries are represented if you look at the list of the top 200 companies.

-

 Wealth6 days ago
Charted: Which City Has the Most Billionaires in 2024?
-

 Mining2 weeks ago
Gold vs. S&P 500: Which Has Grown More Over Five Years?
-

 Uranium2 weeks ago
The World’s Biggest Nuclear Energy Producers
-

 Education2 weeks ago
How Hard Is It to Get Into an Ivy League School?
-

 Debt2 weeks ago
How Debt-to-GDP Ratios Have Changed Since 2000
-

 Sports2 weeks ago
The Highest Earning Athletes in Seven Professional Sports
-

 Science2 weeks ago
Visualizing the Average Lifespans of Mammals
-

 Brands1 week ago
How Tech Logos Have Evolved Over Time