United States
Charted: America’s Import Reliance of Key Minerals
![]() Subscribe to the Elements free mailing list for more like this
Subscribe to the Elements free mailing list for more like this
Charted: America’s Import Reliance of Key Minerals
This was originally posted on Elements. Sign up to the free mailing list to get beautiful visualizations on real assets and resource megatrends each week.
The push towards a more sustainable future requires various key minerals to build the infrastructure of the green economy. However, the U.S. is heavily reliant on nonfuel mineral imports causing potential vulnerabilities in the nation’s supply chains.
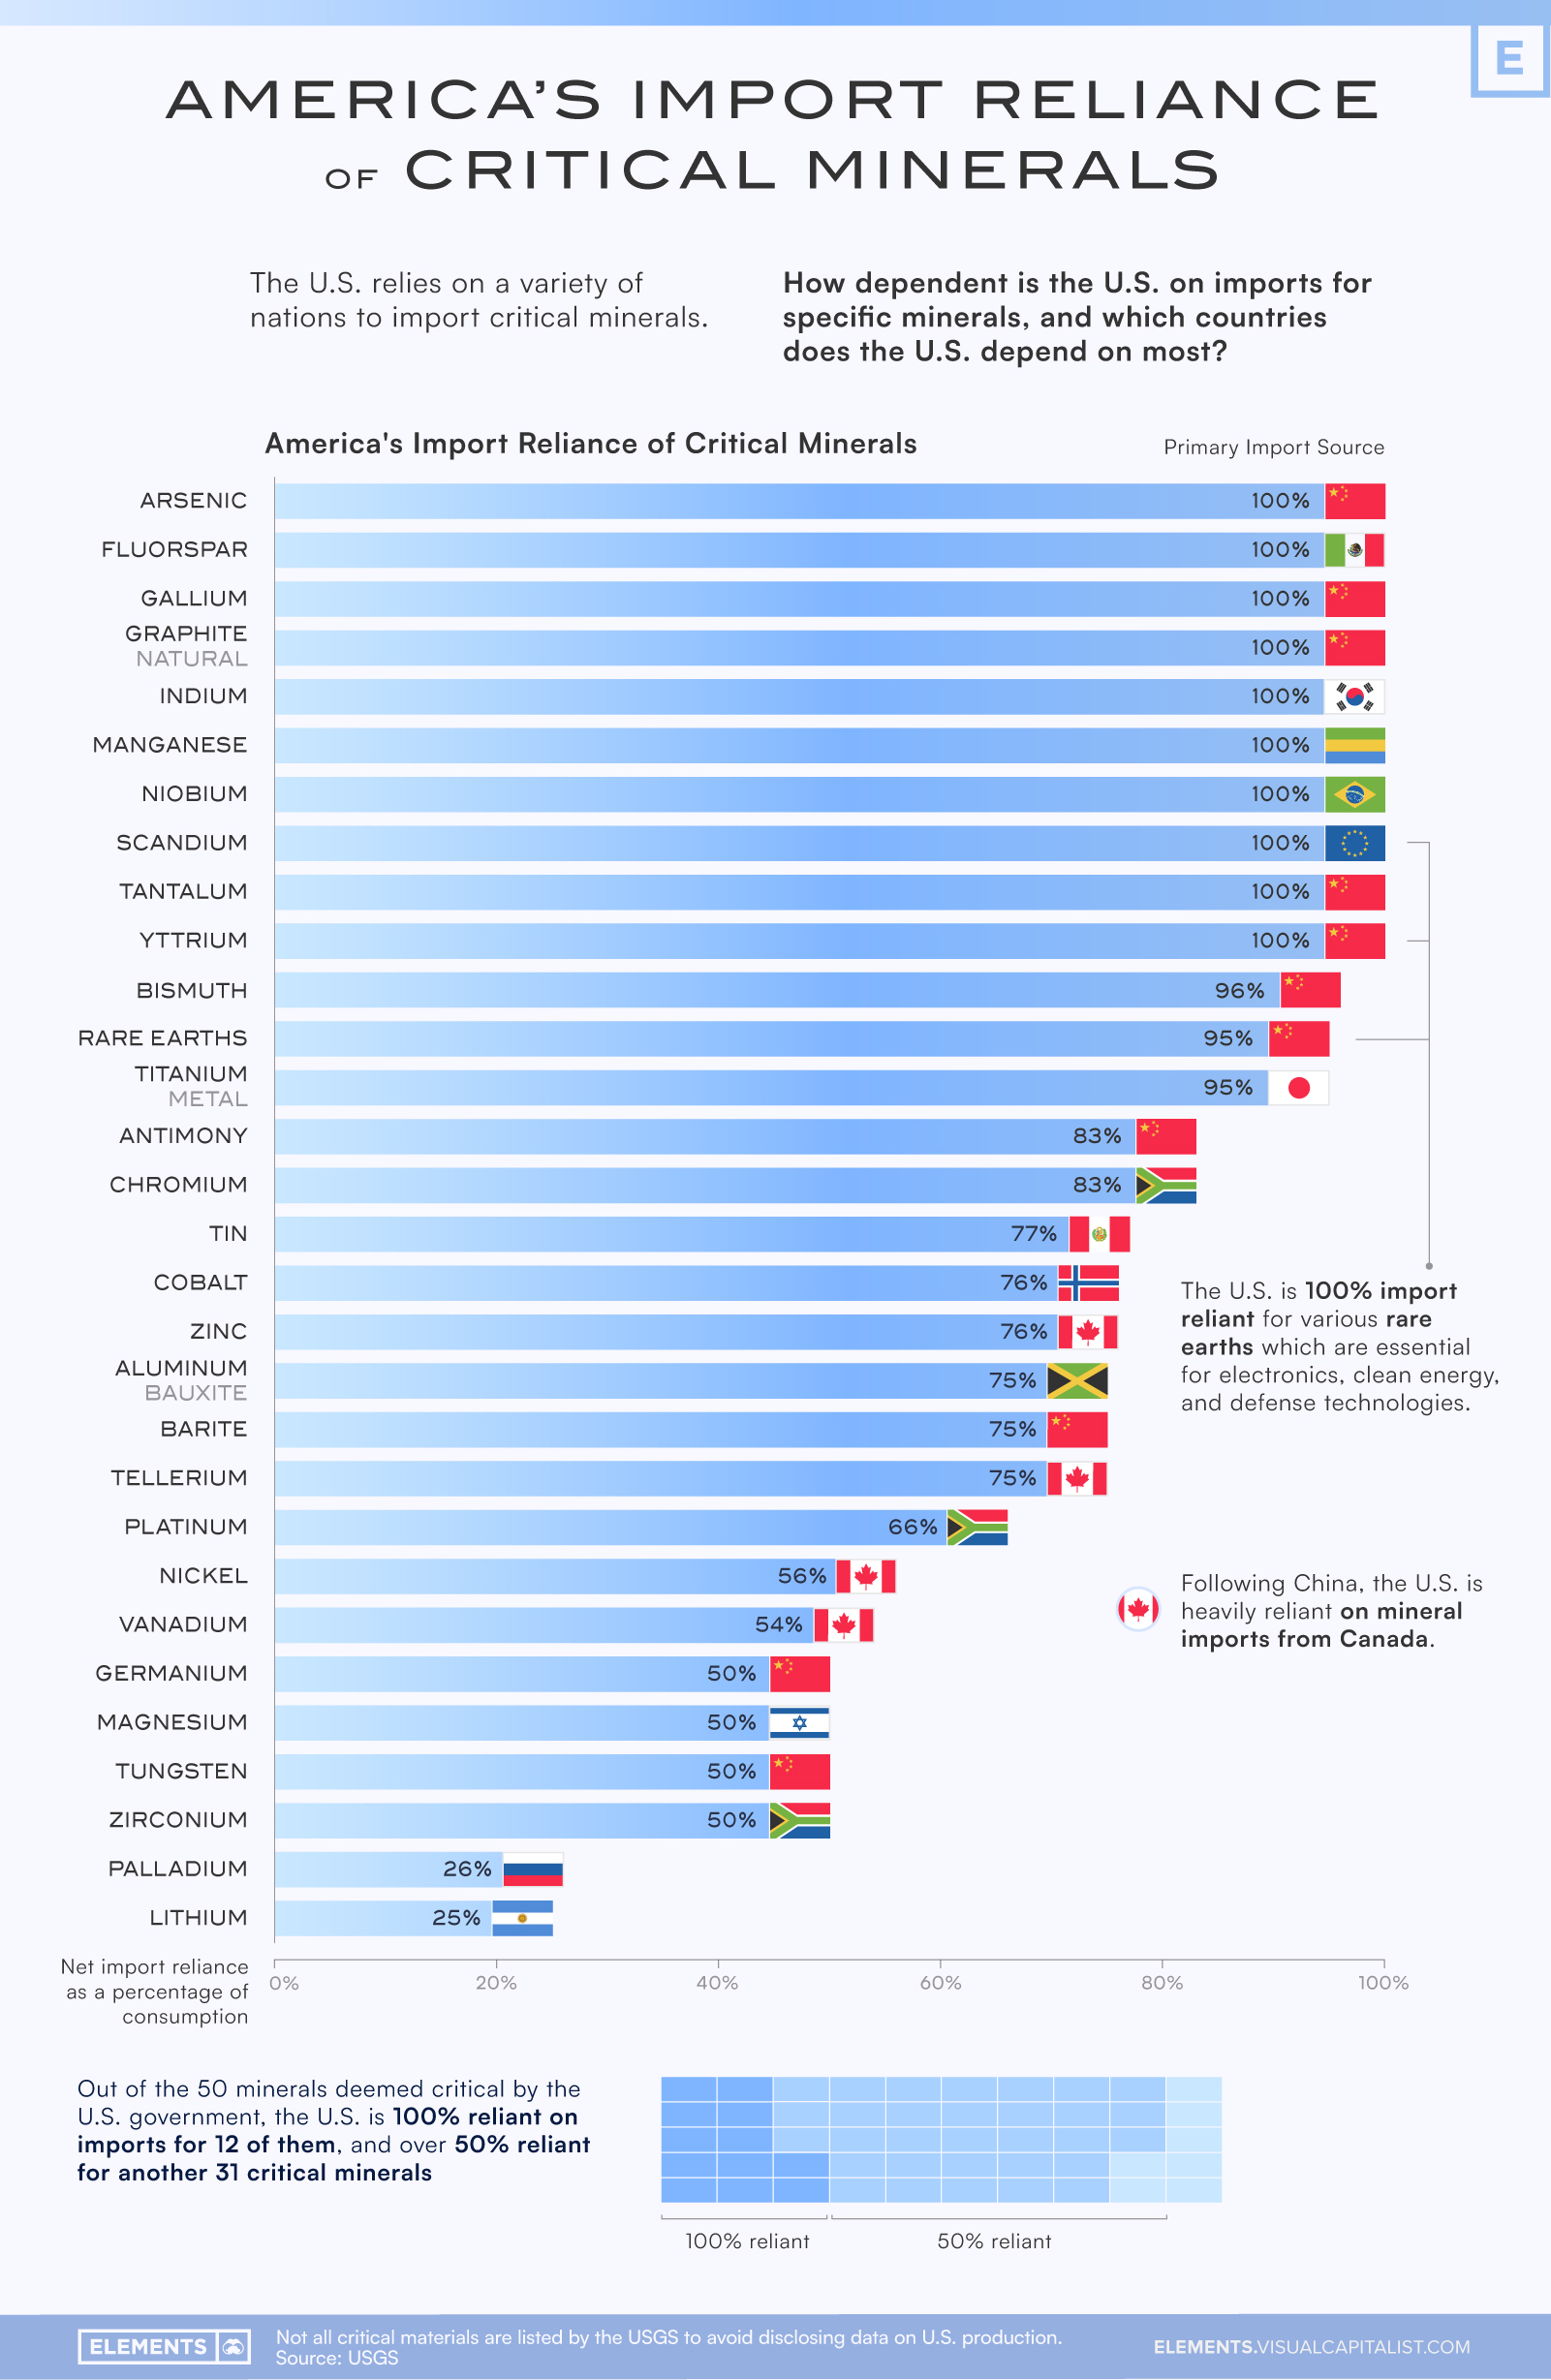
Specifically, the U.S. is 100% reliant on imports for at least 12 key minerals deemed critical by the government, with China being the primary import source for many of these along with many other critical minerals.
This graphic uses data from the U.S. Geological Survey (USGS) to visualize America’s import dependence for 30 different key nonfuel minerals along with the nation that the U.S. primarily imports each mineral from.
U.S. Import Reliance, by Mineral
While the U.S. mines and processes a significant amount of minerals domestically, in 2022 imports still accounted for more than half of the country’s consumption of 51 nonfuel minerals. The USGS calculates a net import reliance as a percentage of apparent consumption, showing how much of U.S. demand for each mineral is met through imports.
Of the most important minerals deemed by the USGS, the U.S. was 95% or more reliant on imports for 13 different minerals, with China being the primary import source for more than half of these.
| Mineral | Net Import Reliance as Percentage of Consumption | Primary Import Source (2018-2021) |
|---|---|---|
| Arsenic | 100% | 🇨🇳 China |
| Fluorspar | 100% | 🇲🇽 Mexico |
| Gallium | 100% | 🇨🇳 China |
| Graphite (natural) | 100% | 🇨🇳 China |
| Indium | 100% | 🇰🇷 Republic of Korea |
| Manganese | 100% | 🇬🇦 Gabon |
| Niobium | 100% | 🇧🇷 Brazil |
| Scandium | 100% | 🇪🇺 Europe |
| Tantalum | 100% | 🇨🇳 China |
| Yttrium | 100% | 🇨🇳 China |
| Bismuth | 96% | 🇨🇳 China |
| Rare Earths (compounds and metals) | 95% | 🇨🇳 China |
| Titanium (metal) | 95% | 🇯🇵 Japan |
| Antimony | 83% | 🇨🇳 China |
| Chromium | 83% | 🇿🇦 South Africa |
| Tin | 77% | 🇵🇪 Peru |
| Cobalt | 76% | 🇳🇴 Norway |
| Zinc | 76% | 🇨🇦 Canada |
| Aluminum (bauxite) | 75% | 🇯🇲 Jamaica |
| Barite | 75% | 🇨🇳 China |
| Tellerium | 75% | 🇨🇦 Canada |
| Platinum | 66% | 🇿🇦 South Africa |
| Nickel | 56% | 🇨🇦 Canada |
| Vanadium | 54% | 🇨🇦 Canada |
| Germanium | 50% | 🇨🇳 China |
| Magnesium | 50% | 🇮🇱 Israel |
| Tungsten | 50% | 🇨🇳 China |
| Zirconium | 50% | 🇿🇦 South Africa |
| Palladium | 26% | 🇷🇺 Russia |
| Lithium | 25% | 🇦🇷 Argentina |
These include rare earths (a group of 17 nearly indistinguishable heavy metals with similar properties) which are essential in technology, high-powered magnets, electronics, and industry, along with natural graphite which is found in lithium-ion batteries.
These are all on the U.S. government’s critical mineral list which has a total of 50 minerals, and the U.S. is 50% or more import reliant for 43 of these minerals.
Some other minerals on the official list which the U.S. is 100% reliant on imports for are arsenic, fluorspar, indium, manganese, niobium, and tantalum, which are used in a variety of applications like the production of alloys and semiconductors along with the manufacturing of electronic components like LCD screens and capacitors.
China’s Gallium and Germanium Restrictions
America’s dependence on imports for various minerals has resulted in a new challenge resulting from China’s announced export restrictions on gallium and germanium that took effect August 1st, 2023. The U.S. is 100% import dependent for gallium and 50% import dependent for germanium.
These restrictions are seen as a retaliation against U.S. and EU sanctions on China which have restricted the export of chips and chipmaking equipment.
Both gallium and germanium are used in the production of transistors and semiconductors along with solar panels and cells, and these export restrictions present an additional hurdle for critical U.S. supply chains of various technologies that include LED lights and fiber-optic systems used for high-speed data transmission.
The restrictions also affect the European Union, which imports 71% of its gallium and 45% of its germanium from China. It’s another stark reminder to the world of China’s dominance in the production and processing of many key minerals.
The announcement of these restrictions has only highlighted the importance for the U.S. and other nations to reduce import dependence and diversify supply chains of key minerals and technologies.


Wealth
Visualizing the Tax Burden of Every U.S. State
Tax burden measures the percent of an individual’s income that is paid towards taxes. See where it’s the highest by state in this graphic.


Visualizing the Tax Burden of Every U.S. State
This was originally posted on our Voronoi app. Download the app for free on iOS or Android and discover incredible data-driven charts from a variety of trusted sources.
This map graphic visualizes the total tax burden in each U.S. state as of March 2024, based on figures compiled by WalletHub.
It’s important to understand that under this methodology, the tax burden measures the percent of an average person’s income that is paid towards state and local taxes. It considers property taxes, income taxes, and sales & excise tax.
Data and Methodology
The figures we used to create this graphic are listed in the table below.
| State | Total Tax Burden |
|---|---|
| New York | 12.0% |
| Hawaii | 11.8% |
| Vermont | 11.1% |
| Maine | 10.7% |
| California | 10.4% |
| Connecticut | 10.1% |
| Minnesota | 10.0% |
| Illinois | 9.7% |
| New Jersey | 9.5% |
| Rhode Island | 9.4% |
| Utah | 9.4% |
| Kansas | 9.3% |
| Maryland | 9.3% |
| Iowa | 9.2% |
| Nebraska | 9.2% |
| Ohio | 8.9% |
| Indiana | 8.9% |
| Arkansas | 8.8% |
| Mississippi | 8.8% |
| Massachusetts | 8.6% |
| Virginia | 8.5% |
| West Virginia | 8.5% |
| Oregon | 8.4% |
| Colorado | 8.4% |
| Pennsylvania | 8.4% |
| Wisconsin | 8.3% |
| Louisiana | 8.3% |
| Kentucky | 8.3% |
| Washington | 8.0% |
| New Mexico | 8.0% |
| Michigan | 8.0% |
| North Carolina | 7.9% |
| Idaho | 7.9% |
| Arizona | 7.8% |
| Missouri | 7.8% |
| Georgia | 7.7% |
| Texas | 7.6% |
| Alabama | 7.5% |
| Montana | 7.5% |
| South Carolina | 7.5% |
| Nevada | 7.4% |
| Oklahoma | 7.0% |
| North Dakota | 6.8% |
| South Dakota | 6.4% |
| Delaware | 6.4% |
| Tennessee | 6.1% |
| Florida | 6.1% |
| Wyoming | 5.7% |
| New Hampshire | 5.6% |
| Alaska | 4.9% |
From this data we can see that New York has the highest total tax burden. Residents in this state will pay, on average, 12% of their income to state and local governments.
Breaking this down into its three components, the average New Yorker pays 4.6% of their income on income taxes, 4.4% on property taxes, and 3% in sales & excise taxes.
At the other end of the spectrum, Alaska has the lowest tax burden of any state, equaling 4.9% of income. This is partly due to the fact that Alaskans do not pay state income tax.
Hate Paying Taxes?
In addition to Alaska, there are several other U.S. states that don’t charge income taxes. These are: Florida, Nevada, South Dakota, Tennessee, Texas, Washington, and Wyoming.
It’s also worth noting that New Hampshire does not have a regular income tax, but does charge a flat 4% on interest and dividend income according to the Tax Foundation.
Learn More About Taxation From Visual Capitalist
If you enjoyed this post, be sure to check out this graphic which ranks the countries with the lowest corporate tax rates, from 1980 to today.

-

 Markets5 days ago
Visualizing Global Inflation Forecasts (2024-2026)
-

 Green2 weeks ago
The Carbon Footprint of Major Travel Methods
-

 United States2 weeks ago
Visualizing the Most Common Pets in the U.S.
-

 Culture2 weeks ago
The World’s Top Media Franchises by All-Time Revenue
-

 voronoi1 week ago
Best Visualizations of April on the Voronoi App
-

 Wealth1 week ago
Charted: Which Country Has the Most Billionaires in 2024?
-

 Business1 week ago
The Top Private Equity Firms by Country
-

 Markets1 week ago
The Best U.S. Companies to Work for According to LinkedIn