Energy
Chart: The Evolution of Standard Oil
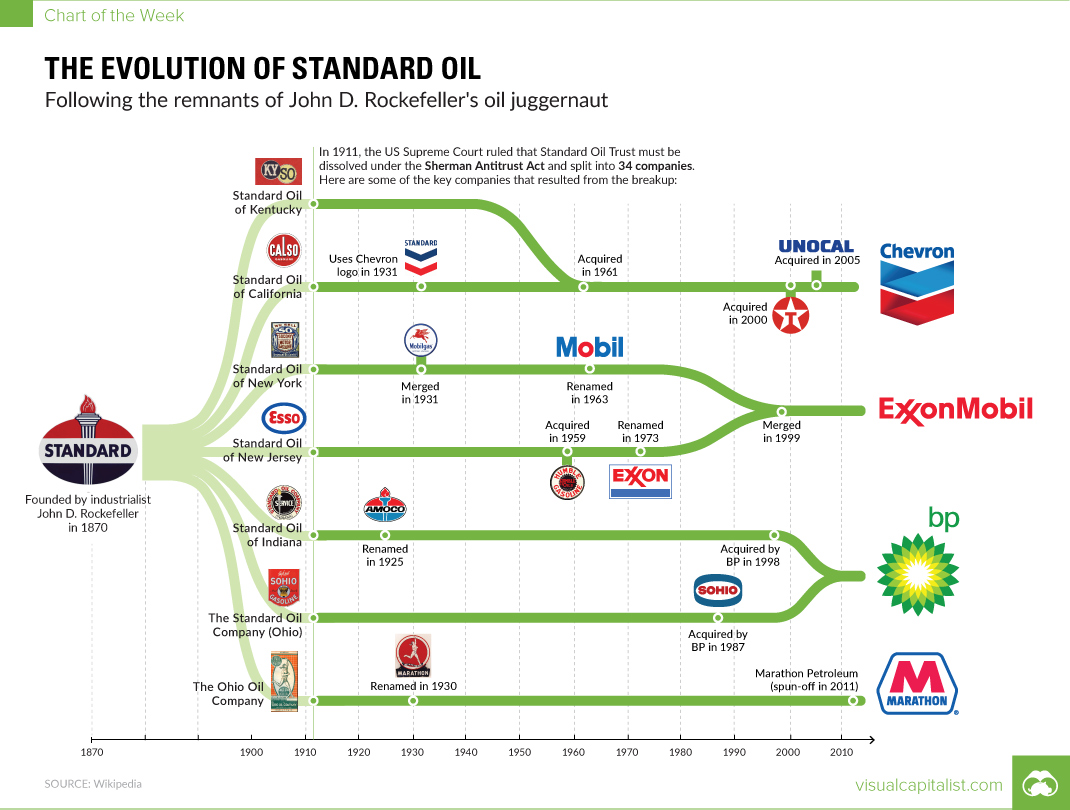
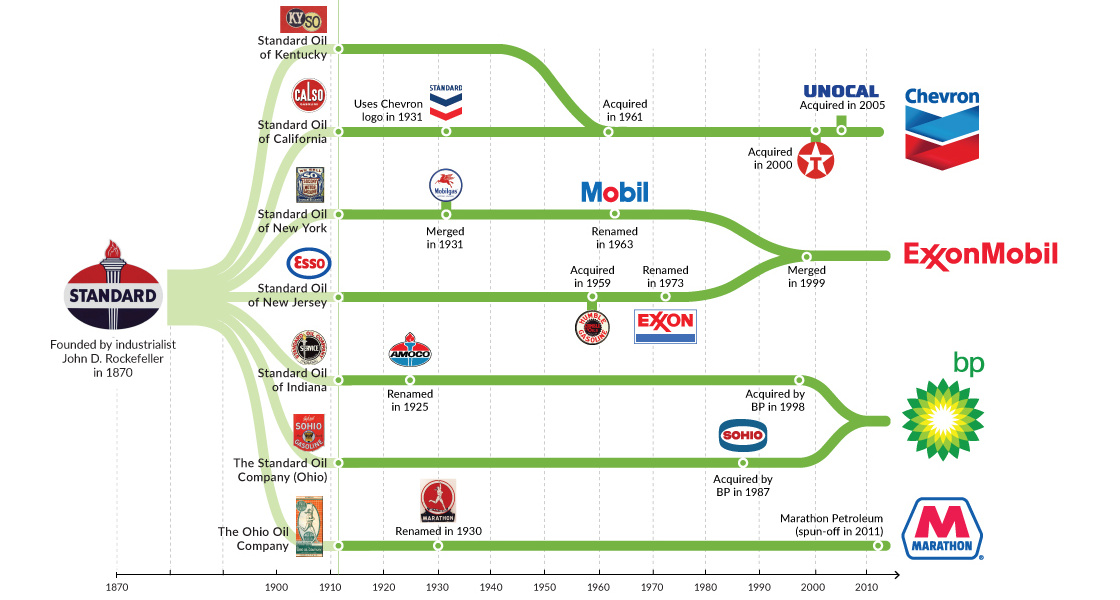
The Evolution of Standard Oil
Rockefeller’s juggernaut was split into 34 companies
The Chart of the Week is a weekly Visual Capitalist feature on Fridays.
A couple of weeks ago, we published an infographic showing how the list of the most valuable companies in the U.S. has changed drastically over the last 100 years.
Near the top of that list in 1917 is The Standard Oil Company of New Jersey, which is just one of the 34 forced spin-offs from the original Standard Oil juggernaut that was split up in 1911.
In today’s chart, we look at the “fragments” of Standard Oil, and who owns these assets today.
Monopoly Decision
At the turn of the 20th century, John D. Rockefeller’s Standard Oil was a force to be reckoned with. In the year 1904, it controlled 91% of oil production and 85% of final sales in the United States.
As a result, an antitrust case was filed against the company in 1906 under the Sherman Antitrust Act, arguing that the company used tactics such as raising prices in areas where it had a monopoly, while price gouging in areas where it still faced competition.
By the time the Standard Oil was broken up in 1911, its market share had eroded to 64%, and there were at least 147 refining companies competing with it in the United States. Meanwhile, John D. Rockefeller had left the company, yet the value of his stock doubled as a result of the split. This made him the world’s richest person at the time.
Resulting Companies
The company was split into 34 separate entities, mainly based on geographical area.
Today, the biggest of these companies form the core of the U.S. oil industry:
- Standard Oil of New Jersey: Merged with Humble Oil and eventually became Exxon
- Standard Oil of New York: Merged with Vacuum Oil, and eventually became Mobil
- Standard Oil of California: Acquired Standard Oil of Kentucky, Texaco, and Unocal, and is now Chevron
- Standard Oil of Indiana: Renamed Amoco, and was acquired by BP
- Standard Oil of Ohio: Acquired by BP
- The Ohio Oil Company: Became Marathon Oil, which eventually also spun-off Marathon Petroleum
But that’s not all – the Standard Oil asset portfolio also carried some other interesting brands that you’d recognize today:
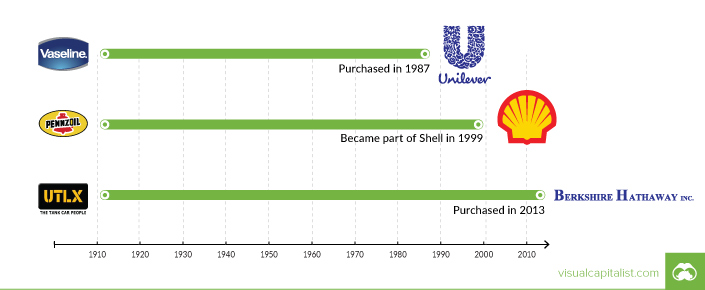
Yes, even Vaseline was originally a part of Standard Oil. Inventor Robert Chesebrough derived the product from petroleum residue, and the spun-off company (Chesebrough Manufacturing Company) was purchased by Unilever in 1987.
Meanwhile, the Union Tank Car Company is a part of Berkshire Hathaway today – and Pennzoil is owned by Royal Dutch Shell.


Energy
The World’s Biggest Nuclear Energy Producers
China has grown its nuclear capacity over the last decade, now ranking second on the list of top nuclear energy producers.


The World’s Biggest Nuclear Energy Producers
This was originally posted on our Voronoi app. Download the app for free on Apple or Android and discover incredible data-driven charts from a variety of trusted sources.
Scientists in South Korea recently broke a record in a nuclear fusion experiment. For 48 seconds, they sustained a temperature seven times that of the sun’s core.
But generating commercially viable energy from nuclear fusion still remains more science fiction than reality. Meanwhile, its more reliable sibling, nuclear fission, has been powering our world for many decades.
In this graphic, we visualized the top producers of nuclear energy by their share of the global total, measured in terawatt hours (TWh). Data for this was sourced from the Nuclear Energy Institute, last updated in August 2022.
Which Country Generates the Most Nuclear Energy?
Nuclear energy production in the U.S. is more than twice the amount produced by China (ranked second) and France (ranked third) put together. In total, the U.S. accounts for nearly 30% of global nuclear energy output.
However, nuclear power only accounts for one-fifth of America’s electricity supply. This is in contrast to France, which generates 60% of its electricity from nuclear plants.
| Rank | Country | Nuclear Energy Produced (TWh) | % of Total |
|---|---|---|---|
| 1 | 🇺🇸 U.S. | 772 | 29% |
| 2 | 🇨🇳 China | 383 | 14% |
| 3 | 🇫🇷 France | 363 | 14% |
| 4 | 🇷🇺 Russia | 208 | 8% |
| 5 | 🇰🇷 South Korea | 150 | 6% |
| 6 | 🇨🇦 Canada | 87 | 3% |
| 7 | 🇺🇦 Ukraine | 81 | 3% |
| 8 | 🇩🇪 Germany | 65 | 2% |
| 9 | 🇯🇵 Japan | 61 | 2% |
| 10 | 🇪🇸 Spain | 54 | 2% |
| 11 | 🇸🇪 Sweden | 51 | 2% |
| 12 | 🇧🇪 Belgium | 48 | 2% |
| 13 | 🇬🇧 UK | 42 | 2% |
| 14 | 🇮🇳 India | 40 | 2% |
| 15 | 🇨🇿 Czech Republic | 29 | 1% |
| N/A | 🌐 Other | 219 | 8% |
| N/A | 🌍 Total | 2,653 | 100% |
Another highlight is how China has rapidly grown its nuclear energy capabilities in the last decade. Between 2016 and 2021, for example, it increased its share of global nuclear energy output from less than 10% to more than 14%, overtaking France for second place.
On the opposite end, the UK’s share has slipped to 2% over the same time period.
Meanwhile, Ukraine has heavily relied on nuclear energy to power its grid. In March 2022, it lost access to its key Zaporizhzhia Nuclear Power Station after Russian forces wrested control of the facility. With six 1,000 MW reactors, the plant is one of the largest in Europe. It is currently not producing any power, and has been the site of recent drone attacks.

-

 Mining2 weeks ago
Charted: The Value Gap Between the Gold Price and Gold Miners
-

 Real Estate1 week ago
Ranked: The Most Valuable Housing Markets in America
-

 Business1 week ago
Charted: Big Four Market Share by S&P 500 Audits
-

 AI1 week ago
The Stock Performance of U.S. Chipmakers So Far in 2024
-

 Misc1 week ago
Almost Every EV Stock is Down After Q1 2024
-

 Money2 weeks ago
Where Does One U.S. Tax Dollar Go?
-

 Green2 weeks ago
Ranked: Top Countries by Total Forest Loss Since 2001
-

 Real Estate2 weeks ago
Visualizing America’s Shortage of Affordable Homes