Markets
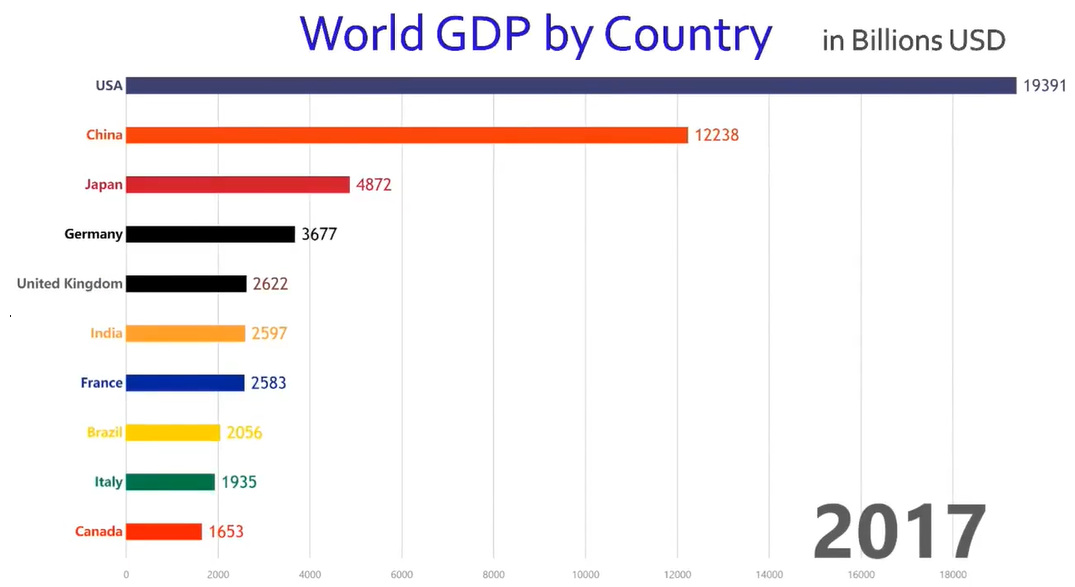
Animation: The World’s 10 Largest Economies by GDP (1960-Today)
Animation: The World’s 10 Largest Economies by GDP (1960-Today)
Just weeks ago, we showed you a colorful visualization that breaks down the $80 trillion global economy.
While such a view provides useful context on the relative size of national economies, it’s also a static snapshot that doesn’t show any movement over time. In other words, we can see the size of any given economy today, but not how it got there.
Today’s animation comes to us from WawamuStats and it charts how GDP has changed over the last 57 years for the world’s 10 largest economies.
It provides us with a lens through time, that helps show the rapid ascent of certain countries and the stagnation of others – and while there are many noteworthy changes that occur in the animation, the two most noticeable ones have been described as “economic miracles”.
Japan’s Economic Miracle
You may have heard of the “Japanese economic miracle”, a term that is used to describe the record-setting GDP growth in Japan between the end of World War II and the end of the Cold War.
Well, the above animation shows this event better than pretty much anything else.
In 1960, Japan had an economy that was only 10% of the size of the United States. But in just a decade, Japan would see sustained real GDP growth – often in the double digits each year – that allowed the country to rocket past both the United Kingdom and France to become the world’s second-largest economy.
It would hold this title consecutively between 1972 and 2010, until it was supplanted by another Asian economic miracle.
Economic Miracle, Part Deux
The other rapid ascent in this animation that can be obviously seen is that of China.
Despite falling off the top 10 list completely by 1980, new economic reforms in the 1980s and 1990s helped pave the way to the massive economy in China we know today, including the lifting of hundreds of millions of people out of extreme poverty.
By 1993, China was once again one of the world’s largest economies, just squeezing onto the above list.
By 2010 – just 17 years later – the country had surpassed titans like the United Kingdom, Germany, France, and even Japan to secure the second spot on the list, which it continues to hold today in nominal terms.


Maps
Mapped: The 10 U.S. States With the Lowest Real GDP Growth
In this graphic, we show where real GDP lagged the most across America in 2023 as high interest rates weighed on state economies.


The Top 10 U.S. States, by Lowest Real GDP Growth
This was originally posted on our Voronoi app. Download the app for free on iOS or Android and discover incredible data-driven charts from a variety of trusted sources.
While the U.S. economy defied expectations in 2023, posting 2.5% in real GDP growth, several states lagged behind.
Last year, oil-producing states led the pack in terms of real GDP growth across America, while the lowest growth was seen in states that were more sensitive to the impact of high interest rates, particularly due to slowdowns in the manufacturing and finance sectors.
This graphic shows the 10 states with the least robust real GDP growth in 2023, based on data from the Bureau of Economic Analysis.
Weakest State Economies in 2023
Below, we show the states with the slowest economic activity in inflation-adjusted terms, using chained 2017 dollars:
| Rank | State | Real GDP Growth 2023 YoY | Real GDP 2023 |
|---|---|---|---|
| 1 | Delaware | -1.2% | $74B |
| 2 | Wisconsin | +0.2% | $337B |
| 3 | New York | +0.7% | $1.8T |
| 4 | Missississippi | +0.7% | $115B |
| 5 | Georgia | +0.8% | $661B |
| 6 | Minnesota | +1.2% | $384B |
| 7 | New Hampshire | +1.2% | $91B |
| 8 | Ohio | +1.2% | $698B |
| 9 | Iowa | +1.3% | $200B |
| 10 | Illinois | +1.3% | $876B |
| U.S. | +2.5% | $22.4T |
Delaware witnessed the slowest growth in the country, with real GDP growth of -1.2% over the year as a sluggish finance and insurance sector dampened the state’s economy.
Like Delaware, the Midwestern state of Wisconsin also experienced declines across the finance and insurance sector, in addition to steep drops in the agriculture and manufacturing industries.
America’s third-biggest economy, New York, grew just 0.7% in 2023, falling far below the U.S. average. High interest rates took a toll on key sectors, with notable slowdowns in the construction and manufacturing sectors. In addition, falling home prices and a weaker job market contributed to slower economic growth.
Meanwhile, Georgia experienced the fifth-lowest real GDP growth rate. In March 2024, Rivian paused plans to build a $5 billion EV factory in Georgia, which was set to be one of the biggest economic development initiatives in the state in history.
These delays are likely to exacerbate setbacks for the state, however, both Kia and Hyundai have made significant investments in the EV industry, which could help boost Georgia’s manufacturing sector looking ahead.

-

 Personal Finance1 week ago
Visualizing the Tax Burden of Every U.S. State
-

 Misc6 days ago
Visualized: Aircraft Carriers by Country
-

 Culture7 days ago
How Popular Snack Brand Logos Have Changed
-

 Mining1 week ago
Visualizing Copper Production by Country in 2023
-

 Politics1 week ago
Charted: How Americans Feel About Federal Government Agencies
-

 Healthcare1 week ago
Which Countries Have the Highest Infant Mortality Rates?
-

 Demographics1 week ago
Mapped: U.S. Immigrants by Region
-

 Economy1 week ago
Mapped: Southeast Asia’s GDP Per Capita, by Country